Over the last 20 years whole-genome sequencing of cancer genomes supported the phenomenon of cancer mutation heterogeneity both for point and structural variants. Alongside with the whole-genome sequencing projects many next-generation sequencing experiments including ChIP-seq for histone modifications and transcription factors, DNase-seq, MeDIP-Seq, Hi-C, and others were collected for thousands of cancer genomes. Machine learning approach became an efficient method of predictive modeling because machine learning algorithms are able to consider multiple factors and their interactions and range them in an order of importance. Machine learning models, predicting cancer point mutations at 1Mb scale and using as predictors state of the chromatin, epigenetic factors and non-B DNA structures, achieved a good predictive power. However, predicting cancer breakpoints appeared to be a more difficult task than predicting point mutations. Machine learning models, that were successfully used to predict cancer point mutations, using the same features, could not achieve high performance in predicting cancer breakpoints. Nevertheless, the available models demonstrate that aggregating information from omics experiments increases the model prediction power. Here we review state-of-the art machine learning approaches to predict cancer breakpoints and discuss current understanding of the determinants of cancer breakpoint formation.
cancer breakpoints, breakpoint hotspots, genome rearrangements, machine learning, non-b dna structures, epigenetics
The large international consortium projects – The Cancer Genome Atlas (TCGA) [1], International Cancer Genome Consortium (ICGC) [2], and the ICGC/TCGA Pan-Cancer Analysis of Whole Genomes (PCAWG) Project [3] performed, processed and made publicly available thousands of whole-genome next-generation sequencing (NGS) experiments. All the accumulated data supported the phenomenon of cancer genome heterogeneity [4-6], however many studies aimed at revealing regularities in cancer mutation genome landscapes [3,7-10].
At the same time a wide range of diverse whole-genome annotation data, which include histone modifications [11], chromatin accessibility [11], DNA methylation [11], transcription factor binding sites [12], non-B DNA secondary structures [13-16], and others [17], became available providing omics studies with invaluable material. Combining modern methods of data analysis with omics data will give researchers opportunities to look from different angles (see, for example [18]) at cancer genomes and get a better understanding of cancer genome mutation determinants (Figure 1).
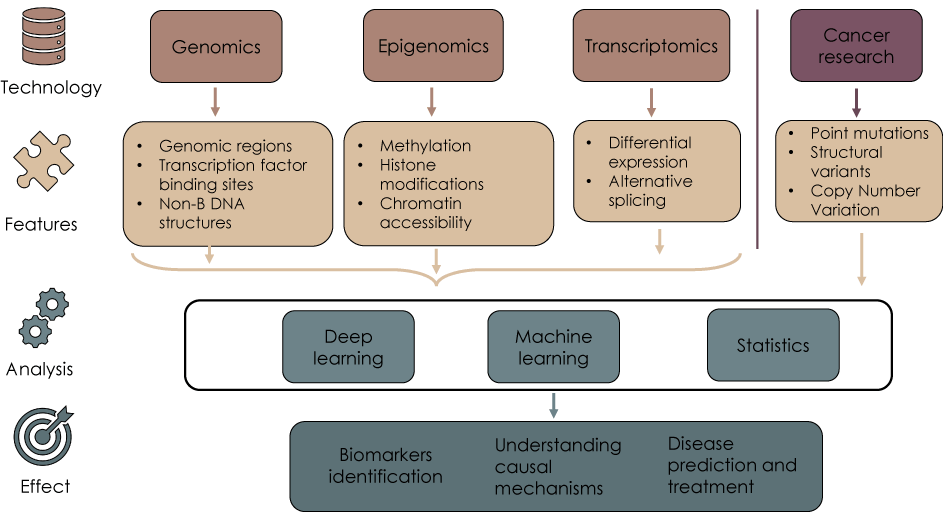
Figure 1. Integrative analysis of omics data could help understanding cancer mutation determinants
Machine learning approach became the method of choice in the era of Big Data, and the Big Data of cancer genomics is not an exception [19-21]. The role of machine learning models in genomics is not only in predicting functional genomic elements but also in revealing the factors that are associated with the genomic element of interest [22-26]. Machine learning algorithms can use heterogeneous factors as input, then range the importance of the predictors and reveal the most influential [27]. Applying machine learning approach to predict genomic regions helps understanding most influential factors associated with this region [28].
Before the machine learning era, association of factors with the studied phenomenon was inferred with statistical tests for significance of association and/or enrichment/depletion. Machine learning approach is able to reveal weak dependencies that are not detected by statistical tests [29].
In cancer genomics, one of the important tasks is to understand the factors and mechanisms lying behind the mutagenic processes. Below we describe recent studies and state-of-the-art machine learning approaches to predict cancer point mutations and breakpoints and discuss challenges in predicting cancer breakpoints.
Predictive modeling of cancer point mutations appeared to be much more effective than modeling breakpoints. Machine learning models of cancer mutation densities at 1Mb scale that aggregated data on histone modifications, CTCF binding sites, PolII binding sites, recombination rate, replication timing, nucleosome positioning, gene density, and conservation level could explain 55% of mutation variance [30]. Feature importance analysis revealed that one single feature, the histone modification H3K9me3, which is associated with heterochromatin, explains 40% of cancer point mutation variation. Considering additional features can raise model predictive power only by 15%. Thus, the machine learning approach (here, linear regression) showed that the arrangement of the genome into heterochromatin and euchromatin domains had the major influence on mutation rate [30].
Another study investigated cancer point mutation densities at 1 Mb scale with machine learning models (here, Random Forest algorithm, which is also good at feature importance analysis) using cell type-specific epigenomic features [31]. The authors showed that chromatin accessibility (as measured by DNase read densities at 1 Mb scale), histone modifications and replication timing together could explain up to 86% of the variance in point mutation rates across cancer genomes. In this case the machine learning model demonstrated a very good performance. Feature importance analysis showed that chromatin features of cell-of-origin are much stronger determinants of cancer mutation profiles when compared with chromatin features of corresponding cancer cells. The modeling also showed that the reverse task can be solved – mutation density profiles can be used to detect cell-of-origin of a cancer.
Another comprehensive study of mutation densities, again at 1 Mb scale, included data on gene expression, replication timing, heterochromatin (H3K9me3 signal) and DNA mismatch repair state (measured via microsatellite instability status) [32]. The analysis revealed a DNA mismatch repair factor as the basis of the
observed point mutation variation. The authors showed that mutations arising after the inactivation of DNA mismatch repair are no longer enriched in early replicating euchromatin as it was thought before.
Comprehensive analysis of non-coding point mutations together with indels specifically in 212 gastric cancer genomes was done in [33]. 34 point mutation hotspots were significantly enriched in CTCF binding sites, which are indicative of chromatin domain boundaries. Mutation hotspots overlapping CTCF binding sites showed chromosomal instability [33].
Local factors, such as DNA wrapped around nucleosomes, or transcription factors bound to DNA, also influence mutation rates. Influence of the local factors and their interaction with DNA repair systems and/or mutagenic agents are reviewed in [34].
Earlier, cancer breakpoint determinants were inferred via statistical enrichment/depletion and association tests. Vicinities of breakpoints were investigated for the presence of non-B DNA structures - G-quadruplexes, triplexes, cruciforms, hairpins, and Z-DNA, and 11 genes involved in well-known translocations harbored non-B DNA structures [35]. Specifically close association between presence of G-quadruplex and breakpoint regions was found in almost 70% of genes involved in rearrangements in lymphoid cancers.
Analysis of almost 700 000 cancer breakpoints revealed enrichment of the breakpoint regions for G-quadruplex forming sequences [36]. Similar to point mutations the analysis was done for densities (i.e., frequencies) of features at 1 Mb scale. Additionally for breakpoint hotspots enriched in quadruplexes the authors showed association with hypomethylated state.
Comprehensive statistical analysis of translocation and deletion breakpoints in cancer genomes confirmed significant association of breakpoints with non-B DNA structures for a large data set (around 20 000 of translocations and 46 000 of deletions) [37]. Specifically, repeats were frequently found at the translocation
breakpoints, and poly-A sites were more found at the deletion breakpoints.
Determinants of breakpoints and translocations are investigated in [38] and they include non-B DNA structures, recombination-activating genes, methylation, DNA repair processes, transcription, replication, nucleotide insufficiency, and chromatin architecture [38]. Many case studies are presented for each of the afore-mentioned factors, and overall the study supports the idea of the involvement of multiple factors and their interactions on cancer breakpoint formation.
Statistical analysis of enrichment of DNA protein binding and open chromatin was done for a set of 147 samples comprising 8 cancer types and 14600 structural mutations. It was based on 457 ENCODE protein binding ChIP-seq experiments, 125 DNase I and 24 FAIRE experiments. The study presented enrichment of protein binding and open chromatin in the vicinity of breakpoints. The effect of open chromatin state was noticeable at distances up to 200 kb around the breakpoints [39].
The experimental study with UV damage revealed that UV lesion distribution is similar to mutation rates in malignant melanoma [40]. The authors generated genome-wide map of UV-induced lesions, and analysis of breakpoints distribution showed that, surprisingly, DNase-accessible open chromatin (euchromatin) is depleted in UV-damaged regions, while heterochromatin at the nuclear periphery is vulnerable. These results agree with the results for point mutation density correlation with closed chromatin state [31].
As it was demonstrated earlier, models that predict density of somatic point mutations with machine learning approach using histone code and chromatin accessibility could explain up to 86% of the variance of the mutation densities. However machine learning models for predicting density of breakpoints could not achieve even a half of the same predictive power.
Machine learning approach to predict densities of both point mutations and breakpoints was implemented in [41]. The authors demonstrated the power of machine learning algorithms (here linear regression and Random Forest) to predict densities of mutations using different set of features including non-B DNA structures, histone markers and replication timing, as combined sets or separately. In predicting densities of point mutations (500 kB regions) the authors showed that densities of non-B DNA structures could explain from 37% (breast) to 52% (malignant lymphoma) of point mutation variance. Epigenetic features together with replication timing raise the explained variance by 10-15%, but models built on the combined predictors of epigenetic markers and non-B DNA structures always show the highest performance with explained variance in the range of 43-76% depending on the type of cancer. Predicting breakpoint densities with the same set of features is not so successful. Using the combined set of features the variance explained by the model does not exceed 10% for all cancers with an exception of 18% for the breast cancer.
Machine learning model (here, linear regression) of both liquid and solid cancers showed that breakpoints preferentially occur in open chromatin and in acrocentric chromosomes [42]. The model used chromatin density, gene density and CTCF-binding site densities as features. Multiple regression analysis identified that only chromatin density can be used as the primary statistically significant predictor.
Association analysis of breakpoints in 22 344 structural variants showed strong association with gene-rich regions [43]. Separate analyses of recurrent and nonrecurrent chromosome abnormalities showed that association also remains highly significant.
Machine learning approach for predicting density of DSB breaks, that were generated by DSBcapture [44] and BLESS [45] methods, was implemented in [46]. The authors trained Random Forest algorithm, using densities of histone marks, DNase-seq, DNA shape parameters, CTCF and p63 binding sites at 1 kb scale. Surprisingly, the model achieved extremely high prediction power of 0.97 ROC AUC. Most likely, the high predictive power of the model can be explained by the biased method of DSB generation with restriction enzyme EcoRV .
Another machine learning study explored the relationship between cancer breakpoints and methylation of CpG islands by building linear regression models. The data include more than 110 thousands DNA methylation probes with more than 13 thousands genes associated with CpG islands. It was found that methylation was altered in the vicinity of breakpoints up to ± 1 Mb region [47]. Here modeling revealed the effect of breakpoints on changes in methylome. Machine learning approach was used to study differential impact of stem-loops (or cruciform) and quadruplexes on breakpoint hotspots formation in different types of cancers [48]. The authors used logistic regression and Random Forest algorithms to predict breakpoint hotspots and estimate contribution of each variable depending on cancer types. The training set included almost half a million breakpoints, and the main result of the study is that stem-loops and quadruplexes have different impact on breakpoint formation depending on the type of cancer. Stem-loops appeared to be more important predictors for the blood, brain, liver, and prostate cancer breakpoint hotspot profiles while quadruplexes - for the bone, breast, ovary, pancreatic, and skin cancer. For the overall cancer profile and uterus cancer the joint model shows the highest performance.
Overall, all the mentioned studies tested different factors from epigenomics, transcriptiomics, non-B DNA structures, but either the models did not achieve a high predictive power on large data sets, or the study was confined only to few factors, or the data set was not large enough. All of the predictors, mentioned in this section, were found to be enriched or associated with breakpoints, but the comprehensive modeling including large sets of omics data and large sets of cancer breakpoint data has not yet been published.
The comprehensive analysis of 2,658 cancers across 38 tumor types presented by PCAWG Consortium described patterns and signatures of structural variation [49]. All documented structural variants were systematically ascribed to classes with two major divisions – complex and simple. Simple rearrangements include variants well-known before, such as deletions, inversions, duplications and translocations. However, the complex rearrangements was not well-characterized earlier and these rearrangements include chromothripsis (many breakpoints are located in one chromosomal region) and chromoplexy (breaks in several chromosomes are rejoined incorrectly), local n-jumps and cycles of templated insertions. Now, having all these classes of rearrangements (consequently, breakpoints) it is of great interest to study breakpoint determinants separately for each class, specifically for complex events such as chromothripsis and chromoplexis. Another interesting finding from PCAWG Consortium is the existence of signatures of structural variation [49]. Likewise cancer point mutations that can be reconstructed from the differential action of a finite number of mutational processes [50], structural mutations can also provide insights about mutagenic processes. The study demonstrated that the size distribution of tandem duplication and deletion is different in different patients, and frequency and patterns of structural variants vary across tumour types [49]. 16 structural-variant signatures were identified, and this opens a wide row of tasks for Machine learning modeling in order to find associations between signatures and mutagenic processes.
One of the PCAWG Consortium studies is devoted specifically to comprehensive analysis of chromotripsis. It was shown that chromothripsis is pervasive across cancers having a frequency of more than 50% in several cancer types [51]. The study also confirmed heterogeneity of chromothripsis that was found even higher than previously estimated.
Machine learning approaches that can aggregate multiple factors really help in understanding cancer breakpoint determinants. However none of the predictive models could achieve the performance of predictive models for cancer point mutations. Currently, only two groups of factors – histone modifications and non-B DNA structures were tested as predictors on large data sets. Adding other groups from omics experiments into machine learning approach – such as transcription factors biding sites, chromatin state, CTCF binding sites, methylation status, chromatin 3D organization, and other factors – likely will help in finding more or stratifying determinants of cancer breakpoint formation. The reports of comprehensive analysis of structural variation in cancers from PCAWG Consortium open new directions of breakpoint investigations: building predictive models using aggregated omics data and discovery of the mutagenic mechanisms from structural mutation signatures.
References
- 1. Atlas TCG. The Cancer Genome Atlas (TCGA).
- 2. International Cancer Genome Consortium, Hudson TJ, Anderson W, Artez A, Barker AD, et al. (2010) International network of cancer genome projects. Nature 464: 993-998. [Crossref]
- 3. ICGC/TCGA Pan-Cancer Analysis of Whole Genomes Consortium (2020) Pan-cancer analysis of whole genomes. Nature 578: 82-93. [Crossref]
- 4. Allison KH, Sledge GW (2014) Heterogeneity and cancer. Oncology (Williston Park) 28: 772-778. [Crossref]
- 5. Turajlic S, Sottoriva A, Graham T, Swanton C (2019) Resolving genetic heterogeneity in cancer. Nat Rev Genet 20: 404-416. [Crossref]
- 6. Ben-David U, Beroukhim R, Golub TR (2019) Genomic evolution of cancer models: perils and opportunities. Nat Rev Cancer 19: 97-109. [Crossref]
- 7. Nik-Zainal S, Davies H, Staaf J, Ramakrishna M, Glodzik D, et al., (2016) Landscape of somatic mutations in 560 breast cancer whole-genome sequences. Nature 534: 47-54. [Crossref]
- 8. Ha K, Kim HG, Lee H (2017) Chromatin marks shape mutation landscape at early stage of cancer progression. NPJ Genom Med 2: 9. [Crossref]
- 9. Hoadley KA, Yau C, Hinoue T, Wolf DM, Lazar AJ, et al. (2018) Cell-of-Origin Patterns Dominate the Molecular Classification of 10,000 Tumors from 33 Types of Cancer. Cell 173: 291-304. [Crossref]
- 10. Alexandrov LB, Kim J, Haradhvala NJ, Huang MN, Tian Ng AW, et al. (2020) The repertoire of mutational signatures in human cancer. Nature 578: 94-101. [Crossref]
- 11. Bernstein BE, Stamatoyannopoulos JA, Costello JF, Ren B, Milosavljevic A, et al. (2010) The NIH Roadmap Epigenomics Mapping Consortium. Nat Biotechnol 28: 1045-1048. [Crossref]
- 12. ENCODE Project Consortium (2004) The ENCODE (ENCyclopedia Of DNA Elements) Project. Science 306: 636-640. [Crossref]
- 13. Hänsel-Hertsch R, Spiegel J, Marsico G, Tannahill D, Balasubramanian S (2018) Genome-wide mapping of endogenous G-quadruplex DNA structures by chromatin immunoprecipitation and high-throughput sequencing. Nat Protoc 13: 551-564. [Crossref]
- 14. Henderson A, Wu Y, Huang YC, Chavez EA, Platt J, et al. (2014) Detection of G-quadruplex DNA in mammalian cells. Nucleic Acids Res 42: 860-869. [Crossref]
- 15. Shin SI, Ham S, Park J, Seo SH, Lim CH, et al. (2016) Z-DNA-forming sites identified by ChIP-Seq are associated with actively transcribed regions in the human genome. DNA Res 23: 477-486. [Crossref]
- 16. Sentürk Cetin N, Kuo CC, Ribarska T, Li R, Costa IG, et al. (2019) Isolation and genome-wide characterization of cellular DNA:RNA triplex structures. Nucleic Acids Res 47: 2306-2321. [Crossref]
- 17. Oki S, Ohta T, Shioi G, Hatanaka H, Ogasawara O, et al. (2018) ChIP-Atlas: a data-mining suite powered by full integration of public ChIP-seq data. EMBO Rep 19. [Crossref]
- 18. Paczkowska M, Barenboim J, Sintupisut N, Fox NS, Zhu H, et al. (2020) Integrative pathway enrichment analysis of multivariate omics data. Nat Commun 11: 735. [Crossref]
- 19. Bender E (2015) Big data in biomedicine. Nature 527: S1. [Crossref]
- 20. Torcivia-Rodriguez J, Dingerdissen H, Chang TC, Mazumder R (2019) A Primer for Access to Repositories of Cancer-Related Genomic Big Data. Methods Mol Biol 1878: 1-37. [Crossref]
- 21. Sun Y, Zhu S, Ma K, Liu W, Yue Y, et al. (2019) Identification of 12 cancer types through genome deep learning. Sci Rep 9: 17256. [Crossref]
- 22. Alipanahi B, Delong A, Weirauch MT, Frey BJ (2015) Predicting the sequence specificities of DNA- and RNAbinding proteins by deep learning. Nat Biotechnol 33: 831-838. [Crossref]
- 23. Chen Y, Li Y, Narayan R, Subramanian A, Xie X (2016) Gene expression inference with deep learning. Bioinformatics 32: 1832-1839. [Crossref]
- 24. Kelley DR, Snoek J, Rinn JL (2016) Basset: learning the regulatory code of the accessible genome with deep convolutional neural networks. Genome Res 26: 990-999. [Crossref]
- 25. Li Y, Shi W, Wasserman WW (2018) Genome-wide prediction of cis-regulatory regions using supervised deep learning methods. BMC Bioinformatics 19: 202. [Crossref]
- 26. Ni P, Su Z (2019) Deciphering epigenomic code for cell differentiation using deep learning. BMC Genomics 20: 709. [Crossref]
- 27. Shein A, Zaikin A, Poptsova M (2019) Recognition of 3'-end L1, Alu, processed pseudogenes, and mRNA stem-loops in the human genome using sequencebased and structure-based machine-learning models. Sci Rep 9: 7211. [Crossref]
- 28. Lin H, Chen W, Anandakrishnan R, Plewczynski D (2015) Application of machine learning method in genomics and proteomics. ScientificWorldJournal: 914780. [Crossref]
- 29. Min S, Lee B, Yoon S (2017) Deep learning in bioinformatics. Brief Bioinform 18: 851-869. [Crossref]
- 30. Schuster-Böckler B, Lehner B (2012) Chromatin organization is a major influence on regional mutation rates in human cancer cells. Nature 488: 504-507. [Crossref]
- 31. Polak P, Karlić R, Koren A, Thurman R, Sandstrom R, et al. (2015) Cell-of-origin chromatin organization shapes the mutational landscape of cancer. Nature 518: 360-364. [Crossref]
- 32. Supek F, Lehner B (2015) Differential DNA mismatch repair underlies mutation rate variation across the human genome. Nature 521: 81-84. [Crossref]
- 33. Guo YA, Chang MM, Huang W, Ooi WF, Xing M, et al. (2018) Mutation hotspots at CTCF binding sites coupled to chromosomal instability in gastrointestinal cancers. Nat Commun 9: 1520. [Crossref]
- 34. Gonzalez-Perez A, Sabarinathan R, Lopez-Bigas N (2019) Local Determinants of the Mutational Landscape of the Human Genome. Cell 177: 101-114. [Crossref]
- 35 Katapadi VK, Nambiar M, Raghavan SC (2012) Potential G-quadruplex formation at breakpoint regions of chromosomal translocations in cancer may explain their fragility. Genomics 100: 72-80. [Crossref]
- 36. De S, Michor F (2011) DNA secondary structures and epigenetic determinants of cancer genome evolution. Nat Struct Mol Biol 18: 950-955. [Crossref]
- 37. Bacolla A, Tainer JA, Vasquez KM, Cooper DN (2016) Translocation and deletion breakpoints in cancer genomes are associated with potential non-B DNA-forming sequences. Nucleic Acids Res 44: p. 5673-88. [Crossref]
- 38. Javadekar SM1, Raghavan SC (2015) Snaps and mends: DNA breaks and chromosomal translocations. FEBS J 282: 2627-2645. [Crossref]
- 39. Grzeda KR, Royer-Bertrand B, Inaki K, Kim H, Hillmer AM, et al. (2014) Functional chromatin features are associated with structural mutations in cancer. BMC Genomics 15: 1013. [Crossref]
- 40. García-Nieto PE, Schwartz EK, King DA, Paulsen J, Collas P, et al. (2017) Carcinogen susceptibility is regulated by genome architecture and predicts cancer mutagenesis. EMBO J 36: 2829-2843. [Crossref]
- 41. Georgakopoulos-Soares I, Morganella S, Jain N, Hemberg M, Nik-Zainal S (2018) Noncanonical secondary structures arising from non-B DNA motifs are determinants of mutagenesis. Genome Res 28: 1264-1271. [Crossref]
- 42. Lin CY, Shukla A, Grady JP, Fink JL, Dray E, et al. (2018) Translocation Breakpoints Preferentially Occur in Euchromatin and Acrocentric Chromosomes. Cancers (Basel) 10. [Crossref]
- 43. Mitelman F, Johansson B, Mertens F, Schyman T, Mandahl N (2019) Cancer chromosome breakpoints cluster in gene-rich genomic regions. Genes Chromosomes Cancer 58: 149-154. [Crossref]
- 44. Lensing SV, Marsico G, Hänsel-Hertsch R, Lam EY, Tannahill D, et al. (2016) DSBCapture: in situ capture and sequencing of DNA breaks. Nat Methods 13: 855-857. [Crossref]
- 45. Crosetto N, Mitra A, Silva MJ, Bienko M, Dojer N, et al. (2013) Nucleotide-resolution DNA double-strand break mapping by next-generation sequencing. Nat Methods 10: 361-365. [Crossref]
- 46. Mourad R, Ginalski K, Legube G, Cuvier O (2018) Predicting double-strand DNA breaks using epigenome marks or DNA at kilobase resolution. Genome Biol 19: 34. [Crossref]
- 47. Zhang Y, Yang L, Kucherlapati M, Hadjipanayis A, Pantazi A, et al. (2019) Global impact of somatic structural variation on the DNA methylome of human cancers. Genome Biol 20: 209. [Crossref]
- 48. Cheloshkina K, Poptsova M (2019) Tissue-specific impact of stem-loops and quadruplexes on cancer breakpoints formation. BMC Cancer 19: 434. [Crossref]
- 49. Li Y, Roberts ND, Wala JA, Shapira O, Schumacher SE, et al. (2020) Patterns of somatic structural variation in human cancer genomes. Nature 578: 112-121. [Crossref]
- 50 Petljak M, Alexandrov LB (2016) Understanding mutagenesis through delineation of mutational signatures in human cancer. Carcinogenesis 37: 531-540. [Crossref]
- 51. Cortés-Ciriano I, Lee JJ, Xi R, Jain D, Jung YL, et al. (2020) Comprehensive analysis of chromothripsis in 2,658 human cancers using whole-genome sequencing. Nat Genet 52: 331-341. [Crossref]