Abstract
Introduction: Some issues existed in order to maintain a high renal transplant listing rate and an adequate post-transplant follow-up. On December 2016 we implemented a Tuscany kidney Transplant Network (KTN). In every nephrology department of the region we selected two nephrologists and two nurses as referral for the renal transplant network. Our objective was to create a multidisciplinary transplant team with high level of expertise in the attempt to make homogeneous the process of selection and listing of patients for kidney transplant, and to optimize the management of post-transplant follow-up. The goal of this project was an increase of the percentage of new entries in the transplant waiting list and a shortening in the process of time-listing.
Aim of the study: The aim of our study is to evaluate the impact of the new KTN on listing transplant rate and the time-listing.
Materials and Methods: We analyzed the Tuscany kidney transplant list from 2015 to 2018 comparing the listing rate before the transplant network (2015-2016) with the same data referred to period 2017-2018.
Results: Over the period 2015-2016, 158 patients entered the waiting list for renal transplant (6,6% of dialysis patients). The variability among different centres was high (3,8-15 %). In the period 2017-2018, 239 patients entered the waiting list (9,1% of the dialysis patients, p<0,001) with an increase of 78,8%. Also the variability in listing rate among the centres was significantly reduced (11,2% vs 8,4%, p<0,01). The mean time elapsed from start to dialysis and waiting list entry was also reduced.
Conclusions: The implementation of a regional KTN with high standard qualifications of the multidisciplinary transplant teams, is able to significantly increase the percentage of new entries in transplant waiting list markedly reducing the time lapse for selection and listing.
Key Words
kidney, organization, transplant, waiting list
Introduction
It is well established that kidney transplantation is the treatment of choice for patients with an end-stage renal disease (ESRD) in terms of life expectancy [1,2] and quality of life [3,4].
In Italy the National Transplant Center (CNT) is responsible for waitlisting management and organ allocation. The organs are allocated within the region according to a national policy. This geographical model limits national kidney exchanges to national priorities for urgent or hyperimmune patients and pediatric recipients.
To ensure fair access to transplantation we must optimize the transplant candidate work-up and guarantee homogeneous evaluation criteria in eligibility for waitlisting in all nephrological centers.
Since many years Tuscany is a leading region in Europe, for donation and transplant rate nevertheless, some issues existed in order to maintain a high renal transplant listing rate and an adequate post-transplant follow-up. Recent provisions of Ministry of Health have allowed a regional transplant organisation based no longer on the single transplant center but rather centered on a regional network among Nephrology and Transplant centers. This model makes possible to enhance transplantation activities, to provide a greater homogeneity of care paths and to create a link between the University highly specialized surgical departments and multidisciplinary hospital teams. In December 2016, we implemented a Tuscany kidney Transplant Network (TKTN) with the aim to create a multidisciplinary transplant team with high level of expertise in the attempt to make homogeneous the process of selection and listing of patients for kidney transplant, and to optimize the management of post-transplant follow-up.
The aim of the present study was to evaluate the results in terms of increase of the percentage of new entries in the transplant waiting list and shortening in the process of time-listing.
Materials and Methods
We conducted a retrospective multicenter study, analyzing the data obtained from the Registry of Dialysis and Transplantation and from the waiting list for kidney transplant of the Tuscany before (2015) and after (2018) the creation of the transplant kidney network. The primary endpoint was the impact of the new Tuscany Kidney Transplant Network (TKTN) on listing transplant rate and time listening.
In 2016 we selected two nephrologists and two nurses in each nephrology centres of the region as referral for the renal transplant network to undergo a proper training and to be enrolled in a master course on renal transplantation, held by national transplants experts, with the aim of creating a Tuscany KTN (Figure 1).
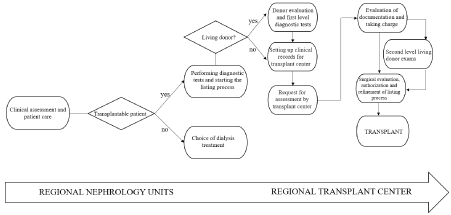
Figure 1. Pathway from listing to transplant: the basis for Tuscany transplant kidney network
We therefore moved from a transplant system hospital centered with different paths of inclusion, waitlisting and follow-up management to a Network of facilities that share objectives and operating models.
The network actually includes 3 transplant centers and 21 main nephrology centers. In Tuscany the resident population is 3.692.555 according to data from ISTAT as of December 31, 2019; 4968 were undergoing extracorporeal renal replacement treatment, with a prevalence of 0,14 percent.
We described demographic and clinical characteristics of our ESRD population selected and afterward we mainly focused on new incidents in transplant waiting list in this time lapse.
Therefore, we compared the listing rate and the time of listing before the transplant network (2015-2016) adjusted for the prevalence of dialysis patients in the same period, with the same data referred to period 2017-2018, after the implementation of transplant network (Figure 2).
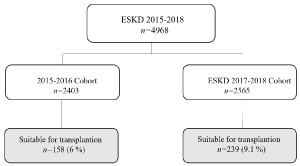
Figure 2. Transplant candidates divided by biennium
A shared document about diagnostic therapeutic care pathway (“Diagnostic Therapeutic Assistance Path”, PDTA) for all the facilities involved in the renal transplant network in our region, based on the KDIGO guidelines, was created to support the project.
Statistical analysis
The results were expressed as mean values (± SD) for continuous variables and as frequency (%) for nominal variables.
Chi-square test and Student’s t-test or Mann–Whitney test were used to compare proportions and means, respectively. Correlations were reported as either the Pearson correlation coefficient or the Spearman rank correlation coefficient.
The level of statistical significance (p value) was set at 0.05. Data analyses were performed using the SPSS statistical package 20.0 for Windows (SPSS Inc., Chicago, IL, USA).
Results
In our cohort study the most prevalent group by age range is between 65 and 79 years old (35.1%), followed by the group over 80 years old (28.4 %). There was a prevalence of male gender (64.1%).
Diabetic kidney disease (25.8 %) and hypertensive nephropathy (22.9%) were the principal diseases; primary glomerulonephritis was diagnosed in 15,4% of cases.
Renal replacement therapy was hemodialysis modality in 88.6 %, whereas peritoneal dialysis was in 11,4 %.
The principal comorbidities were cardiovascular diseases (58,8%), hypertension (68.5 %), and peripheral vascular disease (49.5%).
There were no statistically significant differences between the two cohort study groups analyzed in terms of demographic and clinical characteristics (Table 1).
Characteristics |
All
n= 4968 |
2015-2016
n=2403 |
2017-2018
n=2565 |
P value
|
Male gender, n (%) |
3187 (64.1 %) |
1556 (64.7 %) |
1631 (63.6 %) |
0.407 |
Age range (%),
20-34
35-49
50-64
65-79
>80 |
297 (5.9 %)
496 (10.0 %)
1016 (20.4 %)
1745 (35.1 %)
1414 (28.4 %) |
145 (6.0 %)
243 (10.1 %)
492 (20.5 %)
855 (35.6 %)
668 (27.8 %) |
152 (5.9 %)
253 (9.9 %)
524 (20.4 %)
890 (34.7 %)
740 (28.8 %) |
-
-
-
-
- |
Diagnosis,
GN, n (%)
PN, n (%)
PKD, n (%)
DM, n (%)
NS, n (%)
RVD, n (%)
Miscellaneous, n (%)
Unknown/missing, n (%) |
767 (15.4 %)
341 (6.9 %)
392 (7.9 %)
1282 (25.8 %)
1142 (22.9 %)
317 (6.4 %)
254 (5.1 %)
497 (10.0 %) |
370 (15.4 %)
170 (7.1 %)
189 (7.9 %)
617 (25.7 %)
550 (22.7 %)
148 (6.2 %)
129 (5.4 %)
231 (9.6 %) |
397 (15.5 %)
171 (6.7 %)
203 (7.9 %)
665 (25.9 %)
592 (23.1 %)
169 (6.6 %)
125 (4.9 %)
266 (10.4 %) |
0.968
0.575
0.958
0.494
0.893
0.561
0.439
0.394 |
Dialysis Modalities |
|
|
|
|
Hemodialysis, n (%)
HD, n (%)
HDF, n (%)
HD in limited care center, n (%)
Home dialysis, n (%) |
4403 (88.6 %)
2846 (64.6 %)
775 (17.6 %)
686 (15.6 %
96 (2.2 %) |
2140 (89.1 %)
1373 (64.2 %)
377 (17.6 %)
343 (16.0 %)
47 (2.2 %) |
2263 (88.2 %)
1473 (65.1 %)
398 (17.6 %)
343 (15.2 %)
49 (2.2 %) |
0.371
0.528
1.0
0.408
1.00 |
Peritoneal dialysis, n (%)
APD, n (%)
CAPD, n (%) |
565 (11.4 %)
289 (51.2 %)
281 (49.8 %) |
263 (10.9 %)
136 (51.7 %)
127 (48.3 %) |
307 (11.8 %)
153 (49.8 %)
154 (50.1 %)
|
0.265
0.675
0.675 |
Main comorbidity |
|
|
|
|
Cardiopathy, n (%) |
2924 (58.9 %) |
1449 (60.3 %) |
1475 (57.5 %) |
0.046 |
Diabetes, n (%) |
1877 (37.8 %) |
927 (38.6 %) |
950 (37.0 %) |
0.266 |
Hypertension, n (%) |
3401 (68.5 %) |
1660 (69.1 %) |
1741 (67.9 %) |
0.375 |
Chronic liver disease, n (%) |
528 (10.6 %) |
263 (10.9 %) |
265 (10.3 %) |
0.489 |
Cerebrovascular disease, n (%) |
1472 (29.6 %) |
731 (30.4 %) |
741 (28.9 %) |
0.237 |
Peripheral vascular disease, n(%) |
2457 (49.5 %) |
1212 (50.4 %) |
1245 (48.5 %) |
0.182 |
Infections, n (%) |
666 (13.4 %) |
328 (13.6 %) |
338 (13.2 %) |
0.646 |
Chronic lung disease, n (%) |
1873 (37.7 %) |
926 (38.5 %) |
947 (36.9 %) |
0.241 |
Note: SD, standard deviation; GN, primary glomerulonephritis; PN, pyelonephritis and interstitial nephritis; PKD polycystic kidney disease, DN, diabetic nephropathy; NS, nephroangiosclerosis; RVD, vascular renal disease; HD, hemodialysis; HDF, hemodiafiltration; APD, automated peritoneal dialysis; CAPD, continuous ambulatory peritoneal dialysis
Over the period 2015-2016, 158 patients entered the waiting list for renal transplant and they represented the 6,6% of dialysis patients and the variability among different centres was high (11,2 %). In the period 2017-2018, 239 patients (9,1%) entered the waiting list with an increase of 78,8% (p<0,001). The variability in listing rate among the centres was significantly reduced from 11,2% to 8,4%, (p<0,01) (Table 2). The mean time elapsed from start to dialysis and waiting list entry was also reduced from 158 ± 47 days to 121 ± 38 (p<0,05).
Table 1. Main demographics and clinical characteristics of our Tuscan ESKD population
Table 2. Main characteristics of waiting list’patients by biennium
Characteristics |
2015-2016
n= 158 |
2017-2018
n=239 |
P value
|
Male gender, n (%) |
99 (62.6 %) |
136 (56.9 %) |
0.296 |
Mean age |
52,1±10,6 |
51,8±10,2 |
|
Blood type distribution, n (%)
0+, n (%)
A+, n (%)
B+, n (%)
A-, n (%)
0-, n (%)
AB+, n (%)
B-, n (%) |
70 (44.3 %)
48 (30.4 %)
13 (8.2 %)
9 (5.7 %)
8 (5.1 %)
7 (4.4 %)
3 (1.9 %) |
99 (41.4 %)
89 (37.2 %)
23 (9.6 %)
10 (4.1 %)
10 (4.1 %)
6 (2.5 %)
2 (0.8 %) |
0.604
0.163
0.722
0.483
0.806
0.388
0.391 |
Percentage of patients with preformed antibodies |
47 % |
84% |
<0.001 |
Percentage of patients on waiting list compared to dialysis patients |
158 (6.6 %) |
239 (9.1 %) |
<0.001 |
Variability in listing rate among the centres |
11.2 % |
8.4 % |
<0.01 |
Duration of the process of waiting-listing, SD, days |
158 ± 47 |
121 ± 38 |
<0.05 |
Note: SD, standard deviation
* time elapsed from start to dialysis and waiting list entry
Discussion
Kidney transplantation is the treatment of choice to replace renal function for patients with end-stage renal disease (ESRD), as transplant recipients enjoy freedom from dialysis and improvement in both quality and length of life.
The number of people receiving renal replacement therapy all over the world actually exceeds 2,5 million and is projected to double to 5,4 million by 2030 [5]. Many ESRD patients start dialysis with uremia-related comorbidities, which are associated with high mortality while remaining on dialysis [6,7].
Several studies demonstrated that waiting time on dialysis is a strong risk factor for decreased patient and graft survival following renal transplantation. Therefore, transplant outcome, is closely related to the dialytic age [8]. Moreover, patients who receive a preemptive renal transplant have a survival advantage over patients who receive a renal transplant after a period of maintenance dialysis [9].
Time elapsed from initiation of dialysis and transplantation is the result of time for placement into the transplantation list and waiting list time: while the latter is the consequence of organ shortage and the patient characteristics (i.e. ABO, HLA antibodies, etc.), the former should be maximally optimized to allow patients to enter in the transplant list before the start or within few months of dialysis.
Recent international data suggest that exists a strong variability in the time elapsed to place new patient in list, among different countries. [10]
Many factors influence this variability, which have not yet been sufficiently detailed.
A large number of US studies have shown that access to renal transplantation is reduced for racial minorities, women [11-15], regional and geographic variations, and level of education [16-17]. Moreover, patients whose pretransplant care is at a transplant center are more likely to be registered on the transplant waiting list than patients who are cared for in a nontransplant renal unit [16].
Futhermore, data from US registry showed a lower rate of listing in private nephrology centers [18-19].
In this country, insurance status has also been reported as an independent predictive variable determining access to the renal transplant list [20-22].
In France, Bayat, et al. considered patient- and region-level factors and showed that both were associated with waiting-list placement. At the patient level, they confirmed American data about influence of nonmedical factors (such as low socio-economical status and female gender) in transplant listing. Diabetes and others comorbidities were associated with a lower probability of waitlisting. Interestingly, as opposed to American data, treatment at a private not-for-profit dialysis facility was associated with a higher probability of being waitlisted. [10]
Similarly in UK, age and comorbidity, female gender, social deprivation, and whether pretransplant care was in a nontransplant renal unit were all factors associated with a reduced chance of listing for transplantation [23]. In a number of countries, late referral of patients with established renal failure also reduces access to renal transplantation [24-27]. In contrast with studies from both the United States and Scotland, gender was not a significant determinant of access to the waiting list, suggesting that in England and Wales disparities have been eliminated that have led to a gender bias in other systems [23,28,29].
To our knowledge, in Italy no other study specifically focusing on access to renal transplant waiting lists has taken into account both patient-level and region-level factors.
In particular, in Tuscany, ethnic, cultural and socio-economic differences are minimal and are unable to explain the large variability observed. Moreover, in our country, there are no differences in nephrology density/specialist and general practitioner and there are no private dialysis centers to justify regional differences.
In our opinion, the main elements, correlated to this variability, seems to be linked to organizational issues, lack communication among centres, training aspects and wait listing practices.
According to Italian Transplant Registry annual report, Tuscany is one of the leading regions for organ donation. Nevertheless, until 2016 the percentage of new incident dialysis patients on waiting list for kidney transplant was unsatisfactory, because of long time interval to enter in the list for transplant with large differences among the nephrology centres.
We hypothesized that the disparities in the access to renal transplant waiting list may be explained by variations in health care supply resources and medical practices. This prompted us, in the attempt to overcome these critical issues, to create a regional transplant network (KTN), no longer centered on single transplant centre, but based on a network frame system which links regional nephrology units with the kidney transplant regional centres.
With the aim of developing this project, a team of at least two nephrologists and two nurses has been identified as referents of renal transplantation in each nephrology unit to be enrolled in a master course on renal transplantation held by national transplants experts. This project let the development of a territorial care pathway to make homogeneous, in the whole region, the process of inclusion/manteinance in the transplant list and the management of post-transplant follow-up.
After two years we observed a significant increase in the rate of listing (78.8%, p<0.001), a reduction in the time elapsed to be placed in list (from 158 ± 47 days to 121 ± 38; p<0.05) and less variability between centers (from 11.2% to 8.4%; p<0.01).
The KTN establishment has shown that sharing the same pathway throughout the region and high level of training dramatically improved the time elapsed and the rate in waiting list placement.
Conclusions
Considering the annual increase in the number of patients waiting for a renal transplant, it is imperative that transplant team takes action proactively at various levels in the development of the process of the waiting list. The Tuscan KTN model aims to reduce the time elapsed to be enrolled in the waiting list due to organizational inefficiencies and clinical issues.
In our experience the KTN significantly increased the percentage of new entries in transplant waiting list markedly reducing the time lapse for selection and listing, even in a leading region for donation and transplant rate, promoting more structural, organizational and training efficiency. Further studies are needed to confirm if our data are reproducible in other regional and national contexts.
We believe that continuous medical education at master level may be a significant factor in optimizing knowledge, efficiency and effectiveness of renal transplant program.
Conflict of interest
Researchers do not have any conflict of interest to disclose.
References
- Wolfe RA, Ashby VB, Milford EL, Ojo AO, Ettenger RE, et al. (1999) Comparison of mortality in all patients on dialysis, patients on dialysis awaiting transplantation, and recipients of a first cadaveric transplant. N Engl J Med 341: 1725-1730. [Crossref]
- Rabbat CG, Thorpe KE, Russell JD, Churchill DN (2000) Comparison of mortality risk for dialysis patients and cadaveric first renal transplant recipients in Ontario, Canada. J Am Soc Nephrol 11: 917-922. [Crossref]
- Maglakelidze N, Pantsulaia T, Tchokhonelidze I, Managadze L, Chkhotua A (2011) Assessment of health-related quality of life in renal transplant recipients and dialysis patients. Transplant Proc 43: 376-379. [Crossref]
- Franke GH, Reimer J, Philipp T, Heemann U (2003) Aspects of quality of life through end-stage renal disease. Qual Life Res 12: 103–115. [Crossref]
- Liyanage T, Ninomiya T, Jha V, Neal B, Patrice HM, et al. (2015) Worldwide access to treatment for end-stage kidney disease: a systematic review. Lancet 385: 1975-1982. [Crossref]
- Hernández D, de la Nuez PC, Muriel A, Ruiz-Esteban P, González-Molina M, et al. (2014) Clinical assessment of mortality risk in renal transplant candidates in Spain. Transplantation 98: 653-659. [Crossref]
- Modi ZJ, Lu Y, Ji N, Kapke A, Selewski DT, et al. (2019) Risk of Cardiovascular Disease and Mortality in Young Adults With End-stage Renal Disease: An Analysis of the US Renal Data System. JAMA Cardiol 4: 353-362. [Crossref]
- Meier-Kriesche HU, Port FK, Ojo AO, Rudich SM, Hanson JA, et al. (2000) Effect of waiting time on renal transplant outcome. Kidney Int 58: 1311-1317. [Crossref]
- Asderakis A, Augustine T, Dyer P, Short C, Campbell B, et al. (1998) Pre-emptive kidney transplantation: The after transplantation. Therefore, long-term dialysis pa- attractive alternative. Nephrol Dial Transplant 13: 1799-1803. [Crossref]
- Bayat S, Macher MA, Couchoud C, Bayer F, Lassalle M, et al. (2015) Individual and regional factors of access to the renal transplant waiting list in france in a cohort of dialyzed patients. Am J Transplant 15: 1050-1060. [Crossref]
- Wolfe RA, Ashby VB, Milford EL, Bloembergen WE, Agodoa LY, et al. (2000) Differences in access to cadaveric renal transplantation in the United States. Am J Kidney Dis 36: 1025-1033. [Crossref]
- Hardinga K, Mershab TB, Phamc PT, Watermanc AD, Webbe FJ, et al. (2000) Health Disparities in Kidney Transplantation for African Americans. Am J Nephrol 46: 165-175. [Crossref]
- Epstein AM, Ayanian JZ, Keogh JH, Noonan SJ, Armistead N, et al. (2000) Racial disparities in access to renal transplantation – clinically appropriate or due to underuse or overuse? N Engl J Med 343: 1537-1544. [Crossref]
- Monson RS, Kemerley P, Walczak D, Benedetti E, Oberholzer J, et al. (2015) Disparities in completion rates of the medical prerenal transplant evaluation by race or ethnicity and gender. Transplantation 99: 236-242. [Crossref]
- Malek SK, Keys BJ, Kumar S, Milford E, Tullius SG (2011) Racial and ethnic disparities in kidney transplantation. Transpl Int 24: 419-424. [Crossref]
- Garg PP, Frick KD, Diener-West M, Powe NR (1999) Effect of the ownership of dialysis facilities on patients’ survival and referral for transplantation. N Engl J Med 341: 1653. [Crossref]
- Ashby VB, Kalbfleisch JD, Wolfe RA, Lin MJ, Port FK, et al. (2007) Geographic variability in access to primary kidney transplantation in the United States, 1996–2005. Am J Transplant 7: 1412-1423. [Crossref]
- Zhang Y, Thamer M, Kshirsagar O, Cotter DJ, Schlesinger MJ (2014) Dialysis chains and placement on the waiting list for a cadaveric kidney transplant. Transplantation 5: 543-551. [Crossref]
- Schold JD, Gregg JA, Harman JS, Hall AG, Patton PR, et al. (2011) Barriers to evaluation and wait listing for kidney transplantation. Clin J Am Soc Nephrol 6: 1760-1767. [Crossref]
- Thamer M, Henderson SC, Ray NF, Rinehart CS, Greer JW, et al. (1999) Unequal access to cadaveric kidney transplantation in California based on insurance status. Health Serv Res 34: 879-900. [Crossref]
- Axelrod D, Guidinger M, Finlayson S, Schaubel DE, Goodman DC, et al. (2008) Rates of solid-organ waitlisting, transplantation and survival among residents of rural and urban areas. JAMA 299: 202-207. [Crossref]
- Schaeffner ES, Mehta J, Winkelmayer WC (2008) Educational level as a determinant of access to and outcomes after kidney transplantation in the United States. Am J Kidney Dis 51: 811-818. [Crossref]
- Oniscu GC, Schalkwijk AAH, Johnson RJ, Forsythe JLR, et al. (2003) Equity of access to renal transplant waiting list and renal transplantation in Scotland: Cohort study. BMJ 327: 1261 [Crossref]
- Cass A, Cunningham J, Snelling P, Ayanian JZ (2003) Late referral to a nephrologist reduces access to renal transplantation. Am J Kidney Dis 42: 1043-1049. [Crossref]
- Kessler M, Frimat L, Panescu V, Briançon S (2003)Impact of nephrology referral on early and midterm outcomes in ESRD: EPide´miologie de l’Insuffisance REnale chronique terminale en Lorraine (EPIREL): Results of a 2-year, prospective, community-based study. Am J Kidney Dis 42: 474. [Crossref]
- Winkelmayer WC, Mehta J, Chandraker A, J Avorn (2007) Predialysis nephrologist care and access to kidney transplantation in the United States. Am J Transplant 7: 872-879. [Crossref]
- Oniscu GC, Schalkwijk AAH, Johnson RJ, Brown H, Forsythe JLR (2003) Equity of access to renal transplant waiting list and renal transplantation in Scotland: Cohort study. BMJ 327: 1261-1270. [Crossref]
- Garg PP, Furth SL, Fivush BA, Powe NR (2000) Impact of gender on access to the renal transplant waiting list for pediatric and adult patients. J Am Soc Nephrol 11: 958-964. [Crossref]
- Ravanan R, Udayaraj U, Ansell D, Collett D, Johnson R, et al. (2010) Variation between centres in access to renal transplantation in UK: Longitudinal cohort study. BMJ 341: 3451. [Crossref]