The problem of missing teeth and edentulous is worldwide. Replacing teeth by dental implant is a successful treatment option. Focus on these factors that enhance the overall success rate of is become important subject. The variation in dental implant geometry, designs and surface texture provided by the manufacturing companies is become important controlling factors on successful treatment.
Objectives: Use variable diameter and length to calculate the success percent of dental implant.
Materials and method: Prospective study involve (680) patients come department of dental implantology in Al-Ramadi city health center between (May 2007-May 2018). 870 easy implant® by French dental implants manufacturer, conical with internal hexagon are used to replace teeth in variety of length and diameter:Max. Central incisor 5×11.5, Max. lateral incisors 5×8.5, Max. canine 5×8.5, Max. 1st premolar 4.3×11, Max. 2nd premolar 4.3-8, Max. molars 5×7, Mand. central incisors 3.5×10, Mand. lateral incisor 3.5×10.5, Mand. canine 3.5×11.5, Mand. 1st premolar 3.5×8, Mand. 2nd premolar 3.4×8, Mand. molars 4.5×7.
Results: The statistical results indicate that the higher survival rate was (95%) in the Anterior incisors area due standard diameter and length of dental implant. The mean difference is significant at 0.05 level (P<0.05).
Conclusion: Use of standardized diameter, length of dental implant is one factors used to enhance the success rate of this treatment.
success rate, diameter, length, marginal bone loss
The problem of loss of teeth due to extensive caries and periodontal disease is worldwide. Replacement of missing teeth by endosseous implant engage wide use by many dentists other than use fixed bridge and removable denture [1]. Dental implant is that metal component that inserted surgically in jawbone to holed fixed bridge and crown and over dentures. It's act by dissipate force to surrounding bone. Such load affects the stability and survival rate of dental implant [2]. The success rate of dental implant is become very high nowadays due development of new designs, number and load characteristics. The main mechanical benefit from dental implant geometry to dissipate the applied load to peri-implant bone [3,4]. The high stress over the bone surrounding dental implant induced by improper transmission of load due to defect in prosthetic appliance, occlusion, dental implant design and also surgical procedures [5]. Other factors like nature of surrounding bone and dental implant materials. The distribution of dental implant in jaw is other factor that affect the stress transmitted over ossteointegrted implant [6]. The used of short dental implant in molar area due mechanical and anatomical limitation [7]. The high occlusal force over the molar teeth in comparison to anterior teeth make size of dental implant of important factor. High force of occlusion also affect the success of ostointegation [8]. Large size of dental implant in molar area affect the thickness of surrounding bone and finally the success of placement of dental implant placed in such high stress area and other problem related to operative skill [9]. Bone quality and height and location of vital anatomical structure in the jaw bones is also other factors to be considered [10]. Wide diameter dental implant is also used as successful replacement of fractured and non osteointegrated implant [11]. For such reason conical shaped threaded implant of various diameters and length has been developed to enhance the survival rate of dental implants [12].
Prospective study involve (680) patients come to Al-Ramadi health center in department of dental implantology between (May 2007-May 2108).820 easy implant® by franch dental implants manufacturer, conical with internal hexagon are used in variety length and diameter:Max. Central incisor 5×11.5, Max. lateral incisors 5×8.5, Max. canine 5×8.5, Max. 1st premolar 4.3×11, Max. 2nd premolar 4.3-8, Max. molars 5×7, Mand. central incisors 3.5×10, Mand. lateral incisor 3.5×10.5, Mand. canine 3.5×11.5, Mand. 1st premolar 3.5×8, Mand. 2nd premolar 3.4×8, Mand. molars 4.5×7. Patients included in study were selected using specific criteria:patients must be free from systemic diseae, normal blood sugar, good oral health and socioeconomic level. Clinical and radio graphical examination were done before surgery. Dental implant surgery was done under local anesthesia (2% Lidocaine with 80.000 adrenalin). Surgical flap (full thickness) were done by scalpel. Dental implant bed was made using standardized drills of dental implant kit, holes were made in jawbone under continuous irrigation with normal saline. The dental implant was paced and the flap replaced and suture using 3/0 black silk. The dental implant were left in load free period. After 4 months the dental implant were uncovered and gingiva former were placed. After 1-week transfer coping were placed and dental impression was taken by alginate. After 1 week the dental appliance were placed. After 1 year the patient were examined clinically, a criterion used for assessment of successful dental implantation are: No pain or tenderness, no mobility, no radiographical bone loss, no pus, no gingival bleeding and no infection. The crestal bone resorption was measured mesially and distally with caliber and the success rate was estimated.
The statistical analysis in below Tables 1-16 indicate the following (Figures 1-5).
Table 1. Descriptive statistical table
Diameter |
|
N |
Mean |
Std. Deviation |
Std. Error |
95% Confidence Interval for Mean |
Minimum |
Maximum |
Lower Bound |
Upper Bound |
Anterior Maxilla |
3 |
5.0000 |
.00000 |
.00000 |
5.0000 |
5.0000 |
5.00 |
5.00 |
Posterior Maxilla |
3 |
4.5333 |
.40415 |
.23333 |
3.5294 |
5.5373 |
4.30 |
5.00 |
Anterior Mandible |
3 |
3.5000 |
.00000 |
.00000 |
3.5000 |
3.5000 |
3.50 |
3.50 |
Posterior Mandible |
3 |
3.8333 |
.57735 |
.33333 |
2.3991 |
5.2676 |
3.50 |
4.50 |
Total |
12 |
4.2167 |
.68202 |
.19688 |
3.7833 |
4.6500 |
3.50 |
5.00 |
Table 2. ANOVA test
Diameter |
|
Sum of Squares |
df |
Mean Square |
F |
Sig. |
Between Groups |
4.123 |
3 |
1.374 |
11.069 |
.003 |
Within Groups |
.993 |
8 |
.124 |
- |
- |
Total |
5.117 |
11 |
- |
- |
- |
Table 3. Multiple comparison table
Dependent Variable: Diameter |
LSD |
(I) Position of dental implant |
(J) Position of dental implant |
Mean Difference (I-J) |
Std. Error |
Sig. |
95% Confidence Interval |
Lower Bound |
Upper Bound |
Anterior Maxilla |
Posterior Maxilla |
.46667 |
.28771 |
.143 |
-.1968- |
1.1301 |
Anterior Mandible |
1.50000* |
.28771 |
.001 |
.8365 |
2.1635 |
Posterior Mandible |
1.16667* |
.28771 |
.004 |
.5032 |
1.8301 |
Posterior Maxilla |
Anterior Maxilla |
-.46667- |
.28771 |
.143 |
-1.1301- |
.1968 |
Anterior Mandible |
1.03333* |
.28771 |
.007 |
.3699 |
1.6968 |
Posterior Mandible |
.70000* |
.28771 |
.041 |
.0365 |
1.3635 |
Anterior Mandible |
Anterior Maxilla |
-1.50000-* |
.28771 |
.001 |
-2.1635- |
-.8365- |
Posterior Maxilla |
-1.03333-* |
.28771 |
.007 |
-1.6968- |
-.3699- |
Posterior Mandible |
-.33333- |
.28771 |
.280 |
-.9968- |
.3301 |
Posterior Mandible |
Anterior Maxilla |
-1.16667-* |
.28771 |
.004 |
-1.8301- |
-.5032- |
Posterior Maxilla |
-.70000-* |
.28771 |
.041 |
-1.3635- |
-.0365- |
Anterior Mandible |
.33333 |
.28771 |
.280 |
-.3301- |
.9968 |
*The mean difference is significant at the 0.05 level. |
Table 4. Descriptive statistical table
Length |
|
N |
Mean |
Std. Deviation |
Std. Error |
95% Confidence Interval for Mean |
Minimum |
Maximum |
Lower Bound |
Upper Bound |
Anterior Maxilla |
3 |
9.6000 |
1.65227 |
.95394 |
5.4955 |
13.7045 |
8.50 |
11.50 |
Posterior Maxilla |
3 |
8.6667 |
2.08167 |
1.20185 |
3.4955 |
13.8378 |
7.00 |
11.00 |
Anterior Mandible |
3 |
10.6667 |
.76376 |
.44096 |
8.7694 |
12.5640 |
10.00 |
11.50 |
Posterior Mandible |
3 |
7.6667 |
.57735 |
.33333 |
6.2324 |
9.1009 |
7.00 |
8.00 |
Total |
12 |
9.1500 |
1.67250 |
.48281 |
8.0873 |
10.2127 |
7.00 |
11.50 |
Table 5. ANOVA test
Length |
|
Sum of Squares |
df |
Mean Square |
F |
Sig. |
Between Groups |
14.810 |
3 |
4.937 |
2.475 |
.136 |
Within Groups |
15.960 |
8 |
1.995 |
- |
- |
Total |
30.770 |
11 |
- |
- |
- |
Table 6. Multiple comparison table
Dependent Variable: Length |
LSD |
(I) Position of dental implant |
(J) Position of dental implant |
Mean Difference (I-J) |
Std. Error |
Sig. |
95% Confidence Interval |
Lower Bound |
Upper Bound |
Anterior Maxilla |
Posterior Maxilla |
.93333 |
1.15326 |
.442 |
-1.7261- |
3.5927 |
Anterior Mandible |
-1.06667- |
1.15326 |
.382 |
-3.7261- |
1.5927 |
Posterior Mandible |
1.93333 |
1.15326 |
.132 |
-.7261- |
4.5927 |
Posterior Maxilla |
Anterior Maxilla |
-.93333- |
1.15326 |
.442 |
-3.5927- |
1.7261 |
Anterior Mandible |
-2.00000- |
1.15326 |
.121 |
-4.6594- |
.6594 |
Posterior Mandible |
1.00000 |
1.15326 |
.411 |
-1.6594- |
3.6594 |
Anterior Mandible |
Anterior Maxilla |
1.06667 |
1.15326 |
.382 |
-1.5927- |
3.7261 |
Posterior Maxilla |
2.00000 |
1.15326 |
.121 |
-.6594- |
4.6594 |
Posterior Mandible |
3.00000* |
1.15326 |
.032 |
.3406 |
5.6594 |
Posterior Mandible |
Anterior Maxilla |
-1.93333- |
1.15326 |
.132 |
-4.5927- |
.7261 |
Posterior Maxilla |
-1.00000- |
1.15326 |
.411 |
-3.6594- |
1.6594 |
Anterior Mandible |
-3.00000-* |
1.15326 |
.032 |
-5.6594- |
-.3406- |
*The mean difference is significant at the 0.05 level. |
Table 7. Correlation test between diameter and length of dental implant
|
Diameter |
Length |
Diameter |
Pearson Correlation |
1 |
-.222- |
Sig. (2-tailed) |
- |
.487 |
N |
12 |
12 |
Length |
Pearson Correlation |
-.222- |
1 |
Sig. (2-tailed) |
.487 |
- |
N |
12 |
12 |
Table 8. Descriptive statistical table
Success% |
|
N |
Mean |
Std. Deviation |
Std. Error |
95% Confidence Interval for Mean |
Minimum |
Maximum |
Lower Bound |
Upper Bound |
Anterior Maxilla |
3 |
94.6667 |
.57735 |
.33333 |
93.2324 |
96.1009 |
94.00 |
95.00 |
Posterior Maxilla |
3 |
85.0000 |
5.00000 |
2.88675 |
72.5793 |
97.4207 |
80.00 |
90.00 |
Anterior Mandible |
3 |
92.6667 |
2.30940 |
1.33333 |
86.9298 |
98.4035 |
90.00 |
94.00 |
Posterior Mandible |
3 |
55.3333 |
.28868 |
.16667 |
54.6162 |
56.0504 |
55.00 |
55.50 |
Total |
12 |
81.9167 |
16.63626 |
4.80247 |
71.3465 |
92.4868 |
55.00 |
95.00 |
Table 9. ANOVA test
Success% |
|
Sum of Squares |
df |
Mean Square |
F |
Sig. |
Between Groups |
2982.917 |
3 |
994.306 |
129.341 |
.000 |
Within Groups |
61.500 |
8 |
7.688 |
- |
- |
Total |
3044.417 |
11 |
- |
- |
- |
Table 10. Multiple comparison table
Dependent Variable: Success% |
LSD |
(I) Position of dental implant |
(J) Position of dental implant |
Mean Difference (I-J) |
Std. Error |
Sig. |
95% Confidence Interval |
Lower Bound |
Upper Bound |
Anterior Maxilla |
Posterior Maxilla |
9.66667* |
2.26385 |
.003 |
4.4462 |
14.8871 |
Anterior Mandible |
2.00000 |
2.26385 |
.403 |
-3.2204- |
7.2204 |
Posterior Mandible |
39.33333* |
2.26385 |
.000 |
34.1129 |
44.5538 |
Posterior Maxilla |
Anterior Maxilla |
-9.66667-* |
2.26385 |
.003 |
-14.8871- |
-4.4462- |
Anterior Mandible |
-7.66667-* |
2.26385 |
.010 |
-12.8871- |
-2.4462- |
Posterior Mandible |
29.66667* |
2.26385 |
.000 |
24.4462 |
34.8871 |
Anterior Mandible |
Anterior Maxilla |
-2.00000- |
2.26385 |
.403 |
-7.2204- |
3.2204 |
Posterior Maxilla |
7.66667* |
2.26385 |
.010 |
2.4462 |
12.8871 |
Posterior Mandible |
37.33333* |
2.26385 |
.000 |
32.1129 |
42.5538 |
Posterior Mandible |
Anterior Maxilla |
-39.33333-* |
2.26385 |
.000 |
-44.5538- |
-34.1129- |
Posterior Maxilla |
-29.66667-* |
2.26385 |
.000 |
-34.8871- |
-24.4462- |
Anterior Mandible |
-37.33333-* |
2.26385 |
.000 |
-42.5538- |
-32.1129- |
*The mean difference is significant at the 0.05 level. |
Table 11. Descriptive statistical table
Failure% |
|
N |
Mean |
Std. Deviation |
Std. Error |
95% Confidence Interval for Mean |
Minimum |
Maximum |
Lower Bound |
Upper Bound |
Anterior Maxilla |
3 |
2.0000 |
1.00000 |
.57735 |
-.4841- |
4.4841 |
1.00 |
3.00 |
Posterior Maxilla |
3 |
5.8667 |
.80829 |
.46667 |
3.8588 |
7.8746 |
5.00 |
6.60 |
Anterior Mandible |
3 |
4.5000 |
.70000 |
.40415 |
2.7611 |
6.2389 |
3.70 |
5.00 |
Posterior Mandible |
3 |
12.3333 |
.57735 |
.33333 |
10.8991 |
13.7676 |
12.00 |
13.00 |
Total |
12 |
6.1750 |
4.04208 |
1.16685 |
3.6068 |
8.7432 |
1.00 |
13.00 |
Table 12. ANOVA test
Failure% |
|
Sum of Squares |
df |
Mean Square |
F |
Sig. |
Between Groups |
174.769 |
3 |
58.256 |
94.088 |
.000 |
Within Groups |
4.953 |
8 |
.619 |
|
|
Total |
179.723 |
11 |
|
|
|
Table 13. Multiple comparison table
Dependent Variable: Failure% |
LSD |
(I) Position of dental implant |
(J) Position of dental implant |
Mean Difference (I-J) |
Std. Error |
Sig. |
95% Confidence Interval |
Lower Bound |
Upper Bound |
Anterior Maxilla |
Posterior Maxilla |
-3.86667-* |
.64248 |
.000 |
-5.3482- |
-2.3851- |
Anterior Mandible |
-2.50000-* |
.64248 |
.005 |
-3.9816- |
-1.0184- |
Posterior Mandible |
-10.33333-* |
.64248 |
.000 |
-11.8149- |
-8.8518- |
Posterior Maxilla |
Anterior Maxilla |
3.86667* |
.64248 |
.000 |
2.3851 |
5.3482 |
Anterior Mandible |
1.36667 |
.64248 |
.066 |
-.1149- |
2.8482 |
Posterior Mandible |
-6.46667-* |
.64248 |
.000 |
-7.9482- |
-4.9851- |
Anterior Mandible |
Anterior Maxilla |
2.50000* |
.64248 |
.005 |
1.0184 |
3.9816 |
Posterior Maxilla |
-1.36667- |
.64248 |
.066 |
-2.8482- |
.1149 |
Posterior Mandible |
-7.83333-* |
.64248 |
.000 |
-9.3149- |
-6.3518- |
Posterior Mandible |
Anterior Maxilla |
10.33333* |
.64248 |
.000 |
8.8518 |
11.8149 |
Posterior Maxilla |
6.46667* |
.64248 |
.000 |
4.9851 |
7.9482 |
Anterior Mandible |
7.83333* |
.64248 |
.000 |
6.3518 |
9.3149 |
*The mean difference is significant at the 0.05 level. |
Table 14. Descriptive statistical table
Marginal bone loss |
|
N |
Mean |
Std. Deviation |
Std. Error |
95% Confidence Interval for Mean |
Minimum |
Maximum |
Lower Bound |
Upper Bound |
Anterior Maxilla |
3 |
.1233 |
.00577 |
.00333 |
.1090 |
.1377 |
.12 |
.13 |
Posterior Maxilla |
3 |
.4600 |
.05292 |
.03055 |
.3286 |
.5914 |
.40 |
.50 |
Anterior Mandible |
3 |
.3200 |
.01000 |
.00577 |
.2952 |
.3448 |
.31 |
.33 |
Posterior Mandible |
3 |
3.6000 |
.10000 |
.05774 |
3.3516 |
3.8484 |
3.50 |
3.70 |
Total |
12 |
1.1258 |
1.49798 |
.43243 |
.1741 |
2.0776 |
.12 |
3.70 |
Table 15. ANOVA test
Marginal bone loss |
|
Sum of Squares |
df |
Mean Square |
F |
Sig. |
Between Groups |
24.658 |
3 |
8.219 |
2542.023 |
.000 |
Within Groups |
.026 |
8 |
.003 |
- |
- |
Total |
24.683 |
11 |
- |
- |
- |
Table 16. Multiple comparison table
Dependent Variable: Marginal bone loss |
LSD |
(I) Position of dental implant |
(J) Position of dental implant |
Mean Difference (I-J) |
Std. Error |
Sig. |
95% Confidence Interval |
Lower Bound |
Upper Bound |
Anterior Maxilla |
Posterior Maxilla |
-.33667-* |
.04643 |
.000 |
-.4437- |
-.2296- |
Anterior Mandible |
-.19667-* |
.04643 |
.003 |
-.3037- |
-.0896- |
Posterior Mandible |
-3.47667-* |
.04643 |
.000 |
-3.5837- |
-3.3696- |
Posterior Maxilla |
Anterior Maxilla |
.33667* |
.04643 |
.000 |
.2296 |
.4437 |
Anterior Mandible |
.14000* |
.04643 |
.017 |
.0329 |
.2471 |
Posterior Mandible |
-3.14000-* |
.04643 |
.000 |
-3.2471- |
-3.0329- |
Anterior Mandible |
Anterior Maxilla |
.19667* |
.04643 |
.003 |
.0896 |
.3037 |
Posterior Maxilla |
-.14000-* |
.04643 |
.017 |
-.2471- |
-.0329- |
Posterior Mandible |
-3.28000-* |
.04643 |
.000 |
-3.3871- |
-3.1729- |
Posterior Mandible |
Anterior Maxilla |
3.47667* |
.04643 |
.000 |
3.3696 |
3.5837 |
Posterior Maxilla |
3.14000* |
.04643 |
.000 |
3.0329 |
3.2471 |
Anterior Mandible |
3.28000* |
.04643 |
.000 |
3.1729 |
3.3871 |
*The mean difference is significant at the 0.05 level. |
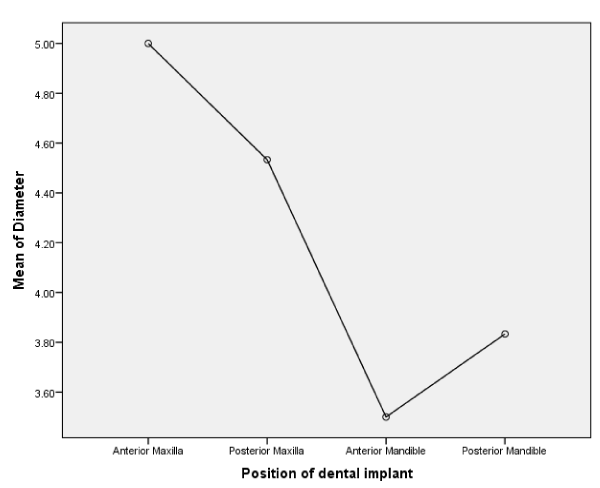
Figure 1. Relation between mean diameter of dental implant and position
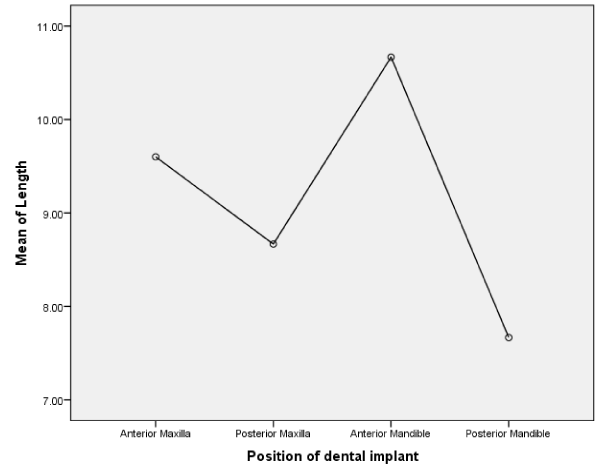
Figure 2. Relation between mean length of dental implant and position
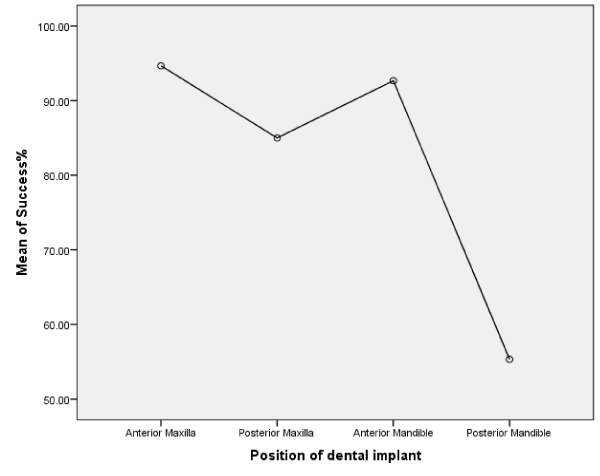
Figure 3. Relation between success rate and position of dental implant
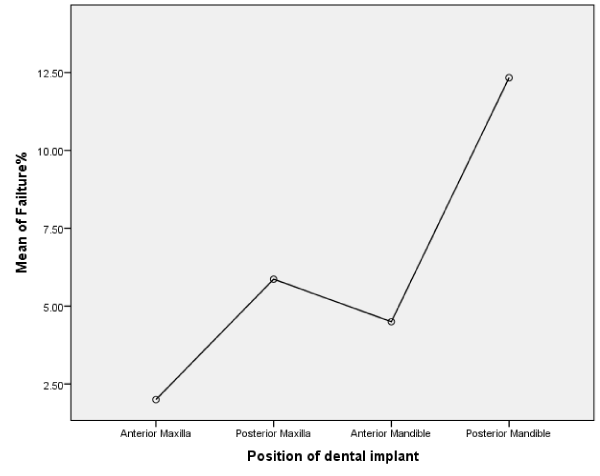
Figure 4. Relation between failure rate and position of dental implant
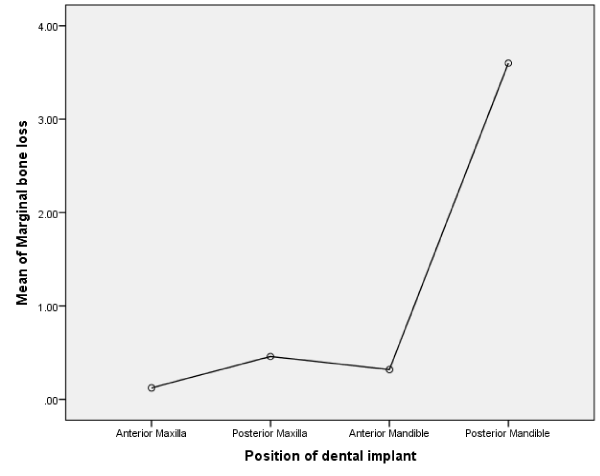
Figure 5. Relation between marginal bone loss and position of dental implant
The statistical analysis in Tables 14 and 15 and Figure 4 indicate that the highest mean value of the mean mesial and distal bone loss was in Posterior Mandibular area was (3.6000±.10000) in comparison with mean mesial and distal bone loss in Anterior Mandibular area (0.3200±.01000). The mean difference is significant at 0.05 level (P<0.05).
Our study was done to estimate the success rate of dental implant using different diameter and length of dental implant placed in different positions. The statistical results of study in Tables 8 and 9 and Figure 2 show survival rate of dental implant in different treated position. The high survival rate of dental implant was in maxillary incisor area (95%) due to use standard size with wide and long dental implant and lower stress area [13,14]. This is also because the large size of dental implant increases the surface area of contact between bone and dental implant and minimize the stress distributed to this area and increase the success of osteointegration. While the lowest survival rate of dental implant was in mandibular molar area (55%) in comparison with other site this due to use of wide size and short for reason related to anatomy and high stress. Statistical result in Tables 1 and 2 and Figure 1 indicate that the higher mean value of diameter of dental implant was in maxillary anterior area (5.000±0.0000). While the lowest mean value was (3.5000±0.000) in anterior mandible. The mean difference is significant at 0.05 level (P<0.05). While the statistical results in Tables 4 and 5 and Figure 2 indicate that the highest mean value of length of dental implant was (10.6667±0.76376) in Anterior Mandible. While the lowest mean value of length of dental implant was in posterior mandible was (7.6667±0.57735) (P>0.05) non-significant at 0.05 level. Tables 14 and 15 Figure 5 indicate that the highest mean value of mesial and distal marginal loss was (3.6000±0.10000) in mandibular molar area in comparison with other sites (0.1233±0.00577). The mean difference is significant at 0.05 level (P<0.05) [15,16]. Use of short and large diameter dental implant is instead of bone grafting to avoid the danger of damage to the inferior alveolar nerve and canal and effect of high occlusal load over scares bone and hinder successful ostointegration [17,18]. The difficulty in placing such size is also other factor to be considered in the failure rate of dental implant in these area [19,20]. This is consistent to study conducted Renoaurd who indicate that the failure rate of dental implant increases with short and large diameter, it led to narrow thickness of surrounding bone and also poor skill of dentist [21]. The failure rate of dental implant is increase also due to other factor such as smoking, systemic disease, periodontal condition, surface texture, dental appliance and distribution dental implant through jaw [22]. Studies by Misch indicate that placement of short dental implant<10 mm in posterior molar area associated with high failure rate about 85% after placement of dental appliance [23,24]. But its use has added advantage it minimizes the time required for grating procedures, cost and avoid the postoperative surgical complications and morbidity [25]. Short dental implant in (molar) has complications related to initial stability due less surface contact with bone and interm of stress distribution which hinder successful ossteointgration [26].
Variation in Dental implant geometry provided by many companies to overcome the limitation in use of dental implant in certain area. Large size dental implant increases the area of contact with bone and better distribution of occlusal load which required for osteointergation. This make considerable increases in overall success rate.
Great thank and respect to my family who help me to finish my study.
- Raikar S, Talukdar P, Kumari S, Kumar S, Mary V, et al. (2017) Survival rate of dental implant. J In Sco Prev Community Den 12: 65-87.
- Tonetti MS (2000) Schmid pathology of failed dental implant. Periodontol 15: 77-99.
- Han DH, Kim SJ, Lee KW (2010) Local factors affecting the success of dental implant. J Academic Prosthodont 11: 55-87.
- Esponsito M, Grusovin MG, Coulthard P, Thomsen P (2005) Retrospective Study on ossteointergated dental implant. Oral Maxill Facia Implant 12: 98-112.
- Misch CE (2005) Size of dental implant. Dent Today 14: 100-123.
- Renourad F, Nisand D (2006) The effect of diameter in the success rate of dental implant. Clin Oral Implant Res 10: 54-76.
- Arsalanloo Z, Telchi R, Osgouie KG (2014) Choice of suitable implant size. J Biosci Biochem Bioinf 13: 120-145.
- Topkaya T, Solmaz MY, Eltas A (2015) The effect of geometry of dental implant on the load distribution. Cumhuriyet Dent J 11: 77-90.
- Borie E, Orsi IA, de Araujo CP (2015) The effect of dental implant diameter and length on the bone. Act Odonto Scand 13: 88-99.
- Eazhil R, Vadivel S, Gunaseelan M, Vijay Kannan G (2016) Effect of diameter and length on the ossteointegration. Sco Prev Community Dent 23: 22-56.
- Petrie CS, Willium JL (2015) The effect of various implant designs on the stress over the bone. Clin Oral Implnat Res 16: 99-108.
- Antiua E, Tapia R, Luzuriaga F, Orive G (2010) The effect of dental implant dimension on the distributed stress. Int J Period Res 22: 88-100.
- Yesiladl R, Karabudak F, Bayindir F, Sagsoz NP (2015) The effect of diameter and length on the distribution of stress around dental implant. Open Access Library J 12: 78-98.
- Thakur MD, Quazi TZ, Dhatrak PN (2016) The effect of dental implant length and shape on the stress distributed at bone dental implant interface. Engg Sci Res Technol 15: 123-156.
- Terzioglu H, Kursunoglu S (2014) The effect of diameter and length of dental implant on marginal bone loss. Clin Oral Implant Res 13: 109-120.
- Li T, Hu K, Cheng L, Ding Y, Ding Y (2011) Choice of suitable dental implant size in mandibular molar area. Applied Mathematical Modelling 14: 99-118.
- Ting M, Palermo M, Donatelli D, Gaughan JP (2015) The effect of implant surface characteristics on survival rate. Int J Implant Dent 8: 77-110.
- Malo P, de Araujo Nobre M (2011) Use of wide diameter dental implant in mandibular molar area. Clin Dental Implant Res 14: 68-99.
- Olate S, Lyrio MC, de Moraes M, Moreira RW (2010) The effect of dental implant geometry on the success rate of dental implant. J Oral Maxillofac Surg 11: 76-87.
- Bataineh AB, Al -Dakes AM (2017) The effect of length on the dental implant stability. J Clin Exp Dent 9: 47-99.
- Termeie D, Klokkevold PR, Caputo AA (2015) The effect of diameter of dental implant on the distribution of occlual load. J Oral Implant 14: 55-78.
- Misch CE, Perel ML, Wang HL, Galindo–Moreno P (2008) The failure rate of dental implant. Impl Den 33: 54-87.
- Misch CE, Steignga J, Barboza E, Cianciola LJ (2009) Use of short dental implant in molar area. J Periodontol 14: 100-120.
- Garnt BT, Pancko FX, Kraut RA (2006) Results of Placing short dental implant in mandibular molar region. J Oral Maxillofaca Surg 12: 65-88.
- Bozakaya D, Muftu A (2014) Assessment of load transmitted over six various dental implant. J Proesthetic Den 17: 45-87.
- Ting M, Plaermo M, Dontelli DP, Gaughan JP (2015) The effect of implant surface texture on the survival rate. Int J Implant Dent 5: 66-78.


