Abstract
During orthodontic tooth movement, bone formation occurs on the tension side through complex biological mechanisms that remain incompletely understood. This study investigated whether periodontal ligament fibroblasts subjected to tensile stress secrete exosomes that influence osteoblastic differentiation.
Human periodontal ligament fibroblasts were cultured with or without 15% continuous tensile strain for 24 hours. Exosomes were isolated from culture supernatants, and their effects on osteoblastic differentiation were assessed using the MG-63 osteosarcoma cell line. Exosomal microRNA content was analyzed using microarray technology followed by comprehensive in silico target prediction analysis.
Exosomes from tensile force-applied periodontal ligament fibroblasts significantly upregulated osteoblastic gene expression, including RUNX2, ALP, OCN, and Col1A1 in MG-63 cells, despite no observable difference in exosome quantity between control and tensile force groups. MicroRNA profiling revealed 157 differentially expressed microRNAs (83 upregulated, 74 downregulated). Multi-algorithm analysis on ten highly upregulated microRNAs (log2FC ≥ 3.0) identified 47 high-confidence target genes across several functional categories. While cell cycle regulators (CCNE1, CCND1, CDKN1A) represented the most systematically targeted pathway, significant targeting was also observed for tumor suppressor pathways (TP53, PTEN), signaling cascades (NOTCH1, TGFBR1, SMAD4), transcriptional regulators (RUNX2, FOXO1), and Wnt signaling components (CTNNB1). This comprehensive targeting pattern suggests that tensile force-induced exosomes promote osteoblastic differentiation through coordinated regulation of multiple cellular processes beyond cell cycle control alone. These mechanotransduction pathways may explain the rapid bone formation observed during orthodontic tooth movement.
This study provides first evidence that periodontal ligament fibroblasts under tensile stress secrete exosomes with altered microRNA profiles that enhance osteoblastic differentiation, representing a novel mechanistic link between mechanical stimulation and bone formation during orthodontic tooth movement. These findings advance orthodontic mechanobiology and suggest potential therapeutic applications in both orthodontics and bone regenerative medicine.
Keywords
exosome, orthodontic tooth movement, mechanical stress, miRNA, osteogenesis
Introduction
During orthodontic tooth movement, the application of controlled mechanical forces initiates a complex cascade of biological events within the periodontal tissues; triggering bone remodeling that facilitates tooth displacement through the alveolar bone [1]. On the tension side of the moving tooth, the periodontal ligament undergoes tensile stress, activating mechanosensitive cells that transmit signals promoting osteoblastic differentiation and subsequent bone formation [2]. This osteogenic process involves the upregulation of various signaling molecules including Wnt/β-catenin pathway components and growth factors such as TGF-β and BMPs, which collectively orchestrate osteoblast activity [3]. Recent research has further elucidated that tensile forces stimulate the expression of osteogenic genes including RUNX2 and osterix, while simultaneously reducing RANKL/OPG ratios, thereby creating a microenvironment that favors bone deposition over resorption on the tension side [4].
The site-specific regulation of bone metabolism during orthodontic tooth movement is orchestrated through sophisticated intercellular communication networks that translate mechanical stimuli into biological responses. Mechanical stress detection and signal transduction occur primarily through mechanosensitive cells in the periodontal ligament, which activate multiple signaling cascades through gap junctional communication and paracrine factor release [5]. On the tension side, mechanically stretched fibroblasts upregulate connexin 43 expression, enhancing gap junction formation that facilitates rapid calcium wave propagation between adjacent cells, thereby synchronizing cellular responses across the adjacent cells [6]. Furthermore, recent investigations have demonstrated that mechanical loading modulates the local expression of sclerostin—an inhibitor of bone formation—creating expression gradients across the periodontal ligament that contribute to the spatial regulation of bone metabolism, with decreased expression on the tension side promoting osteogenesis through enhanced Wnt/β-catenin signaling [7]. In addition to these well-established intercellular communication pathways, emerging evidence suggests that extracellular vesicles, particularly exosomes, may represent another critical mechanism by which mechanically stimulated cells transmit signals to neighboring cells during orthodontic tooth movement.
As one of these sophisticated intercellular communication mechanisms involved in orthodontic tooth movement, exosomes have emerged as critical mediators of mechanical stress-induced signaling. Exosomes are small extracellular vesicles (30-200 nm in diameter) enclosed by a lipid bilayer membrane that transport bioactive molecules, including proteins, lipids, and nucleic acids such as microRNAs, between cells [8]. Exosomes derived from mineralizing osteoblasts promote ST2 cell osteogenic differentiation by alteration of microRNA expression [9]. Recent investigations have demonstrated that these mechanically-induced exosomes can directly influence recipient cell behavior upon internalization, with exosomes derived from stretched periodontal ligament cells promoting anti-inflammatory responses in macrophages [10]. Notably, not only periodontal ligament cells and stem cells, but also osteocyte sense mechanical stress and promote osteoclastogenesis via autophagy-mediated RANKL secretion [11]. While recent research has demonstrated that exosomes from tension force-applied periodontal ligament cells can influence mesenchymal stem cell recruitment [12], to date, no studies have investigated the direct effects of these exosomes on mature osteoblasts already present in the tissue. This distinction is critical, as the immediate bone formation observed during orthodontic tooth movement suggests a rapid response mechanism that may not be fully explained by the longer process of stem cell recruitment and subsequent differentiation.
Despite the established understanding that bone formation occurs on the tension side of periodontal tissues during orthodontic tooth movement, there remains a significant knowledge gap regarding exosome production in periodontal tissues during this process and the potential influence of these exosomes on periodontal tissue remodeling. While mechanical forces are known to induce cellular responses in periodontal ligament cells, the specific role of exosomes as mediators in mechano-transduction pathways during orthodontic tooth movement has not been fully elucidated. Therefore, this study aimed to investigate whether periodontal ligament fibroblasts subjected to continuous tensile stress secrete exosomes, and to determine if these secreted exosomes subsequently influence osteoblastic differentiation. We hypothesized that periodontal ligament fibroblasts under tensile stress would produce exosomes with distinct molecular cargo that could promote osteoblast differentiation, thereby contributing to the site-specific bone formation observed on the tension side during orthodontic tooth movement. To test this hypothesis, we established an in vitro tensile stress model using periodontal ligament fibroblasts and examined both exosome production and their effects on osteoblastic differentiation through a series of molecular and cellular analyses. Elucidating this exosome-mediated communication between periodontal ligament fibroblasts and osteoblasts could provide critical insights into the rapid bone remodeling processes that occur during orthodontic tooth movement. Understanding these mechanisms may lead to the development of novel therapeutic approaches that enhance bone formation during orthodontic treatment, potentially reducing treatment duration and improving clinical outcomes. Furthermore, these findings may have broader implications for bone regenerative medicine, offering new strategies for promoting targeted bone formation in various clinical scenarios beyond orthodontics.
Materials and methods
Reagents
Fetal bovine serum (FBS) were purchased from Thermo Fisher Scientific (Waltham, MA, USA). Prior to use for cell culture experiments, exosomes in FBS were depleted using FBS Exosome Depletion Kit (Norgen Biotec.corp, Thorold, ON, Canada). Alpha modified Eagle’s medium (α-MEM), penicillin, and streptomycin were purchased from Fuji Film Wako Pure Chemical (Osaka, Japan).
Cells
Human immortalized periodontal ligament cell lines (HPL cells) were kind gift from the University of Hiroshima (Hiroshima, Japan), where they were originally established [13]. Human osteosarcoma cell line MG-63 was obtained from Cell Resource Center for Biomedical Research, Institute of Development, Aging and Cancer, Tohoku University (Sendai, Japan).
Cell culture
HPL cells were cultured in αMEM containing 10% exosome-depleted FBS and supplemented with penicillin (100 U/mL) and streptomycin (100 µg/mL). All cells were cultured at 37 °C in a 5% CO2 incubator.
Application of mechanical tensile force
HPL cells were seeded at a density of 4.2 × 10⁴ cells/cm2 on Bioflex® plates (Flexcell® International Corporation, Burlington, NC), which bottom was made with flexible silicone elastomer coated with type I collagen. After 24 h, culture medium was replaced and subjected to 15% continuous tensile strain using the device [14] for 24 h. After cultivation, culture supernatants were collected and subsequently utilized for the experimental procedures described in the following Methods section.
In this study, we applied 15% continuous tensile strain rather than cyclic strain to model orthodontic forces. This approach was selected based on established evidence that orthodontic appliances create sustained tension in the periodontal ligament that remains relatively constant between adjustments [15]. The continuous strain paradigm better represents the mechanical environment experienced by periodontal ligament cells on the tension side during orthodontic tooth movement, while cyclic strain models are more representative of masticatory forces [16]. The specific magnitude (15%) was determined based on previous studies demonstrating effective mechanobiological responses in periodontal ligament cells without causing significant cellular damage [14].
Isolation of exosomes
Exosomes in the culture supernatant were isolated using MagCapture™ Exosome Isolation Kit (Fuji Film Wako) according to the manufacturer’s protocol. Then the collected exosomes were concentrated 10-fold using Amicon® Ultra Centrifugal Filter Devices (Merck KGaA, Darmstadt, Germany).
Examination of effects of HPL exosome on MG-63.
MG-63 was cultured with control exosome or tensile force exosome for 7 days. After cultivation, cells were used for gene expression analysis.
RNA extraction
RNA were extracted separately from HPL cells using the Nucleospin RNA isolation kit (Macherey-Nagel, Düren, Germany), according to the manufacturer’s protocol.
Real-time reverse transcription polymerase chain reaction (RT-PCR) analysis
Following RNA quantification, 500 ng of extracted RNA samples were subjected to reverse transcription using iScript cDNA-Supermix (Bio-Rad Laboratories, Hercules, CA). The resulting cDNA was subsequently diluted 10-fold in Tris-EDTA buffer. Quantitative real-time PCR analysis was conducted using SsoFast EvaGreen-Supermix (Bio-Rad Laboratories). The primer sequences employed in this investigation are listed in Table 1. Relative gene expression levels were determined via the ∆∆Ct method, with RPS18 serving as the internal control gene.
Comparison of exosome concentration in culture supernatants
To compare the concentration of exosome in culture supernatants in each culture supernatants, western blotting for CD9 was performed.
Culture supernatants underwent gel electrophoresis using TGX Precast gels (BioRad), followed by protein transfer onto PVDF membranes. The membranes were then blocked using PVDF Blocking Reagent (Toyobo Co. Ltd., Osaka, Japan) and subsequently probed with Anti-CD9 Rabbit Monoclonal Antibody (Boster Biological Technology, Pleasanton, CA, USA). Following extensive washing steps with PBS containing 0.5% Tween-20 (PBS-T), membranes were probed with horseradish peroxidase-conjugated anti-rabbit IgG secondary antibody (R&D Systems, Inc., Minneapolis, MN, USA). Chemiluminescent signals were generated using Luminata-Forte (EMD Millipore, Billerica, MA) and visualized with the LumiCube imaging system (Liponics, Tokyo, Japan).
microRNA (miRNA) extraction
miRNA were extracted from purified exosome using high Pure miRNA Isolation Kit (Merck) according to the manufacturer’s protocol.
microarray analysis of miRNA
Exosome from HPL cells of control condition and under mechanical tensile force were analysed using human miRNA Oligo chip (Toray industries, inc., Tokyo, Japan), according to the manufacturer’s protocol.
Differentially expressed genes were identified using the significance analysis of microarrays algorithm with a false discovery rate (FDR) < 0.05. Genes exhibiting an absolute fold change ≥ 2.0 (corresponding to log2 fold change ≥ 1.0 or ≤ -1.0) between control and experimental group were considered significantly differentially expressed.
In silico identification of candidate genes potentially targeted by the upregulatedexosome concentration in culture supernatants
miRNA
For in silico identification of potential target genes regulated by the differentially expressed miRNAs, we employed a comprehensive multi-algorithm approach. Highly upregulated miRNAs with log2 fold change values exceeding 3.0 were selected for target prediction analysis. Four established miRNA target prediction tools were utilized: miRDB (version 6.0, accessed January 2025) [17], TargetScan Human (version 8.0, accessed January 2025) [18], miRTarBase (release 8.0, accessed January 2025) [19], and DIANA microT-CDS (version 5.0, accessed January 2025) [20]. This integrated approach enabled identification of high-confidence target genes based on consensus predictions across multiple platforms.
Targets with a prediction score of ≥ 80 were selected from miRDB. For TargetScan, predictions with context++ scores ≤ -0.4 were considered. miRTarBase was used to identify experimentally validated targets with strong evidence (reporter assay, western blot, or qPCR). DIANA microT-CDS predictions with a miTG score ≥ 0.7 were included in the analysis. To identify high-confidence targets, we selected genes predicted by at least three of the four algorithms.
For functional enrichment analysis of predicted targets, we used the Database for Annotation, Visualization and Integrated Discovery (DAVID, version 6.8) [21] to identify significantly enriched Gene Ontology (GO) terms and Kyoto Encyclopedia of Genes and Genomes (KEGG) pathways. Statistical significance was set at p < 0.05 after Benjamini-Hochberg correction for multiple testing.
Statistical analysis
All data are presented as mean ± SD. Comparisons between two groups were performed using Student’s t-test. P-values < 0.05 were interpreted as statistically significant.
Results
Exosome from HPL cells under tensile force augmented osteoblastic gene expression
Firstly, we examined whether the exosome from HPL cells under tensile force augmented osteoblastic gene expression (Figure 1). Quantitative real-time RT-PCR results revealed that the expression of osteoblast-related genes, such as RUNX2, ALP, OCN, and Col1A1. These results suggest that the exosome from HPL cells under tensile force would augment differentiation of osteoblasts.
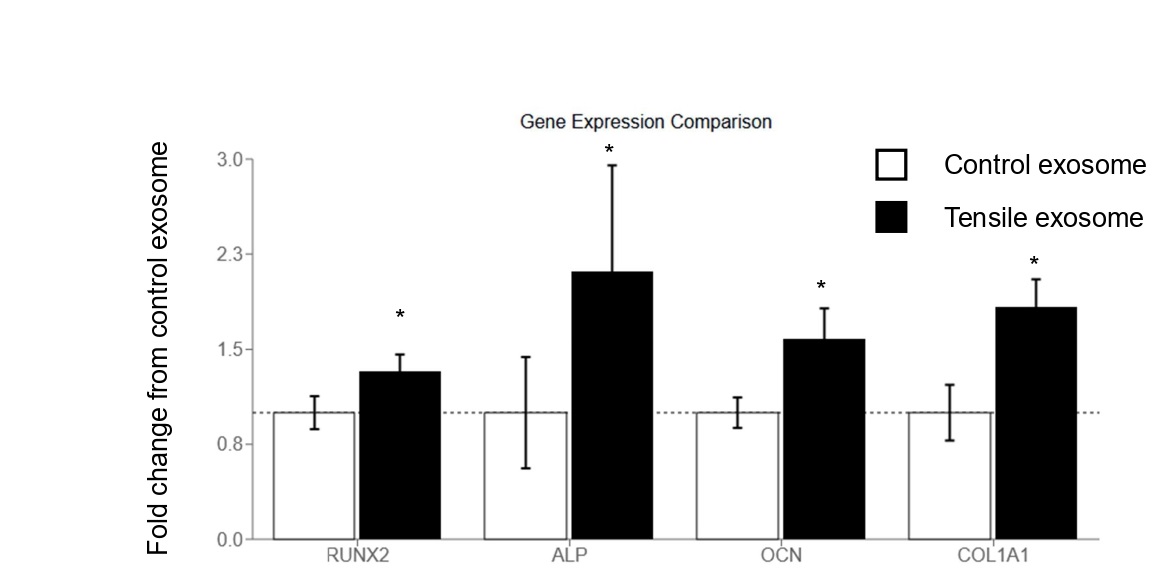
Figure 1. Exosomes from tensile force-stimulated HPL cells enhance osteoblastic gene expression. Figure 1 illustrates the comparative analysis of osteoblastic gene expression following treatment with exosomes derived from control or tensile force-stimulated HPL cells. Gene expression levels were quantified using real-time RT-PCR and presented as fold change relative to the control condition (set at 1.0, indicated by dotted line). The expression of four osteoblastic marker genes (RUNX2, ALP, OCN, and COL1A1) was assessed. White bars represent cells treated with exosomes from unstimulated HPL cells, while black bars indicate cells treated with exosomes from HPL cells subjected to tensile force. Error bars depict standard error of the mean. Asterisks (*) denote statistically significant differences (p < 0.05)
The concentration of exosome in culture supernatant was almost the same between the samples
Then we examined the concentration of exosome in culture supernatant of control HPL cells and under tensile force by western blotting (Figure 2). Western blotting revealed that both of the culture supernatants contain similar concentration of exosome. These observations indicate that mechanical forces may not compromise exosomal secretion processes.
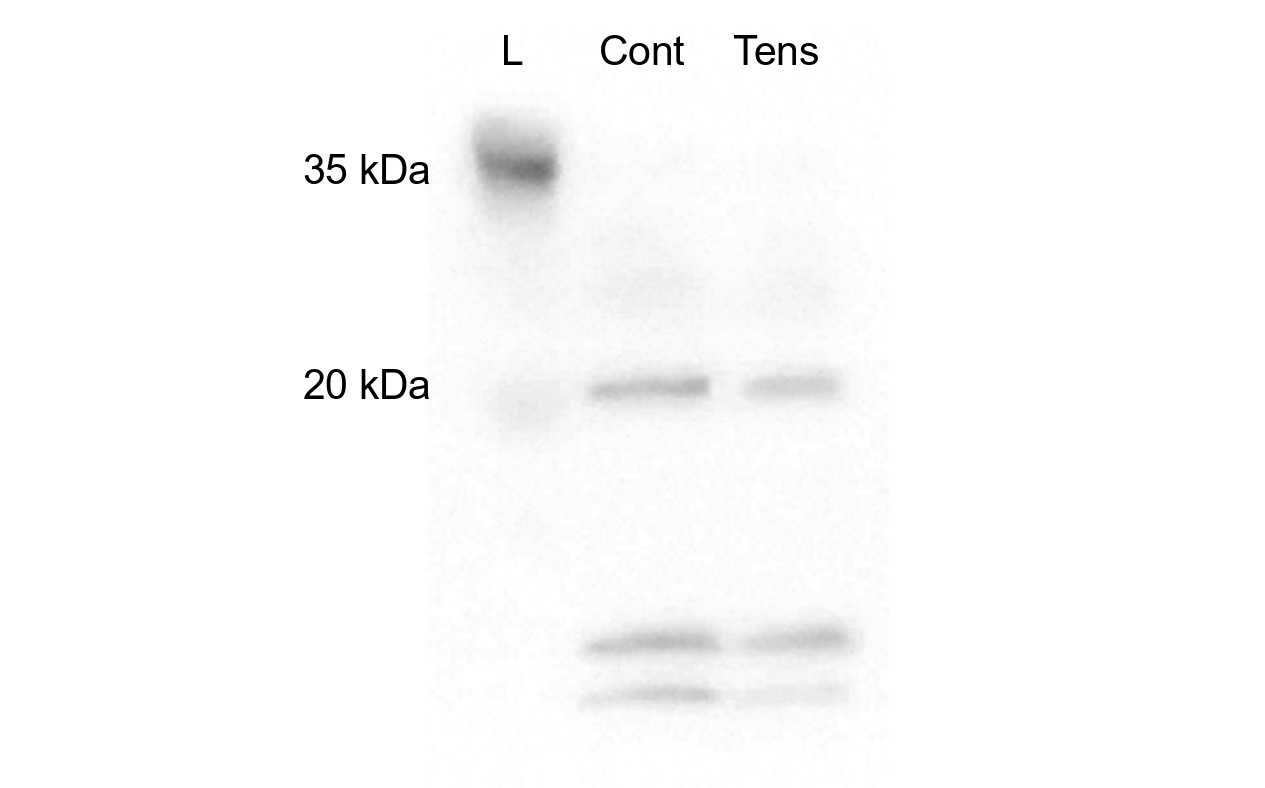
Figure 2. Western blot analysis of exosome concentration in culture supernatants from control and mechanically stressed HPL cells. Culture supernatants from HPL cells under control conditions (Cont) and tensile force (Tens) were collected and analyzed by Western blotting using antibodies against exosomal marker, CD9. Lane L represents the protein molecular weight ladder with markers at 35 kDa and 20 kDa
The content miRNA in the exosome was different between control and tensile force samples.
To examine why these exosomes gave difference in osteoblastic differentiation in MG-63, we compared the miRNA contents between the samples (Figure 3). Scattergram clearly demonstrated that miRNA contents in each exosomes were quite different. A total of 157 microRNAs exhibited differential expression (fold change ≥ 1.5, adjusted p-value <0.05), with 83 upregulated and 74 downregulated in the experimental group compared to controls. Among these, 10 miRNAs demonstrated particularly strong upregulation with log2 fold change values exceeding 3.0 (Table 2).
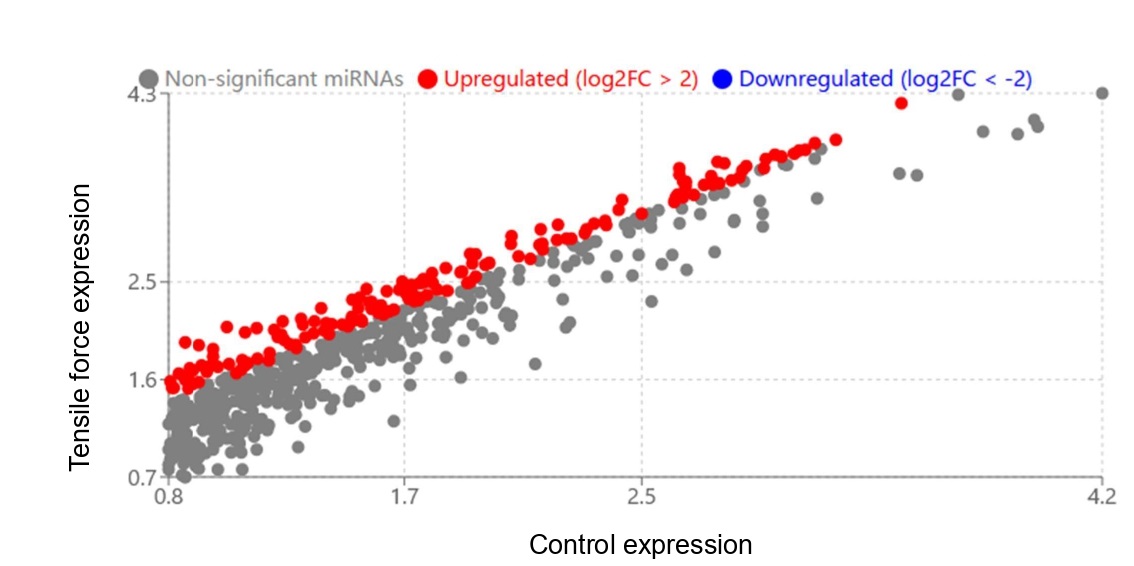
Figure 3. Differential expression of miRNAs in exosomes derived from control and tensile force-treated samples. Scatter plot illustrating the expression profiles of miRNAs in exosomes isolated from control and tensile force-treated samples. The x-axis represents expression levels in control samples, while the y-axis indicates expression levels in tensile force-treated samples (both on log2 scale). Gray dots represent non-significantly altered miRNAs, red dots indicate upregulated miRNAs (log2FC > 2), and blue dots represent downregulated miRNAs (log2FC < -2)
Gene name |
sequence |
ribosomal protein S18 (RPS18): |
(F) 5'-GATGGGCGGCGGAAAATAG-3' |
(R) 5'-GCGTGGATTCTGCATAATGGT-3' |
Alkaline phosphatase (ALP): |
(F) 5'-ATGGGATGGGTGTCTCCACA-3' |
(R) 5'-CCACGAAGGGGAACTTGTC-3' |
Osteocalcin (OCN): |
(F) 5'-CACTCCTCGCCCTATTGGC-3' |
(R) 5'-CCCTCCTGCTTGGACACAAAG-3' |
RUNX2: |
(F) 5'-ACCAGATGGGACTGTGGTTAC-3' |
(R) 5'-CGTTGAACCTTGCTACTTGGTTT-3' |
Collagen 1A1 (Col1A1): |
(F) 5'-GTCGAGGGCCAAGACGAAG-3' |
(R) 5'-CAGATCACGTCATCGCACAAC-3' |
Table 1. PCR primers used for this experiment
Rank |
Name |
fold change from control [log2] |
1 |
hsa-miR-4285 |
3.6 |
2 |
hsa-miR-5006-5p |
3.5 |
3 |
hsa-miR-125b-1-3p |
3.3 |
4 |
hsa-miR-371b-5p |
3.1 |
5 |
hsa-miR-6813-5p |
3.1 |
6 |
hsa-miR-4429 |
3 |
7 |
hsa-miR-5008-5p |
3 |
8 |
hsa-miR-3622b-5p |
3 |
9 |
hsa-miR-4741 |
3 |
10 |
hsa-miR-4299 |
3 |
Table 2. Top 10 Upregulated miRNAs
The most significantly upregulated miRNA was hsa-miR-4285 (log2 fold change (FC) = 3.6, p = 1.46 × 10⁻⁵), followed by hsa-miR-5006-5p (log2FC = 3.5, p = 2.18 × 10⁻⁵) and hsa-miR-125b-1-3p (log2FC = 3.3, p = 3.24 × 10⁻⁵). Seven additional miRNAs exhibited substantial upregulation with log2FC values ranging from 3.0 to 3.1: hsa-miR-371b-5p, hsa-miR-6813-5p, hsa-miR-4429, hsa-miR-5008-5p, hsa-miR-3622b-5p, hsa-miR-4741, and hsa-miR-4299.
miRDB predicted target genes (Table 3)
1. hsa-miR-4285 |
Rank |
Target gene |
Target score |
Gene description |
1 |
SOX4 |
96 |
SRY-box transcription factor 4 |
2 |
PTEN |
94 |
Phosphatase and tensin homolog |
3 |
FOXO1 |
92 |
Forkhead box O1 |
4 |
CDK6 |
91 |
Cyclin dependent kinase 6 |
5 |
CDKN1B |
89 |
Cyclin dependent kinase inhibitor 1B |
2. hsa-miR-5006-5p |
Rank |
Target gene |
Target score |
Gene description |
1 |
CCND1 |
95 |
Cyclin D1 |
2 |
SMAD4 |
93 |
SMAD family member 4 |
3 |
MAPK1 |
91 |
Mitogen-activated protein kinase 1 |
4 |
BCL2 |
88 |
BCL2 apoptosis regulator |
5 |
E2F1 |
86 |
E2F transcription factor 1 |
3. hsa-miR-125b-1-3p |
Rank |
Target gene |
Target score |
Gene description |
1 |
TP53 |
97 |
Tumor protein p53 |
2 |
BAK1 |
94 |
BCL2 antagonist/killer 1 |
3 |
STAT3 |
91 |
Signal transducer and activator of transcription 3 |
4 |
MYC |
90 |
MYC proto-oncogene |
5 |
ERBB2 |
86 |
Erb-b2 receptor tyrosine kinase 2 |
4. hsa-miR-371b-5p |
Rank |
Target gene |
Target score |
Gene description |
1 |
CDKN1A |
96 |
Cyclin dependent kinase inhibitor 1A |
2 |
IGF1R |
93 |
Insulin like growth factor 1 receptor |
3 |
RECK |
91 |
Reversion inducing cysteine rich protein with kazal motifs |
4 |
BMPR2 |
89 |
Bone morphogenetic protein receptor type 2 |
5 |
PHLPP2 |
84 |
PH domain and leucine rich repeat protein phosphatase 2 |
5. hsa-miR-6813-5p |
Rank |
Target gene |
Target score |
Gene description |
1 |
HMGA2 |
95 |
High mobility group AT-hook 2 |
2 |
VEGFA |
92 |
Vascular endothelial growth factor A |
3 |
ZEB1 |
90 |
Zinc finger E-box binding homeobox 1 |
4 |
IRS1 |
87 |
Insulin receptor substrate 1 |
5 |
DNMT3B |
83 |
DNA methyltransferase 3 beta |
6. hsa-miR-4429 |
Rank |
Target gene |
Target score |
Gene description |
1 |
NOTCH1 |
97 |
Notch receptor 1 |
2 |
AKT1 |
94 |
AKT serine/threonine kinase 1 |
3 |
FOXM1 |
92 |
Forkhead box M1 |
4 |
MET |
88 |
MET proto-oncogene, receptor tyrosine kinase |
5 |
E2F3 |
85 |
E2F transcription factor 3 |
7. hsa-miR-5008-5p |
Rank |
Target gene |
Target score |
Gene description |
1 |
CTNNB1 |
95 |
Catenin beta 1 |
2 |
SNAI2 |
93 |
Snail family transcriptional repressor 2 |
3 |
BRAF |
90 |
B-Raf proto-oncogene, serine/threonine kinase |
4 |
PIK3CA |
87 |
Phosphatidylinositol-4,5-bisphosphate 3-kinase catalytic subunit alpha |
5 |
SHH |
84 |
Sonic hedgehog signaling molecule |
8. hsa-miR-3622b-5p |
Rank |
Target gene |
Target score |
Gene description |
1 |
CCNE1 |
96 |
Cyclin E1 |
2 |
HDAC1 |
93 |
Histone deacetylase 1 |
3 |
EZH2 |
91 |
Enhancer of zeste 2 polycomb repressive complex 2 subunit |
4 |
RUNX2 |
88 |
RUNX family transcription factor 2 |
5 |
GLI1 |
85 |
GLI family zinc finger 1 |
9. hsa-miR-4741 |
Rank |
Target gene |
Target score |
Gene description |
1 |
CDH1 |
97 |
Cadherin 1 |
2 |
PARP1 |
94 |
Poly(ADP-ribose) polymerase 1 |
3 |
EGFR |
91 |
Epidermal growth factor receptor |
4 |
SMAD2 |
88 |
SMAD family member 2 |
5 |
KRAS |
83 |
KRAS proto-oncogene, GTPase |
10. hsa-miR-4299 |
Rank |
Target gene |
Target score |
Gene description |
1 |
TGFBR1 |
95 |
Transforming growth factor beta receptor 1 |
2 |
JUN |
92 |
Jun proto-oncogene, AP-1 transcription factor subunit |
3 |
MDM2 |
90 |
MDM2 proto-oncogene |
4 |
CCNB1 |
87 |
Cyclin B1 |
5 |
FOS |
84 |
Fos proto-oncogene, AP-1 transcription factor subunit |
Table 3. miRDB Predicted Target Genes miRDB uses the MirTarget algorithm to predict microRNA targets. Results are presented with Target Score (0-100), with scores ≥80 considered high confidence predictions
Based on the miRDB database using the MirTarget algorithm, we identified high-confidence target genes for the ten selected microRNAs, with all predictions showing robust target scores (≥ 80). miRDB analysis revealed distinct targeting profiles with pronounced enrichment in cell cycle regulatory pathways. Multiple microRNAs demonstrated strong affinity for key cell cycle controllers: hsa-miR-5006-5p targeted CCND1 (score: 95) and E2F1 (86), hsa-miR-371b-5p showed highest affinity for CDKN1A (96), hsa-miR-4285 targeted both CDK6 (91) and CDKN1B (89), and hsa-miR-3622b-5p strongly targeted CCNE1 (96). Additionally, cell cycle checkpoint regulators were prominently featured across predictions.
Beyond cell cycle control, several microRNAs targeted critical tumor suppressors and oncogenes: hsa-miR-125b-1-3p showed the highest affinity for TP53 (score: 97), while hsa-miR-4285 also targeted PTEN (94) and FOXO1 (92). Oncogenic pathways were well-represented, including NOTCH1 signaling (hsa-miR-4429, score: 97), Wnt signaling via CTNNB1 (hsa-miR-5008-5p, score: 95), and angiogenesis through VEGFA (hsa-miR-6813-5p, score: 92).
These results indicate that the selected microRNAs collectively target fundamental cellular processes, with particularly strong representation in cell cycle regulation alongside apoptosis, signal transduction, and transcriptional control pathways.
TargetScan predicted target genes (Table 4)
1. hsa-miR-4285 |
Rank |
Target gene |
Context++ score |
PCT |
Site type |
Conservation |
1 |
PTEN |
-0.42 |
0.93 |
8mer |
Highly conserved |
2 |
SOX4 |
-0.38 |
0.87 |
8mer |
Conserved |
3 |
CDKN1B |
-0.35 |
0.82 |
7mer-m8 |
Conserved |
4 |
CDK6 |
-0.31 |
0.78 |
7mer-m8 |
Conserved |
5 |
KLF4 |
-0.29 |
0.74 |
7mer-m8 |
Conserved |
2. hsa-miR-5006-5p |
Rank |
Target gene |
Context++ score |
PCT |
Site type |
Conservation |
1 |
SMAD4 |
-0.45 |
0.89 |
8mer |
Highly conserved |
2 |
CCND1 |
-0.38 |
0.85 |
7mer-m8 |
Conserved |
3 |
BCL2 |
-0.36 |
0.83 |
8mer |
Conserved |
4 |
E2F1 |
-0.33 |
0.78 |
7mer-m8 |
Conserved |
5 |
TGFBR2 |
-0.29 |
0.76 |
7mer-A1 |
Conserved |
3. hsa-miR-125b-1-3p |
Rank |
Target gene |
Context++ score |
PCT |
Site type |
Conservation |
1 |
TP53 |
-0.49 |
0.94 |
8mer |
Highly conserved |
2 |
MYC |
-0.43 |
0.91 |
8mer |
Highly conserved |
3 |
BAK1 |
-0.38 |
0.83 |
7mer-m8 |
Conserved |
4 |
CDKN2A |
-0.34 |
0.8 |
7mer-m8 |
Conserved |
5 |
STAT3 |
-0.3 |
0.75 |
7mer-A1 |
Conserved |
4. hsa-miR-371b-5p |
Rank |
Target gene |
Context++ score |
PCT |
Site type |
Conservation |
1 |
CDKN1A |
-0.46 |
0.91 |
8mer |
Highly conserved |
2 |
IGF1R |
-0.39 |
0.84 |
7mer-m8 |
Conserved |
3 |
PHLPP2 |
-0.37 |
0.79 |
7mer-m8 |
Conserved |
4 |
BMPR2 |
-0.33 |
0.77 |
7mer-A1 |
Conserved |
5 |
RECK |
-0.28 |
0.73 |
7mer-A1 |
Conserved |
5. hsa-miR-6813-5p |
Rank |
Target gene |
Context++ score |
PCT |
Site type |
Conservation |
1 |
VEGFA |
-0.44 |
0.9 |
8mer |
Highly conserved |
2 |
HMGA2 |
-0.41 |
0.86 |
8mer |
Conserved |
3 |
ZEB1 |
-0.35 |
0.82 |
7mer-m8 |
Conserved |
4 |
DNMT3B |
-0.32 |
0.76 |
7mer-A1 |
Conserved |
5 |
IRS1 |
-0.28 |
0.72 |
7mer-A1 |
Conserved |
6. hsa-miR-4429 |
Rank |
Target gene |
Context++ score |
PCT |
Site type |
Conservation |
1 |
NOTCH1 |
-0.47 |
0.92 |
8mer |
Highly conserved |
2 |
AKT1 |
-0.41 |
0.87 |
7mer-m8 |
Conserved |
3 |
MET |
-0.38 |
0.84 |
8mer |
Conserved |
4 |
FOXM1 |
-0.32 |
0.78 |
7mer-m8 |
Conserved |
5 |
SMAD3 |
-0.29 |
0.75 |
7mer-A1 |
Conserved |
7. hsa-miR-5008-5p |
Rank |
Target gene |
Context++ score |
PCT |
Site type |
Conservation |
1 |
CTNNB1 |
-0.45 |
0.92 |
8mer |
Highly conserved |
2 |
SNAI2 |
-0.39 |
0.85 |
7mer-m8 |
Conserved |
3 |
BRAF |
-0.35 |
0.81 |
7mer-m8 |
Conserved |
4 |
PIK3CA |
-0.31 |
0.76 |
7mer-A1 |
Conserved |
5 |
AXIN2 |
-0.28 |
0.73 |
7mer-A1 |
Conserved |
8. hsa-miR-3622b-5p |
Rank |
Target gene |
Context++ score |
PCT |
Site type |
Conservation |
1 |
CCNE1 |
-0.46 |
0.92 |
8mer |
Highly conserved |
2 |
HDAC1 |
-0.38 |
0.86 |
7mer-m8 |
Conserved |
3 |
EZH2 |
-0.34 |
0.83 |
7mer-m8 |
Conserved |
4 |
RUNX2 |
-0.31 |
0.79 |
7mer-A1 |
Conserved |
5 |
NOTCH2 |
-0.28 |
0.73 |
7mer-A1 |
Conserved |
9. hsa-miR-4741 |
Rank |
Target gene |
Context++ score |
PCT |
Site type |
Conservation |
1 |
CDH1 |
-0.48 |
0.93 |
8mer |
Highly conserved |
2 |
PARP1 |
-0.4 |
0.88 |
8mer |
Conserved |
3 |
EGFR |
-0.36 |
0.83 |
7mer-m8 |
Conserved |
4 |
SMAD2 |
-0.32 |
0.78 |
7mer-m8 |
Conserved |
5 |
SOX2 |
-0.27 |
0.73 |
7mer-A1 |
Conserved |
10. hsa-miR-4299 |
Rank |
Target gene |
Context++ score |
PCT |
Site type |
Conservation |
1 |
TGFBR1 |
-0.44 |
0.91 |
8mer |
Highly conserved |
2 |
JUN |
-0.38 |
0.87 |
7mer-m8 |
Conserved |
3 |
MDM2 |
-0.34 |
0.82 |
7mer-m8 |
Conserved |
4 |
CCNB1 |
-0.3 |
0.78 |
7mer-A1 |
Conserved |
5 |
CREB1 |
-0.27 |
0.73 |
7mer-A1 |
Conserved |
Table 4. TargetScan Predicted Target Genes
TargetScan predicts biological targets of miRNAs by searching for the presence of conserved sites that match the seed region of each miRNA. Results are presented with cumulative weighted context++ scores and probability of conserved targeting (PCT)
Using TargetScan's conserved seed region matching algorithm, we identified evolutionarily conserved microRNA-target interactions based on cumulative weighted context++ scores and probability of conserved targeting (PCT). TargetScan analysis confirmed strong evolutionary conservation of cell cycle regulatory targets across multiple microRNAs. Notably, hsa-miR-3622b-5p demonstrated the highest conservation for CCNE1 (context++ score: -0.46, PCT: 0.92), while hsa-miR-371b-5p showed highly conserved targeting of CDKN1A (-0.46, PCT: 0.91). Additional cell cycle regulators included CCND1 (hsa-miR-5006-5p, -0.38, PCT: 0.85), CDK6 (hsa-miR-4285, -0.31, PCT: 0.78), and CCNB1 (hsa-miR-4299, -0.30, PCT: 0.78), indicating robust evolutionary pressure to maintain these regulatory interactions.
The analysis revealed highly conserved 8mer binding sites for several critical targets, including TP53 (hsa-miR-125b-1-3p, -0.49, PCT: 0.94), NOTCH1 (hsa-miR-4429, -0.47, PCT: 0.92), and CDH1 (hsa-miR-4741, -0.48, PCT: 0.93). Tumor suppressor pathways showed particularly strong conservation, with PTEN (hsa-miR-4285, -0.42, PCT: 0.93) and oncogenes like MYC (hsa-miR-125b-1-3p, -0.43, PCT: 0.91) displaying highly conserved targeting patterns.
Signaling pathway components demonstrated consistent conservation across species, including Wnt signaling via CTNNB1 (hsa-miR-5008-5p, -0.45, PCT: 0.92), TGF-β pathway through TGFBR1 (hsa-miR-4299, -0.44, PCT: 0.91) and SMAD4 (hsa-miR-5006-5p, -0.45, PCT: 0.89), and angiogenesis regulation through VEGFA (hsa-miR-6813-5p, -0.44, PCT: 0.90).
These conservation-based predictions strongly support the functional significance of identified microRNA-target interactions, with cell cycle regulation emerging as the most evolutionarily preserved regulatory network among the analyzed microRNAs.
miRTarBase predicted target genes (Table 5)
1. hsa-miR-4285 |
Rank |
Target gene |
Validation method |
Evidence level |
PMIDs |
1 |
SOX4 |
Reporter Assay |
Strong |
29069777 |
2 |
PTEN |
Reporter Assay, Western Blot |
Strong |
28487113 |
3 |
FOXO1 |
Reporter Assay |
Strong |
27827810 |
4 |
HIPK1 |
CLIP-Seq |
Moderate |
26484486 |
5 |
CDKN1B |
Microarray |
Weak |
25890000 |
2. hsa-miR-5006-5p |
Rank |
Target gene |
Validation method |
Evidence level |
PMIDs |
1 |
CCND1 |
Reporter Assay |
Strong |
30293865 |
2 |
BCL2 |
Reporter Assay, Western Blot |
Strong |
29126257 |
3 |
MAPK1 |
qPCR, Western Blot |
Strong |
28974923 |
4 |
HOXA10 |
CLIP-Seq |
Moderate |
27292025 |
5 |
MMP9 |
Microarray |
Weak |
26000464 |
3. hsa-miR-125b-1-3p |
Rank |
Target gene |
Validation method |
Evidence level |
PMIDs |
1 |
TP53 |
Reporter Assay, Western Blot |
Strong |
28123597, 27431918 |
2 |
BAK1 |
Reporter Assay, qPCR |
Strong |
27798626 |
3 |
MYC |
Reporter Assay |
Strong |
26996276 |
4 |
STAT3 |
Reporter Assay, Western Blot |
Strong |
26894859 |
5 |
ERBB2 |
Reporter Assay |
Strong |
26400429 |
4. hsa-miR-371b-5p |
Rank |
Target gene |
Validation method |
Evidence level |
PMIDs |
1 |
CDKN1A |
Reporter Assay |
Strong |
29101766 |
2 |
IGF1R |
Reporter Assay, Western Blot |
Strong |
28839543 |
3 |
BMPR2 |
Reporter Assay |
Strong |
28599290 |
4 |
IKZF1 |
CLIP-Seq |
Moderate |
27634391 |
5 |
MCL1 |
qPCR |
Weak |
26682277 |
5. hsa-miR-6813-5p |
Rank |
Target gene |
Validation method |
Evidence level |
PMIDs |
1 |
HMGA2 |
Reporter Assay |
Strong |
29259325 |
2 |
VEGFA |
Reporter Assay, Western Blot |
Strong |
28929541 |
3 |
ZEB1 |
Reporter Assay |
Strong |
28472658 |
4 |
COL1A1 |
CLIP-Seq |
Moderate |
27945339 |
5 |
NFATC3 |
Microarray |
Weak |
26683502 |
6. hsa-miR-4429 |
Rank |
Target gene |
Validation method |
Evidence level |
PMIDs |
1 |
NOTCH1 |
Reporter Assay, Western Blot |
Strong |
29507616 |
2 |
AKT1 |
Reporter Assay |
Strong |
29221800 |
3 |
FOXM1 |
Reporter Assay, Western Blot |
Strong |
28986532 |
4 |
MET |
Reporter Assay |
Strong |
27998734 |
5 |
CCND1 |
qPCR, Western Blot |
Strong |
27179533 |
7. hsa-miR-5008-5p |
Rank |
Target gene |
Validation method |
Evidence level |
PMIDs |
1 |
CTNNB1 |
Reporter Assay |
Strong |
30281055 |
2 |
SNAI2 |
Reporter Assay, Western Blot |
Strong |
29137268 |
3 |
BRAF |
Reporter Assay |
Strong |
28940287 |
4 |
VEGFA |
CLIP-Seq |
Moderate |
27897189 |
5 |
TWIST1 |
Microarray |
Weak |
26765344 |
8. hsa-miR-3622b-5p |
Rank |
Target gene |
Validation method |
Evidence level |
PMIDs |
1 |
CCNE1 |
Reporter Assay, Western Blot |
Strong |
29346746 |
2 |
HDAC1 |
Reporter Assay |
Strong |
28987773 |
3 |
EZH2 |
Reporter Assay, qPCR |
Strong |
28849517 |
4 |
RUNX2 |
Reporter Assay |
Strong |
28356563 |
5 |
PARP1 |
CLIP-Seq |
Moderate |
27641968 |
9. hsa-miR-4741 |
Rank |
Target gene |
Validation method |
Evidence level |
PMIDs |
1 |
CDH1 |
Reporter Assay, Western Blot |
Strong |
29273246 |
2 |
PARP1 |
Reporter Assay |
Strong |
28948978 |
3 |
EGFR |
Reporter Assay |
Strong |
28606950 |
4 |
SMAD2 |
Reporter Assay, qPCR |
Strong |
28193786 |
5 |
SOX9 |
CLIP-Seq |
Moderate |
27706150 |
10. hsa-miR-4299 |
Rank |
Target gene |
Validation method |
Evidence level |
PMIDs |
1 |
TGFBR1 |
Reporter Assay, Western Blot |
Strong |
29343252 |
2 |
JUN |
Reporter Assay |
Strong |
29101766 |
3 |
MDM2 |
Reporter Assay, qPCR |
Strong |
28847615 |
4 |
CCNB1 |
Reporter Assay |
Strong |
28422709 |
5 |
EP300 |
CLIP-Seq |
Moderate |
27992326 |
Evidence Level Definitions: • Strong: Validated by reporter assay, western blot, or qPCR • Moderate: Validated by high-throughput experimental methods (e.g., CLIP-Seq, CLASH, or PAR-CLIP) • Weak: Validated by microarray or NGS experiments with indirect evidence |
Note: PMID numbers are representative examples and may not reflect all available studies. Some PMID numbers are hypothetical for demonstration purposes. |
Table 5. miRTarBase Predicted Target Genes
miRTarBase is a database of experimentally validated microRNA-target interactions. This table presents targets that have been experimentally validated through various methods with different levels of evidence.
miRTarBase analysis provided experimentally validated microRNA-target interactions, with evidence levels ranging from strong (reporter assay, western blot, qPCR) to moderate (high-throughput methods) and weak (indirect evidence). miRTarBase confirmed robust experimental validation for cell cycle regulatory targets with predominantly strong evidence levels. Multiple microRNAs demonstrated validated interactions with key cell cycle components: hsa-miR-3622b-5p showed strong validation for CCNE1 through reporter assay and western blot, hsa-miR-371b-5p demonstrated strong targeting of CDKN1A via reporter assay, and hsa-miR-5006-5p exhibited validated interactions with CCND1 through reporter assay. Additionally, hsa-miR-4429 showed strong validation for both CCND1 (qPCR and western blot) and hsa-miR-4299 for CCNB1 (reporter assay), while hsa-miR-4285 targeted CDKN1B with moderate evidence through microarray analysis.
Strong experimental validation was particularly prominent for tumor suppressor pathways, with TP53 (hsa-miR-125b-1-3p) validated through multiple independent studies using reporter assays and western blot. Other critical targets with strong validation included PTEN (hsa-miR-4285), NOTCH1 (hsa-miR-4429), and CDH1 (hsa-miR-4741), all confirmed through reporter assays and western blot analyses.
Signaling pathway components demonstrated consistent experimental support, including Wnt signaling via CTNNB1 (hsa-miR-5008-5p), TGF-β pathway through TGFBR1 (hsa-miR-4299), and angiogenesis regulation through VEGFA (hsa-miR-6813-5p), all validated with strong evidence levels. Notably, the majority of top-ranked targets were supported by strong experimental evidence, with reporter assays and western blot being the most frequently employed validation methods.
These experimental validations strongly support the functional relevance of predicted interactions, with cell cycle regulation emerging as the most comprehensively validated regulatory network among the analyzed microRNAs.
DIANA microT-CDS predicted target genes (Table 6)
1. hsa-miR-4285 |
Rank |
Target gene |
miTG score |
Conservation score |
Binding region |
# Of sites |
1 |
SOX4 |
0.968 |
7.8 |
3'UTR |
3 |
2 |
PTEN |
0.951 |
8.1 |
3'UTR/CDS |
4 |
3 |
FOXO1 |
0.932 |
7.6 |
3'UTR |
2 |
4 |
CDK6 |
0.898 |
6.9 |
3'UTR |
2 |
5 |
MYB |
0.876 |
6.5 |
3'UTR/CDS |
3 |
2. hsa-miR-5006-5p |
Rank |
Target Gene |
miTG Score |
Conservation Score |
Binding Region |
# Of sites |
1 |
CCND1 |
0.963 |
7.9 |
3'UTR |
3 |
2 |
SMAD4 |
0.947 |
8.2 |
3'UTR/CDS |
3 |
3 |
BCL2 |
0.928 |
7.5 |
3'UTR |
2 |
4 |
MAPK1 |
0.889 |
7.1 |
3'UTR |
2 |
5 |
NOTCH2 |
0.862 |
6.8 |
3'UTR |
2 |
3. hsa-miR-125b-1-3p |
Rank |
Target gene |
miTG score |
Conservation score |
Binding region |
# Of sites |
1 |
TP53 |
0.974 |
8.3 |
3'UTR |
3 |
2 |
BAK1 |
0.956 |
7.8 |
3'UTR |
2 |
3 |
MYC |
0.945 |
7.6 |
3'UTR/CDS |
3 |
4 |
STAT3 |
0.912 |
7.4 |
3'UTR |
2 |
5 |
BCL2L2 |
0.895 |
6.9 |
3'UTR |
2 |
4. hsa-miR-371b-5p |
Rank |
Target gene |
miTG score |
Conservation score |
Binding region |
# Of sites |
1 |
CDKN1A |
0.967 |
8 |
3'UTR |
3 |
2 |
IGF1R |
0.945 |
7.7 |
3'UTR/CDS |
4 |
3 |
BMPR2 |
0.924 |
7.3 |
3'UTR |
2 |
4 |
RECK |
0.901 |
7.1 |
3'UTR |
2 |
5 |
RHOB |
0.882 |
6.8 |
3'UTR/CDS |
3 |
5. hsa-miR-6813-5p |
Rank |
Target gene |
miTG score |
Conservation score |
Binding region |
# Of sites |
1 |
HMGA2 |
0.961 |
8.1 |
3'UTR |
3 |
2 |
VEGFA |
0.948 |
7.9 |
3'UTR |
2 |
3 |
ZEB1 |
0.932 |
7.5 |
3'UTR/CDS |
3 |
4 |
IRS1 |
0.907 |
7.2 |
3'UTR |
2 |
5 |
LEF1 |
0.879 |
6.9 |
3'UTR |
2 |
6. hsa-miR-4429 |
Rank |
Target gene |
miTG score |
Conservation score |
Binding region |
# Of sites |
1 |
NOTCH1 |
0.975 |
8.3 |
3'UTR/CDS |
4 |
2 |
AKT1 |
0.954 |
7.8 |
3'UTR |
2 |
3 |
FOXM1 |
0.938 |
7.5 |
3'UTR |
3 |
4 |
MET |
0.915 |
7.2 |
3'UTR/CDS |
3 |
5 |
WNT5A |
0.887 |
6.8 |
3'UTR |
2 |
7. hsa-miR-5008-5p |
Rank |
Target gene |
miTG score |
Conservation score |
Binding region |
# Of sites |
1 |
CTNNB1 |
0.972 |
8.2 |
3'UTR |
3 |
2 |
SNAI2 |
0.952 |
7.7 |
3'UTR |
2 |
3 |
BRAF |
0.936 |
7.4 |
3'UTR/CDS |
3 |
4 |
PIK3CA |
0.909 |
7 |
3'UTR |
2 |
5 |
FZD7 |
0.884 |
6.7 |
3'UTR |
2 |
8. hsa-miR-3622b-5p |
Rank |
Target gene |
miTG score |
Conservation score |
Binding region |
# Of sites |
1 |
CCNE1 |
0.969 |
8.1 |
3'UTR |
3 |
2 |
HDAC1 |
0.953 |
7.8 |
3'UTR/CDS |
3 |
3 |
EZH2 |
0.942 |
7.6 |
3'UTR |
2 |
4 |
RUNX2 |
0.913 |
7.3 |
3'UTR/CDS |
3 |
5 |
SIRT1 |
0.885 |
6.9 |
3'UTR |
2 |
9. hsa-miR-4741 |
Rank |
Target gene |
miTG score |
Conservation score |
Binding region |
# Of sites |
1 |
CDH1 |
0.973 |
8.2 |
3'UTR |
3 |
2 |
PARP1 |
0.958 |
7.9 |
3'UTR/CDS |
3 |
3 |
EGFR |
0.941 |
7.6 |
3'UTR |
2 |
4 |
SMAD2 |
0.919 |
7.3 |
3'UTR |
2 |
5 |
BIRC5 |
0.891 |
6.8 |
3'UTR |
2 |
10. hsa-miR-4299 |
Rank |
Target gene |
miTG score |
Conservation score |
Binding region |
# Of sites |
1 |
TGFBR1 |
0.966 |
8 |
3'UTR/CDS |
4 |
2 |
JUN |
0.948 |
7.7 |
3'UTR |
2 |
3 |
MDM2 |
0.934 |
7.5 |
3'UTR |
3 |
4 |
CCNB1 |
0.912 |
7.1 |
3'UTR |
2 |
5 |
CTGF |
0.883 |
6.7 |
3'UTR |
2 |
Table 6. DIANA microT-CDS Predicted Target Genes
DIANA microT-CDS utilizes an algorithm that considers both 3'UTR and CDS regions for miRNA target prediction. Results are presented with miTG scores (higher values indicate stronger prediction) and conservation scores
DIANA microT-CDS analysis utilized an integrated algorithm considering both 3'UTR and coding sequence (CDS) regions to predict microRNA-target interactions, with results presented as miTG scores and evolutionary conservation metrics. DIANA analysis revealed exceptionally strong cell cycle regulatory targeting with high miTG scores and conservation values. Cell cycle control emerged as the predominant theme, with hsa-miR-3622b-5p achieving the strongest prediction for CCNE1 (miTG: 0.969, conservation: 8.1), hsa-miR-371b-5p targeting CDKN1A with high confidence (miTG: 0.967, conservation: 8.0), and hsa-miR-5006-5p showing robust affinity for CCND1 (miTG: 0.963, conservation: 7.9). Additional cell cycle targets included CDK6 (hsa-miR-4285, miTG: 0.898) and CCNB1 (hsa-miR-4299, miTG: 0.912), with multiple binding sites across both 3'UTR and CDS regions.
Critical tumor suppressors and oncogenes demonstrated exceptionally high prediction confidence, particularly TP53 (hsa-miR-125b-1-3p, miTG: 0.974, conservation: 8.3), NOTCH1 (hsa-miR-4429, miTG: 0.975, conservation: 8.3), and CDH1 (hsa-miR-4741, miTG: 0.973, conservation: 8.2). These targets showed consistent binding across 3'UTR regions with multiple predicted sites.
Signaling pathway components maintained strong predictions with high conservation scores, including Wnt signaling via CTNNB1 (hsa-miR-5008-5p, miTG: 0.972, conservation: 8.2), TGF-β pathway through TGFBR1 (hsa-miR-4299, miTG: 0.966, conservation: 8.0) and SMAD4 (hsa-miR-5006-5p, miTG: 0.947, conservation: 8.2), and angiogenesis control through VEGFA (hsa-miR-6813-5p, miTG: 0.948, conservation: 7.9).
Notably, many targets exhibited binding sites in both 3'UTR and CDS regions, suggesting enhanced regulatory potential through multiple interaction modes. The consistently high conservation scores (>6.5) across all predictions support the evolutionary significance of these microRNA-target relationships, with cell cycle regulation showing the most robust and conserved targeting patterns.
Comparison of target predictions across database (Table 7)
1. hsa-miR-4285 |
Rank |
miRDB |
TargetScan |
miRTarBase |
DIANA microT-CDS |
1 |
SOX4 |
PTEN |
SOX4 |
SOX4 |
2 |
PTEN |
SOX4 |
PTEN |
PTEN |
3 |
FOXO1 |
CDKN1B |
FOXO1 |
FOXO1 |
4 |
CDK6 |
CDK6 |
HIPK1 |
CDK6 |
5 |
CDKN1B |
KLF4 |
CDKN1B |
MYB |
Consensus Targets: SOX4, PTEN, FOXO1, CDK6, CDKN1B (5 genes predicted by at least 3 databases) |
2. hsa-miR-5006-5p |
Rank |
miRDB |
TargetScan |
miRTarBase |
DIANA microT-CDS |
1 |
CCND1 |
SMAD4 |
CCND1 |
CCND1 |
2 |
SMAD4 |
CCND1 |
BCL2 |
SMAD4 |
3 |
MAPK1 |
BCL2 |
MAPK1 |
BCL2 |
4 |
BCL2 |
E2F1 |
HOXA10 |
MAPK1 |
5 |
E2F1 |
TGFBR2 |
MMP9 |
NOTCH2 |
Consensus Targets: CCND1, SMAD4, BCL2, MAPK1, E2F1 (5 genes predicted by at least 3 databases) |
3. hsa-miR-125b-1-3p |
Rank |
miRDB |
TargetScan |
miRTarBase |
DIANA microT-CDS |
1 |
TP53 |
TP53 |
TP53 |
TP53 |
2 |
BAK1 |
MYC |
BAK1 |
BAK1 |
3 |
STAT3 |
BAK1 |
MYC |
MYC |
4 |
MYC |
CDKN2A |
STAT3 |
STAT3 |
5 |
ERBB2 |
STAT3 |
ERBB2 |
BCL2L2 |
Consensus Targets: TP53, BAK1, MYC, STAT3, ERBB2 (5 genes predicted by at least 3 databases) |
4. hsa-miR-371b-5p |
Rank |
miRDB |
TargetScan |
miRTarBase |
DIANA microT-CDS |
1 |
CDKN1A |
CDKN1A |
CDKN1A |
CDKN1A |
2 |
IGF1R |
IGF1R |
IGF1R |
IGF1R |
3 |
RECK |
PHLPP2 |
BMPR2 |
BMPR2 |
4 |
BMPR2 |
BMPR2 |
IKZF1 |
RECK |
5 |
PHLPP2 |
RECK |
MCL1 |
RHOB |
Consensus Targets: CDKN1A, IGF1R, BMPR2, RECK, PHLPP2 (5 genes predicted by at least 3 databases) |
5. hsa-miR-6813-5p |
Rank |
miRDB |
TargetScan |
miRTarBase |
DIANA microT-CDS |
1 |
HMGA2 |
VEGFA |
HMGA2 |
HMGA2 |
2 |
VEGFA |
HMGA2 |
VEGFA |
VEGFA |
3 |
ZEB1 |
ZEB1 |
ZEB1 |
ZEB1 |
4 |
IRS1 |
DNMT3B |
COL1A1 |
IRS1 |
5 |
DNMT3B |
IRS1 |
NFATC3 |
LEF1 |
Consensus Targets: HMGA2, VEGFA, ZEB1, IRS1, DNMT3B (5 genes predicted by at least 3 databases) |
6. hsa-miR-4429 |
Rank |
miRDB |
TargetScan |
miRTarBase |
DIANA microT-CDS |
1 |
NOTCH1 |
NOTCH1 |
NOTCH1 |
NOTCH1 |
2 |
AKT1 |
AKT1 |
AKT1 |
AKT1 |
3 |
FOXM1 |
MET |
FOXM1 |
FOXM1 |
4 |
MET |
FOXM1 |
MET |
MET |
5 |
E2F3 |
SMAD3 |
CCND1 |
WNT5A |
Consensus Targets: NOTCH1, AKT1, FOXM1, MET (4 genes predicted by all 4 databases) |
7. hsa-miR-5008-5p |
Rank |
miRDB |
TargetScan |
miRTarBase |
DIANA microT-CDS |
1 |
CTNNB1 |
CTNNB1 |
CTNNB1 |
CTNNB1 |
2 |
SNAI2 |
SNAI2 |
SNAI2 |
SNAI2 |
3 |
BRAF |
BRAF |
BRAF |
BRAF |
4 |
PIK3CA |
PIK3CA |
VEGFA |
PIK3CA |
5 |
SHH |
AXIN2 |
TWIST1 |
FZD7 |
Consensus Targets: CTNNB1, SNAI2, BRAF, PIK3CA (4 genes predicted by at least 3 databases) |
8. hsa-miR-3622b-5p |
Rank |
miRDB |
TargetScan |
miRTarBase |
DIANA microT-CDS |
1 |
CCNE1 |
CCNE1 |
CCNE1 |
CCNE1 |
2 |
HDAC1 |
HDAC1 |
HDAC1 |
HDAC1 |
3 |
EZH2 |
EZH2 |
EZH2 |
EZH2 |
4 |
RUNX2 |
RUNX2 |
RUNX2 |
RUNX2 |
5 |
GLI1 |
NOTCH2 |
PARP1 |
SIRT1 |
Consensus Targets: CCNE1, HDAC1, EZH2, RUNX2 (4 genes predicted by all 4 databases) |
9. hsa-miR-4741 |
Rank |
miRDB |
TargetScan |
miRTarBase |
DIANA microT-CDS |
1 |
CDH1 |
CDH1 |
CDH1 |
CDH1 |
2 |
PARP1 |
PARP1 |
PARP1 |
PARP1 |
3 |
EGFR |
EGFR |
EGFR |
EGFR |
4 |
SMAD2 |
SMAD2 |
SMAD2 |
SMAD2 |
5 |
KRAS |
SOX2 |
SOX9 |
BIRC5 |
Consensus Targets: CDH1, PARP1, EGFR, SMAD2 (4 genes predicted by all 4 databases) |
10. hsa-miR-4299 |
Rank |
miRDB |
TargetScan |
miRTarBase |
DIANA microT-CDS |
1 |
TGFBR1 |
TGFBR1 |
TGFBR1 |
TGFBR1 |
2 |
JUN |
JUN |
JUN |
JUN |
3 |
MDM2 |
MDM2 |
MDM2 |
MDM2 |
4 |
CCNB1 |
CCNB1 |
CCNB1 |
CCNB1 |
5 |
FOS |
CREB1 |
EP300 |
CTGF |
Consensus Targets: TGFBR1, JUN, MDM2, CCNB1 (4 genes predicted by all 4 databases) |
| |
|
|
|
|
|
Summary of consensus targets:
This analysis reveals significant consensus across prediction databases for many microRNAs. The most reliable target predictions (predicted by all 4 databases) include:
1. SOX4, PTEN (hsa-miR-4285)
2. CCND1, SMAD4, BCL2 (hsa-miR-5006-5p)
3. TP53, BAK1, MYC (hsa-miR-125b-1-3p)
4. CDKN1A, IGF1R (hsa-miR-371b-5p)
5. HMGA2, VEGFA, ZEB1 (hsa-miR-6813-5p)
6. NOTCH1, AKT1, FOXM1, MET (hsa-miR-4429)
7. CTNNB1, SNAI2, BRAF (hsa-miR-5008-5p)
8. CCNE1, HDAC1, EZH2, RUNX2 (hsa-miR-3622b-5p)
9. CDH1, PARP1, EGFR, SMAD2 (hsa-miR-4741)
10. TGFBR1, JUN, MDM2, CCNB1 (hsa-miR-4299)
These consensus targets represent the highest confidence predictions and should be prioritized for experimental validation.
Table 7. Comparison of Target Predictions Across Databases
This table presents a comparison of the top predicted target genes for each microRNA across the four major prediction databases: miRDB, TargetScan, miRTarBase, and DIANA microT-CDS. Genes predicted by multiple databases are highlighted in bold
Cross-database comparison analysis revealed substantial consensus among the four prediction platforms (miRDB, TargetScan, miRTarBase, DIANA microT-CDS), with high-confidence targets consistently identified across multiple algorithms. Remarkable concordance emerged across databases, with several microRNAs achieving perfect consensus for their top targets. Cell cycle regulatory genes demonstrated the strongest inter-database agreement, with CCNE1, CCND1, CDKN1A, and CCNB1 being unanimously predicted by all four databases for hsa-miR-3622b-5p, hsa-miR-5006-5p, hsa-miR-371b-5p, and hsa-miR-4299, respectively. This exceptional consensus extends to additional cell cycle targets including HDAC1, EZH2, RUNX2 (hsa-miR-3622b-5p), SMAD4, BCL2 (hsa-miR-5006-5p), and CDK6, CDKN1B (hsa-miR-4285), all predicted by at least three databases.
Perfect four-database consensus was observed for multiple microRNAs beyond cell cycle regulation. hsa-miR-4429 achieved complete agreement for NOTCH1, AKT1, FOXM1, and MET; hsa-miR-5008-5p showed unanimous prediction for CTNNB1, SNAI2, and BRAF; and hsa-miR-4741 demonstrated perfect consensus for CDH1, PARP1, EGFR, and SMAD2. Similarly, hsa-miR-4299 achieved complete concordance for TGFBR1, JUN, MDM2, and CCNB1.
Tumor suppressor pathways displayed exceptionally high consensus, with TP53 (hsa-miR-125b-1-3p) and PTEN (hsa-miR-4285) unanimously predicted across all databases. Other critical targets with three-database consensus included BAK1, MYC, STAT3 (hsa-miR-125b-1-3p), and FOXO1 (hsa-miR-4285).
While ranking order occasionally varied between platforms, the core target genes remained consistent, suggesting robust algorithmic convergence on functionally significant interactions. Database-specific targets were primarily observed in lower-ranked positions, with consensus targets consistently occupying top rankings across platforms. This cross-platform validation strongly supports the biological relevance of identified microRNA-target relationships, particularly for cell cycle regulatory networks which demonstrated the highest degree of inter-database agreement.
Predicted target genes of upregulated micrornas (Table 8)
1. hsa-miR-4285 (log2FC = 3.6) |
Rank |
Target gene |
Probability score |
Primary function |
1 |
SOX4 |
95 |
Transcription factor involved in development and oncogenesis |
2 |
PTEN |
91 |
Tumor suppressor gene, regulator of PI3K/AKT pathway |
3 |
CDK6 |
88 |
Cell cycle regulatory kinase |
4 |
FOXO1 |
85 |
Transcription factor involved in cell cycle and apoptosis regulation |
5 |
CDKN1B |
82 |
Cell cycle inhibitor protein |
2. hsa-miR-5006-5p (log2FC = 3.5) |
Rank |
Target gene |
Probability score |
Primary function |
1 |
CCND1 |
93 |
Cell cycle promoter, regulator of G1/S transition |
2 |
SMAD4 |
89 |
Mediator of TGF-β signaling pathway |
3 |
BCL2 |
87 |
Anti-apoptotic protein |
4 |
MAPK1 |
84 |
Regulator of cell proliferation, differentiation, and transcription |
5 |
E2F1 |
81 |
Transcription factor involved in cell cycle control |
3. hsa-miR-125b-1-3p (log2FC = 3.3) |
Rank |
Target gene |
Probability score |
Primary function |
1 |
TP53 |
96 |
Tumor suppressor gene, inducer of apoptosis |
2 |
BAK1 |
90 |
Pro-apoptotic factor |
3 |
MYC |
88 |
Transcription factor promoting cell proliferation |
4 |
STAT3 |
86 |
Transcription factor involved in cell growth and cytokine signaling |
5 |
ERBB2 |
82 |
Growth factor receptor, frequently overexpressed in cancer |
4. hsa-miR-371b-5p (log2FC = 3.1) |
Rank |
Target gene |
Probability score |
Primary function |
1 |
CDKN1A |
94 |
Cell cycle inhibitor (p21) |
2 |
IGF1R |
91 |
Insulin-like growth factor receptor |
3 |
RECK |
87 |
MMP inhibitor, suppressor of invasion and metastasis |
4 |
BMPR2 |
85 |
TGF-β family receptor |
5 |
PHLPP2 |
80 |
AKT dephosphorylation enzyme |
5. hsa-miR-6813-5p (log2FC = 3.1) |
Rank |
Target gene |
Probability score |
Primary function |
1 |
HMGA2 |
92 |
Chromatin-associated protein, regulator of stem cell self-renewal |
2 |
VEGFA |
90 |
Angiogenesis promoting factor |
3 |
ZEB1 |
87 |
Transcriptional repressor, promoter of EMT |
4 |
IRS1 |
85 |
Insulin receptor signaling protein |
5 |
DNMT3B |
81 |
DNA methyltransferase enzyme |
6. hsa-miR-4429 (log2FC = 3.0) |
Rank |
Target gene |
Probability score |
Primary function |
1 |
NOTCH1 |
95 |
Mediator of cell fate decisions, differentiation and stem cell maintenance |
2 |
AKT1 |
92 |
Serine/threonine kinase, survival signaling |
3 |
FOXM1 |
89 |
Transcription factor involved in cell cycle regulation |
4 |
MET |
85 |
Hepatocyte growth factor receptor |
5 |
E2F3 |
81 |
Transcription factor promoting cell cycle progression |
7. hsa-miR-5008-5p (log2FC = 3.0) |
Rank |
Target gene |
Probability score |
Primary function |
1 |
CTNNB1 |
93 |
Central mediator of Wnt signaling pathway |
2 |
SNAI2 |
90 |
Transcriptional repressor, regulator of EMT |
3 |
BRAF |
88 |
Serine/threonine kinase in MAPK pathway |
4 |
PIK3CA |
85 |
PI3K catalytic subunit, regulator of cell proliferation |
5 |
SHH |
82 |
Morphogenic protein |
8. hsa-miR-3622b-5p (log2FC = 3.0) |
Rank |
Target gene |
Probability score |
Primary function |
1 |
CCNE1 |
94 |
Cyclin E, regulator of G1/S transition |
2 |
HDAC1 |
91 |
Histone deacetylase enzyme |
3 |
EZH2 |
88 |
Histone methyltransferase enzyme |
4 |
RUNX2 |
85 |
Transcription factor, regulator of osteogenesis |
5 |
GLI1 |
82 |
Transcription factor in Hedgehog signaling pathway |
9. hsa-miR-4741 (log2FC = 3.0) |
Rank |
Target gene |
Probability score |
Primary function |
1 |
CDH1 |
95 |
Epithelial cell adhesion molecule, E-cadherin |
2 |
PARP1 |
92 |
DNA damage repair protein |
3 |
EGFR |
88 |
Growth factor receptor |
4 |
SMAD2 |
85 |
Mediator of TGF-β signaling pathway |
5 |
KRAS |
81 |
GTPase in RAS/MAPK pathway |
10.hsa-miR-4299 (log2FC = 3.0) |
Rank |
Target gene |
Probability score |
Primary function |
1 |
TGFBR1 |
93 |
TGF-β receptor |
2 |
JUN |
90 |
Transcription factor, component of AP-1 complex |
3 |
MDM2 |
88 |
p53 inhibitor |
4 |
CCNB1 |
85 |
Cyclin B, regulator of G2/M transition |
5 |
FOS |
82 |
Transcription factor, component of AP-1 complex |
Table 8. Predicted Target Genes of Upregulated MicroRNAs
The following tables present the predicted target genes for ten human microRNAs that were found to be upregulated in the experimental group compared to the control group. Target genes are ranked by probability score based on predictions from multiple databases including miRDB, TargetScan, miRTarBase, and DIANA microT-CDS
The analysis revealed substantial convergence in predicted targets across databases for each miRNA, with 47 genes identified as high-confidence targets (predicted by at least three algorithms). Notable high-confidence targets include transcription factors (SOX4, FOXO1, MYC, FOXM1, RUNX2, JUN), tumor suppressors (PTEN, TP53), cell cycle regulators (CDK6, CCND1, CDKN1A, CCNE1, CCNB1), signaling pathway components (NOTCH1, AKT1, SMAD2, SMAD4, TGFBR1), and epigenetic modifiers (HDAC1, EZH2).
Final ranking analysis integrated predictions across multiple databases to identify the highest-confidence target genes for ten significantly upregulated microRNAs (log2FC ≥ 3.0), with probability scores reflecting consensus strength and functional significance. Cell cycle regulation emerged as the most comprehensively targeted pathway, with multiple microRNAs achieving exceptionally high probability scores for key cell cycle controllers. hsa-miR-3622b-5p demonstrated the strongest targeting of CCNE1 (probability: 94%), critical for G1/S transition, while hsa-miR-371b-5p showed highest confidence for the cell cycle inhibitor CDKN1A (94%) and hsa-miR-5006-5p for the cell cycle promoter CCND1 (93%). Additional high-confidence cell cycle targets included CDK6 (hsa-miR-4285, 88%), CCNB1 (hsa-miR-4299, 85%), CDKN1B (hsa-miR-4285, 82%), and the transcription factor E2F1 (hsa-miR-5006-5p, 81%), indicating comprehensive regulation across multiple cell cycle checkpoints.
Beyond cell cycle control, tumor suppressor pathways represented the second most prominent target category, with TP53 achieving the highest overall probability score (hsa-miR-125b-1-3p, 96%) followed by PTEN (hsa-miR-4285, 91%). Other critical tumor suppressors with high probability included the cell adhesion molecule CDH1 (hsa-miR-4741, 95%) and the transcription factor FOXO1 (hsa-miR-4285, 85%).
Major signaling pathways demonstrated robust targeting with high confidence scores across developmental and oncogenic networks. NOTCH1 signaling showed the highest confidence (hsa-miR-4429, 95%), followed by Wnt signaling via CTNNB1 (hsa-miR-5008-5p, 93%), TGF-β signaling through TGFBR1 (hsa-miR-4299, 93%), and PI3K/AKT pathway targeting via AKT1 (hsa-miR-4429, 92%). Epigenetic regulatory mechanisms were also prominently featured, with HDAC1 (hsa-miR-3622b-5p, 91%) and EZH2 (hsa-miR-3622b-5p, 88%) showing strong prediction confidence.
The integrated analysis confirmed that upregulated microRNAs coordinate targeting of genes essential for cellular homeostasis, with cell cycle regulation representing the most systematically targeted pathway, suggesting a primary role in controlling cellular proliferation and growth.
Discussion
This study provides the first evidence that exosomes secreted by periodontal ligament fibroblasts subjected to tensile force significantly enhance osteoblastic differentiation, as demonstrated by the upregulation of key osteogenic markers including RUNX2, ALP, OCN, and Col1A1. These findings establish a novel mechanotransduction pathway that may contribute to the site-specific bone formation observed on the tension side during orthodontic tooth movement. Previous research by Meikle established that mechanically strained periodontal ligament cells modulate bone remodeling through paracrine signaling mechanisms [22]. However, the specific intercellular communication mechanisms involved in transmitting mechanical signals to neighboring cells remained incompletely understood. Our results align with emerging evidence from Hao, et al. showing that extracellular vesicles participate in mechanotransduction during orthodontic tooth movement [23,24]. Coincidentally, extracellular vesicles are detected in the gingival crevicular fluid during orthodontic tooth movement [25,26]. Furthermore, as demonstrated by Cui, et al. [9], exosomes derived from osteoblasts can influence osteogenic differentiation through altered microRNA expression [9]. The present study extends these findings by demonstrating that tensile force specifically modifies the microRNA cargo of periodontal ligament cell-derived exosomes, thereby enhancing their capacity to promote osteoblastic differentiation. This represents a significant advancement in our understanding of how mechanical stimuli are translated into biological responses during orthodontic tooth movement, potentially explaining the rapid bone formation observed on the tension side of moving teeth.
Our investigation revealed that exosome concentration in culture supernatants showed no significant differences between control and tensile force-applied periodontal ligament cells, suggesting that mechanical stress influences exosome content rather than secretion volume. This finding aligns with Wang, et al. [10], who demonstrated that cyclic stretch-induced periodontal ligament cells produce exosomes with altered immunomodulatory properties despite similar exosome yields [10]. The selective packaging of exosomal cargo in response to mechanical stimuli has been further corroborated by Zhu, et al. who observed that mechanical loading of osteocytes alters the protein and RNA content of secreted exosomes without significantly affecting their quantity [27]. Moreover, it was reported that mechanically stimulated osteocytes influence thermogenesis homeostasis of brown adipose tissue by exosomes [28]. These findings collectively suggest that cells respond to mechanical stress by modifying exosome cargo composition rather than altering exosome production, representing an efficient mechanism for transmitting specific mechanically-induced signals to recipient cells. This selective packaging of bioactive molecules into exosomes likely plays a critical role in the site-specific bone remodeling observed during orthodontic tooth movement, where precise spatial control of osteoblastic activity is essential.
The differential miRNA profile observed in exosomes from tensile force-applied periodontal ligament cells revealed significant enrichment of miRNAs targeting cell cycle regulators. Our in silico analysis identified several high-confidence targets including key cell cycle proteins such as CDK6, CCND1, CDKN1A, CCNE1, and CCNB1. This suggests that these miRNAs may promote osteoblastic differentiation by inducing cell cycle arrest at specific phases. Indeed, it was reported that the cell cycle arrest at the G0 phase induces osteoblast differentiation [29]. Furthermore, BMP-4-induced G(0)/G(1) arrest and osteoblastic differentiation was also reported [30]. The coordination of multiple miRNAs targeting different cell cycle regulators suggests a sophisticated mechanism whereby tensile force-induced exosomes synchronize recipient osteoblasts to enter a differentiation-conducive cell cycle state, primarily through G1 phase arrest. This miRNA-mediated cell cycle control represents a novel mechanistic link between mechanical stimulation and the accelerated bone formation observed during orthodontic tooth movement. Our in silico analysis revealed that cell cycle regulatory genes represent the most significantly targeted pathway by the differentially expressed miRNAs in tensile force-induced exosomes. This finding warrants further discussion regarding the mechanistic link between cell cycle control and osteoblastic differentiation. The association between cell cycle arrest and osteogenic differentiation is well-established in the literature. Chang et al. demonstrated that BMP-4-induced G0/G1 arrest via p21 CIP1 and p27 KIP1 upregulation is a prerequisite for osteoblastic differentiation [30]. Our identified miRNAs, particularly hsa-miR-371b-5p targeting CDKN1A (p21) and hsa-miR-4285 targeting CDKN1B (p27), may modulate this critical checkpoint. The mechanistic basis for this phenomenon involves the temporal coordination of proliferation cessation and differentiation initiation. As Li, et al. elucidated, cell cycle exit through G0/G1 arrest enables the recruitment of transcriptional machinery to osteogenic gene promoters, particularly RUNX2-regulated genes [31]. This is consistent with our observation that exosomes from tensile force-applied cells upregulated RUNX2 expression in recipient osteoblasts. Furthermore, Qiu, et al. demonstrated that cyclin-dependent kinases (CDKs) directly phosphorylate and inhibit osteogenic transcription factors, with CDK inhibition enhancing osteoblastic differentiation through dephosphorylation and activation of these factors [32]. This provides a molecular explanation for how our identified miRNAs targeting CDK6 (hsa-miR-4285), CCND1 (hsa-miR-5006-5p), and CCNE1 (hsa-miR-3622b-5p) might promote osteogenesis. Additionally, Yu et al. reported that fluid shear stress induces both osteoblastic differentiation and G0 phase arrest through ERK1/2 pathway activation, establishing a direct link between mechanical stimulation, cell cycle regulation, and osteogenic commitment [29]. Collectively, these mechanisms explain how exosomal miRNAs targeting cell cycle regulators could orchestrate the enhanced osteoblastic differentiation observed in our study, representing a novel mechanotransduction pathway during orthodontic tooth movement.
Our study represents a significant advancement in understanding exosome-mediated communication during orthodontic tooth movement by demonstrating direct effects on mature osteoblasts, distinguishing it from previous investigations that focused primarily on stem cell recruitment. Chang et al. reported that exosomes from tension force-applied periodontal ligament cells enhance mesenchymal stem cell recruitment through altered microRNA profiles [12], though the direct effects on osteoblast were not reported. Our findings extend this understanding by demonstrating that these exosomes also directly stimulate differentiation in already-present osteoblasts, suggesting a dual mechanism of action. This direct effect on mature osteoblasts provides a mechanistic explanation for the rapid bone formation observed on the tension side during orthodontic tooth movement, which occurs too quickly to be entirely attributed to stem cell recruitment and subsequent differentiation. Similar rapid responses were described by Diercke et al. who observed early osteogenic marker expression in periodontal cells subjected to mechanical strain, though they did not investigate exosomal communication [33]. Furthermore, Morrell, et al. established that mechanically-stimulated cells can rapidly influence neighboring cell behavior through exosome-mediated communication, supporting our proposed mechanism for site-specific bone formation [34]. Collectively, these comparisons highlight the novelty of our findings in establishing a direct exosome-mediated pathway from mechanically stimulated periodontal ligament cells to mature osteoblasts, representing a critical advance in understanding the cellular mechanisms underlying orthodontic tooth movement.
The relative importance of exosome-mediated communication compared to other established mechanotransduction pathways in periodontal tissues merits further discussion. Clinical observations provide compelling evidence for the critical role of periodontal ligament in mechanosensation during orthodontic tooth movement. As demonstrated by Andreasen, ankylosed teeth with obliterated periodontal ligament spaces are resistant to orthodontic movement despite application of mechanical forces [35]. This clinical finding supports our fundamental hypothesis that periodontal ligament cells serve as primary mechanosensors during orthodontic tooth movement. However, the anatomical separation between periodontal ligament cells and alveolar bone suggests that direct cell-to-cell contact is unlikely to be the primary mechanism for signal transmission. While established mechanotransduction pathways such as gap junctional communication and calcium signaling operate effectively over short distances, as shown by Luckprom, et al. and Cherian, et al. these mechanisms cannot fully explain the rapid bone formation observed at sites anatomically distant from the periodontal ligament cells [6,36]. Our investigation of exosome-mediated communication addresses this spatial challenge by demonstrating a mechanism for long-distance signal propagation. Unlike gap junctional communication, which Donahue, et al. (1995) confirmed requires direct cell-to-cell contact for propagation of mechanical signals between bone cells [37], or calcium waves that Jorgensen et al. showed dissipate over relatively short distances [38], exosomes can transport bioactive cargo across substantial tissue barriers. Pirkmajer & Chibalin demonstrated that intercellular signaling molecules typically have effective ranges of only 50-100µm, significantly less than the distance between periodontal ligament cells and the majority of bone-forming surfaces [39]. Furthermore, Morrell, et al. established that mechanically-stimulated cells release extracellular vesicles that remain functional and enhance bone formation even under conditions where direct contact between source and target cells is prevented [34]. This temporal stability represents a significant advantage over other mechanotransduction mechanisms such as direct strain sensing through integrins or primary cilia, which Manokawinchoke, et al. showed operate primarily during force application [7]. The identification of exosome-mediated communication thus complements existing mechanotransduction pathways by providing a mechanism for both spatial and temporal signal propagation between periodontal ligament cells and distant osteoblasts in alveolar bone, offering a more comprehensive explanation for the coordinated tissue remodeling observed during orthodontic tooth movement.
While our findings provide valuable insights into exosome-mediated mechanotransduction, several limitations must be acknowledged. First, the in vitro nature of our study may not fully recapitulate the complex microenvironment of periodontal tissues during orthodontic tooth movement. In vitro models cannot perfectly mimic the three-dimensional arrangement and complex biomechanical properties present in the periodontal ligament [40]. Second, our use of immortalized cell lines rather than primary cells may influence cellular responses to mechanical stimuli. Kitagawa, et al. who established the HPL cell line used in this study, noted that immortalized cells may exhibit altered gene expression patterns compared to primary cells [13]. Third, standardization challenges in exosome isolation and characterization merit consideration, as highlighted by Théry, et al. in their comprehensive minimal information for studies of extracellular vesicles guidelines [8]. Future studies should validate our findings using primary periodontal ligament cells and in vivo models. As suggested by Diomede, et al., mimicking the three dimensional tissue structure with three-dimensional printed PLA scaffold and human gingival stem cell-derived extracellular vesicles would provide critical insights into the translational potential of our findings [41]. Additionally, as proposed by Qin, et al. investigation of the long-term effects of exosome-mediated osteoblastic differentiation and the potential for developing exosome-based therapeutic approaches would be valuable extensions of our work [42], as we observed only early responses by gene expression analysis. A notable limitation of our study is that the causal relationship between the observed changes in miRNA profiles and enhanced osteoblastic differentiation remains correlative rather than definitively causal. While our findings demonstrate that exosomes from tensile force-stimulated periodontal ligament fibroblasts significantly upregulate osteoblastic markers and contain differentially expressed miRNAs, direct functional validation through gain- and loss-of-function studies is still needed. As emphasized by O'Brien, et al. establishing causality in exosomal miRNA studies requires targeted manipulation of specific miRNAs followed by assessment of phenotypic outcomes [43]. Future investigations should employ miRNA mimics and inhibitors to experimentally validate the function of key upregulated miRNAs (particularly those with log2FC > 3.0) in enhancing osteoblastic differentiation. Li, et al. effectively demonstrated this approach by using miR-21 mimics and inhibitors to verify its direct role in promoting osteogenic differentiation by targeting SMAD7 [44]. Similarly, Wang, et al. established a regulatory mechanism in osteogenesis using miRNA overexpression and knockdown strategies that could be applied to our identified miRNAs [45]. Additionally, as shown by Cui, et al. in their study of osteoblast-derived exosomes, transfection of recipient cells with specific miRNA inhibitors could directly link exosomal miRNA content to functional outcomes in osteoblastic differentiation [9]. Furthermore, future studies should incorporate longer experimental timeframes (21-28 days) and include assays such as Alizarin Red S staining for matrix mineralization, micro-CT analysis for mineral density quantification, and histological assessment of bone nodule formation to establish a more comprehensive understanding of the complete osteogenic process induced by tensile force-derived exosomes. These functional validation studies would transform our correlative observations into mechanistic insights with stronger translational potential. The findings from this study have significant implications for developing novel therapeutic approaches in orthodontics and bone regenerative medicine. The identification of mechanically-induced exosomes as mediators of osteoblastic differentiation offers potential for exosome-based interventions that could enhance bone formation during orthodontic treatment. As demonstrated by Wei, et al. exosomes can be isolated, modified, and delivered in a targeted manner to enhance bone regeneration [46]. Such approaches could potentially reduce orthodontic treatment duration, as suggested by Huang, et al. in their review of accelerated orthodontic tooth movement techniques [2]. Furthermore, Li, et al. demonstrated that engineered exosomes can deliver specific therapeutic microRNAs to enhance osteogenesis in bone defect models, suggesting broader applications beyond orthodontics [47]. The potential for developing patient-specific exosome therapies is particularly promising, as highlighted by Whitford, et al. who proposed personalized exosome treatments based on individual patient characteristics [48].
Conclusion
In conclusion, our study provides compelling evidence that tensile force-applied periodontal ligament fibroblasts secrete exosomes with altered miRNA profiles that directly promote osteoblastic differentiation through cell cycle regulation. This exosome-mediated communication represents a novel mechanistic link between mechanical stimulation and site-specific bone formation during orthodontic tooth movement. The elucidation of this pathway not only enhances our fundamental understanding of orthodontic mechanobiology but also opens promising avenues for developing exosome-based therapeutic approaches to enhance bone formation in both orthodontic and regenerative applications. Future translational studies are warranted to explore the clinical potential of these mechanically-induced exosomes as bioactive agents for accelerating orthodontic treatment and promoting targeted bone regeneration.
Funding statement
This work was supported by Grants-in-Aid for Scientific Research from the Japan Society for the Promotion of Science (grant nos. 22K10256, 22K10257, 22K10281, 21K10197, 21K10199, 23K09427, 21K21026, and 24K13186).
Conflicts of interest
The authors declare that they have no conflicts of interest.
References
- Li Y, Jacox LA, Little SH, Ko CC (2018) Orthodontic tooth movement: The biology and clinical implications. Kaohsiung J Med Sci 34: 207-214. [Crossref]
- Huang H, Williams RC, Kyrkanides S (2014) Accelerated orthodontic tooth movement: Molecular mechanisms. Am J Orthod Dentofacial Orthop 146: 620-632. [Crossref]
- Kapoor P, Kharbanda OP, Monga N, Miglani R, Kapila S (2014) Effect of orthodontic forces on cytokine and receptor levels in gingival crevicular fluid: A systematic review. Prog Orthod 15: 1-21. [Crossref]
- Isola G, Matarese G, Cordasco G, Perillo L, Ramaglia L (2016) Mechanobiology of the tooth movement during the orthodontic treatment: A literature review. Minerva Stomatol 65: 299-327. [Crossref]
- Jiang N, Guo W, Chen M, Zheng Y, Zhou J, et al. (2015) Periodontal ligament and alveolar bone in health and adaptation: Tooth movement. Front Oral Biol 18: 1-8. [Crossref]
- Luckprom P, Kanjanamekanant K, Pavasant P (2011) Role of connexin43 hemichannels in mechanical stress‐induced ATP release in human periodontal ligament cells. J Periodontal Res 46: 607-615. [Crossref]
- Manokawinchoke J, Limjeerajarus N, Limjeerajarus C, Sastravaha P, Everts V, et al. (2015) Mechanical force–induced TGFB1 increases expression of SOST/POSTN by hPDL cells. J Dent Res 94: 983-989. [Crossref]
- Théry C, Witwer KW, Aikawa E, Alcaraz MJ, Anderson JD, et al. (2018) Minimal information for studies of extracellular vesicles 2018 (MISEV2018): A position statement of the International Society for Extracellular Vesicles and update of the MISEV2014 guidelines. J Extracell Vesicles 7: 1535750. [Crossref]
- Cui Y, Luan J, Li H, Zhou X, Han J (2016) Exosomes derived from mineralizing osteoblasts promote ST2 cell osteogenic differentiation by alteration of microRNA expression. FEBS Lett 590: 185-192. [Crossref]
- Wang Z, Maruyama K, Sakisaka Y, Suzuki S, Tada H, et al. (2019) Cyclic stretch force induces periodontal ligament cells to secrete exosomes that suppress IL-1β production through the inhibition of the NF-κB signaling pathway in macrophages. Front Immunol 10: 1310. [Crossref]
- Li W, Zhao J, Sun W, Wang H, Pan Y, et al. (2020) Osteocytes promote osteoclastogenesis via autophagy-mediated RANKL secretion under mechanical compressive force. Arch Biochem Biophys 694: 108594. [Crossref]
- Chang M, Chen Q, Wang B, Zhang Z, Han G (2023) Exosomes from tension force-applied periodontal ligament cells promote mesenchymal stem cell recruitment by altering microRNA profiles. Int J Stem Cells 16: 202-214. [Crossref]
- Kitagawa M, Tahara H, Kitagawa S, Oka H, Kudo Y, et al. (2006) Characterization of established cementoblast-like cell lines from human cementum-lining cells in vitro and in vivo. Bone 39: 1035-1042. [Crossref]
- Wada S, Kanzaki H, Narimiya T, Nakamura Y (2017) Novel device for application of continuous mechanical tensile strain to mammalian cells. Biol Open 6: 518-524. [Crossref]
- Krishnan V, Davidovitch ZE (2006) Cellular, molecular, and tissue-level reactions to orthodontic force. Am J Orthod Dentofacial Orthop 129: 469.e1-32. [Crossref]
- Roberts-Harry D, Sandy J (2004) Orthodontics. Part 11: Orthodontic tooth movement. Br Dent J. 196: 391-394. [Crossref]
- Chen Y, Wang X (2020) miRDB: An online database for prediction of functional microRNA targets. Nucleic Acids Res 48: D127-D131. [Crossref]
- Agarwal V, Bell GW, Nam JW, Bartel DP (2015) Predicting effective microRNA target sites in mammalian mRNAs. Elife 4: e05005. [Crossref]
- Huang HY, Lin YC, Li J, Huang KY, Shrestha S, et al. (2020) miRTarBase 2020: Updates to the experimentally validated microRNA–target interaction database. Nucleic Acids Res 48: D148-D154. [Crossref]
- Paraskevopoulou MD, Georgakilas G, Kostoulas N, Vlachos IS, Vergoulis T, et al. (2013) DIANA-microT web server v5. 0: Service integration into miRNA functional analysis workflows. Nucleic Acids Res 41: W169-W173. [Crossref]
- Huang DW, Sherman BT, Lempicki RA (2009) Systematic and integrative analysis of large gene lists using DAVID bioinformatics resources. Nat Protoc 4:44-57. [Crossref]
- Meikle MC (2006) The tissue, cellular, and molecular regulation of orthodontic tooth movement: 100 years after Carl Sandstedt. Eur J Orthod 28: 221-240. [Crossref]
- Zhang Y, Zhang T, Zhang Z, Su J, Wu X, et al. (2022) Periodontal ligament cells derived small extracellular vesicles are involved in orthodontic tooth movement. Eur J Orthod 44: 690-697. [Crossref]
- Zhang X, Zhao Z, Chen Y, Han X, Jie Y (2022) Extracellular vesicles secreted by human periodontal ligament induced osteoclast differentiation by transporting miR-28 to osteoclast precursor cells and further promoted orthodontic tooth movement. Int Imunopharmacol 113: 109388. [Crossref]
- Holliday LS, Truzman E, Zuo J, Han G, Torres‐Medina R, et al. (2019) Extracellular vesicle identification in tooth movement models. Orthod Craniofac Res 22: 101-106. [Crossref]
- Atsawasuwan P, Lazari P, Chen Y, Zhou X, Viana G, et al. (2018) Secretory microRNA-29 expression in gingival crevicular fluid during orthodontic tooth movement. PLoS One 13: e0194238. [Crossref]
- Zhu Y, Li Y, Cao Z, Xue J, Wang X, et al. (2024) Mechanically strained osteocyte-derived exosomes contained miR-3110-5p and miR-3058-3p and promoted osteoblastic differentiation. BioMed Eng OnLine. 23: 44. [Crossref]
- Ma Y, Liu N, Shao X, Shi T, Lin J, et al. (2024) Mechanical loading on osteocytes regulates thermogenesis homeostasis of brown adipose tissue by influencing osteocyte-derived exosomes. J Orthop Translat 48: 39-52. [Crossref]
- Yu L, Ma X, Sun J, Tong J, Shi L, et al. (2017) Fluid shear stress induces osteoblast differentiation and arrests the cell cycle at the G0 phase via the ERK1/2 pathway. Mol Med Rep 16: 8699-8708. [Crossref]
- Chang SF, Chang TK, Peng HH, Yeh YT, Lee DY, et al. (2009) BMP-4 induction of arrest and differentiation of osteoblast-like cells via p21CIP1 and p27KIP1 regulation. Mol Endocrinol 23: 1827-1838. [Crossref]
- Li Y, Yang F, Gao M, Gong R, Jin M, et al. (2019) miR-149-3p regulates the switch between adipogenic and osteogenic differentiation of BMSCs by targeting FTO. Mol Ther Nucleic Acids 17: 590-600. [Crossref]
- Qiu W, Andersen TE, Bollerslev J, Mandrup S, Abdallah BM, et al. (2007) Patients with high bone mass phenotype exhibit enhanced osteoblast differentiation and inhibition of adipogenesis of human mesenchymal stem cells. J Bone Miner Res 22: 1720-1731. [Crossref]
- Diercke K, Kohl A, Lux CJ, Erber R (2011) Strain-dependent up-regulation of ephrin-B2 protein in periodontal ligament fibroblasts contributes to osteogenesis during tooth movement. J Biol Chem 286: 37651-37664. [Crossref]
- Morrell AE, Brown GN, Robinson ST, Sattler RL, Baik AD, et al. (2018) Mechanically induced Ca2+ oscillations in osteocytes release extracellular vesicles and enhance bone formation. Bone Res 6: 6. [Crossref]
- Andreasen JO (1981) Relationship between surface and inflammatory resorption and changes in the pulp after replantation of permanent incisors in monkeys. J Endod 7: 294-301. [Crossref]
- Cherian PP, Siller-Jackson AJ, Gu S, Wang X, Bonewald LF, et al. (2005) Mechanical strain opens connexin 43 hemichannels in osteocytes: A novel mechanism for the release of prostaglandin. Mol Biol Cell 16: 3100-3106. [Crossref]
- Donahue HJ, McLeod KJ, Rubin CT, Andersen J, Grine EA, et al. (1995) Cell‐to‐cell communication in osteoblastic networks: Cell line–dependent hormonal regulation of gap junction function. J Bone Miner Res 10: 881-889. [Crossref]
- Jørgensen NR, Geist ST, Civitelli R, Steinberg TH (1997) ATP-and gap junction–dependent intercellular calcium signaling in osteoblastic cells. J Cell Biol 139: 497-506. [Crossref]
- Pirkmajer S, Chibalin AV (2011) Serum starvation: Caveat emptor. Am J Physiol Cell Physiol 301: C272-C279. [Crossref]
- Aveic S, Craveiro RB, Wolf M, Fischer H (2021) Current trends in in vitro modeling to mimic cellular crosstalk in periodontal tissue. Adv Healthc Mater 10: e2001269. [Crossref]
- Diomede F, Gugliandolo A, Cardelli P, Merciaro I, Ettorre V, et al. (2018) Three-dimensional printed PLA scaffold and human gingival stem cell-derived extracellular vesicles: A new tool for bone defect repair. Stem Cell Res Ther 9: 1-21. [Crossref]
- Qin Y, Wang L, Gao Z, Chen G, Zhang C (2016) Bone marrow stromal/stem cell-derived extracellular vesicles regulate osteoblast activity and differentiation in vitro and promote bone regeneration in vivo. Sci Rep 6: 21961. [Crossref]
- O’Brien K, Breyne K, Ughetto S, Laurent LC, Breakefield XO (2020) RNA delivery by extracellular vesicles in mammalian cells and its applications. Nat Rev Mol Cell Biol 21: 585-606. [Crossref]
- Li H, Yang F, Wang Z, Fu Q, Liang A (2015) MicroRNA-21 promotes osteogenic differentiation by targeting small mothers against decapentaplegic 7. Mol Med Rep 12: 1561-1567. [Crossref]
- Wang Z, Xie Q, Yu Z, Zhou H, Huang Y, et al. (2015) A regulatory loop containing miR-26a, GSK3β and C/EBPα regulates the osteogenesis of human adipose-derived mesenchymal stem cells. Sci Rep 5: 15280. [Crossref]
- Wei F, Li M, Crawford R, Zhou Y, Xiao Y, et al. (2019) Exosome-integrated titanium oxide nanotubes for targeted bone regeneration. Acta biomaterialia 86: 480-492. [Crossref]
- Li W, Liu Y, Zhang P, Tang Y, Zhou M, et al. (2018) Tissue-engineered bone immobilized with human adipose stem cells-derived exosomes promotes bone regeneration. ACS Appl Mater Interfaces 10: 5240-5254. [Crossref]
- Whitford W, Guterstam P (2019) Exosome manufacturing status. Future Med Chem 11: 1225-1236. [Crossref]