This study verified the effects of fish oil n-3 fatty acids on the inflammatory profile, redox state, adhesion molecules and impact on the life quality of patients with psoriasis. Forty patients with chronic plaque psoriasis were randomized to one of two groups: fish oil group (n=20), which received 3g/d of fish oil n-3 fatty acids (10 capsules) and control group (n=20), which maintained their usual diet. Inflammatory biomarkers, nitro-oxidative stress including lipid hydroperoxides (LOOH) in plasma and red blood cells, advanced oxidation protein products (AOPP), nitric oxide metabolites (NOx), sulfhydryl groups and total radical-trapping antioxidant parameter (TRAP) were measured as well as adhesion molecules and plasminogen activator inhibitor type-1; Psoriasis Area Severity Index (PASI) and Dermatology Life Quality Index (DLQI) were also evaluated. All parameters were measured at baseline and after 90 days of supplementation. The group receiving fish oil showed decreased erythrocyte sedimentation rate (ESR) (p=0,007), LOOH in red blood cells (p=0,048), AOPP (p=<0,001) and increased sulfhydryl groups (p=0,001), TRAP (p=0,010) and DLQI. There were not significant results in PASI, adhesion molecules, PAI-1, NOx, and plasma LOOH. Inter-group changes (p<0.05) verified an improvement in the patient’s life quality measured by DLQI, a decrease in AOPP and an increase in SH. The present study indicated that ingestion of capsules of n-3 fish oil fatty acids was able to improve life quality, to reduce inflammatory status, to decrease lipid peroxidation and protein oxidation, and to increase the total antioxidant capacity in patients with psoriasis.
Psoriasis, n-3 fish oil fatty acids, inflammatory status, cell adhesion molecules, oxidative stress
Abbreviations
AA: Arachidonic acid; AOPP: Advanced Oxidation Protein Products; BMI: Body mass index; CL-LOOH: Tert-butyl hydroperoxide-initiated chemiluminescence; CRP: C- reactive protein; DHA: Docosahexaenoic acid; DLQI: Dermatology Quality of Life Index; EPA: Eicosapentaenoic acid; E-selectin: Endothelial selectin; ESR: Erythrocyte sedimentation rate; GPx: Glutathione peroxidase; GSH: Reduced glutathione; ICAM-1: Intercellular cell adhesion molecule 1; IL-6: Interleukin 6; LTB4: Leukotriene B4; MDA: Malonaldehyde; NO2: Nitrites; NO3: Nitrates; NOx: Nitric oxide metabolites; PAI-1: Plasminogen activator inhibitor 1; PASI: Psoriasis Area Severity Index; PECAM-1: Platelet endothelial cell adhesion molecule 1; PGE2: Prostaglandin E2; PPARγ: Peroxisome proliferator-activated receptor γ; P-selectin: Platelet selectin; ROS: Reactive Oxygen Species; SH: Sulfhydryl groups; SOD: Superoxide dismutase; TNF-α: Tumor necrosis factor α; TRAP: Total antioxidant capacity; VCAM-1: Vascular cell adhesion molecule 1; WC: Waist circumference
Psoriasis is an immune-mediated hyperproliferative chronic inflammatory skin disease affecting about 1.3-2.2% of the world population [1]. The interaction among keratinocytes, neutrophils, mast cells, T cells, and dendritic cells is thought to create inflammatory and pro-proliferative circuits mediated by chemokines and cytokines, which induce the development of psoriatic lesions, clinically characterized by sharply demarked, erythematous, and scaly plaques [1]. Although of unknown etiology, psoriasis is likely to be triggered by immunological factors and plaque-type psoriasis represents the most common form of the disease [2].
Reactive oxygen species (ROS) can contribute to the development and/or maintenance of psoriasis at the molecular and cell level [3]. The increased levels of malonaldehyde (MDA) associated with decreasing plasma β-carotene, reduced glutathione (GSH) and α-tocopherol (vitamin E) were found in plasma and erythrocytes of psoriatic patients [4], as well as a decreased erythrocytes antioxidant activity verified by decreasing in catalase, superoxide dismutase (SOD) and glutathione peroxidase (GPx) activities [5,6]. The high level of MDA indicates an advanced peroxidative process in erythrocyte membranes, suggesting that increased peroxidation caused by decreasing in the levels of the antioxidants and antioxidant enzyme activities may be the essential mechanism of the membrane fluidity decrease observed in association with the exacerbation of the disease [4].
In turn, cell adhesion molecules act as signaling molecules and play an essential role in the regulation of inflammation and immune response. In psoriasis, endothelial selectin (E-selectin) and vascular cell adhesion molecule 1 (VCAM-1) present in the endothelium are essential for the initial trafficking of lymphocytes for the dermal and epidermal lesions (adhesion molecules in keratinocytes). According to Veale, et al. [7], the presence of VCAM-1 and intercellular cell adhesion molecule (ICAM-1) in the psoriatic skin suggests that these molecules may be responsible for cell-cell adhesion within the inflammatory lesion.
N-3 polyunsaturated fatty acids act by multiple mechanisms, such as changes in the composition of cell membrane phospholipids [8]. Dietary supplementation with n-3 fatty acids from fish oil results in modification of fatty acid profiles with increasing content of eicosapentaenoic (EPA) and docosahexaenoic (DHA) acids [8]. More precisely, EPA can act as a competitive inhibitor of arachidonic acid (AA) conversion to prostaglandin E2 (PGE2) and leukotrienes B4 (LTB4), which in turn are lesser potent inflammatory mediators than the degradation products of AA [8]. In addition, fish oil n-3 fatty acids reduce agonist-induced activation of nuclear factor-κB and increase peroxisome proliferator-activated receptor γ (PPARγ); decrease inflammatory markers, such as tumor necrosis factor α (TNF-α) and interleukin 6 (IL-6), and reduce vascular cell adhesion molecules [8,9].
The beneficial effects after supplementation with n-3 polyunsaturated fatty acids in psoriasis are still controversial. Some studies have reported improvement in erythema, scaling, infiltration, itching, and area of skin involved [10-13] as well as reduction in inflammatory markers [10,12], whereas others have not found significant reduction in these parameters [14,15].
We are not aware of any study, to date, which has concomitantly evaluated oxidative stress and adhesion cell molecules involvement in patients with psoriasis supplemented with fish oil n-3 fatty acids. Therefore, the aim of the present study was to verify the effects of fish n-3 fatty acids on the inflammatory profile, redox state, adhesion molecules and the impact on the life quality of patients with psoriasis.
Subjects
This study included 44 patients with chronic plaque psoriasis (25 women and 19 men), aged between 24 and 79 years. Patients were selected from among the ambulatory of Dermatology of the University Hospital of Londrina, Paraná, Brazil. They were paired by sex, age, and ethnicity, body mass index (BMI) and waist circumference (WC). Information on lifestyle factors and medical history were obtained at clinical evaluation. None of the participants in the study presented heart, thyroid, renal, hepatic, gastrointestinal, infectious, oncological diseases or other autoimmune disease, and none was receiving estrogen replacement therapy or antioxidant supplements. The subjects of both groups did not drink alcohol regularly. None of the subjects followed a specific diet before the study began and they were instructed by a nutritionist to maintain their usual diets, alcohol intake, level of physical activity, and other lifestyle factors throughout the intervention period.
This study was conducted according to the guidelines laid down in the Declaration of Helsinki and all procedures involving human patients were approved by the Ethical Committee of the University of Londrina Paraná, Brazil. CAAE: 51826215.0.0000.5231. Written informed consent was obtained from all patients.
Patients with psoriasis were assigned to one of two groups after stratification by age, sex, and waist circumference (WC): the first group (control group, n=20) was only directed to maintain their usual diet; the second group (fish oil group, n=24) received 3 g/d of fish oil n-3 fatty acids (10 capsules). Each fish oil capsule contained 180 mg of eicosapentaenoic acid (EPA) and 120 mg of docosahexaenoic acid (DHA) originated from sardines. The capsules were given at breakfast, lunch, and dinner. The subjects were recommended to continue their usual medicines and not rest after meals to avoid unpleasant side effects. Ad Oceanum Indústria e Comércio Ltda manufacturers of pharmaceutical products provided fish oil capsules. Interviews were performed to assure that no change in lifestyle factors had happened throughout the study.
Patients were selected according to the Psoriasis Area Severity Index (PASI) [16] and were classified as with mild (PASI <3) or moderate (PASI 3-10) plaque psoriasis. The quality of life related to skin disease in psoriasis was determined using the Dermatology Quality of Life Index (DLQI) [17]. Evaluation of clinical and laboratorial parameters was assessed at the beginning of the study and after 90 days.
Steps taken to optimize compliance
Various measures were taken to optimize and assess patient compliance. Before each trial began, it was assured that the patients understood that they could be allocated to any group. Boxes of fish oil capsules were handed out at the initial interview and at the two later visits. The participants were asked to return the boxes at each visit so the number of capsules taken could be estimated by questioning the patients and by counting the remaining capsules. In addition, telephone interviews were performed to evaluate if the patients were correctly using the supplements and the patients were recommended to avoid lifestyle changes. Treatment adhesion of the participants of the study was 80%.
Anthropometric and blood pressure measurements
Body weight was measured to the nearest 0.1 kg in the morning by using an electronic scale, with individuals wearing light clothing and no shoes; height was measured to the nearest 0.1 cm by using a stadiometer. Body mass index (BMI) was calculated as weight (kg) divided by height (m) squared. Waist circumference (WC) was measured with a soft tape on standing subjects midway between the lowest rib and the iliac crest. Three blood pressure measurements using a calibrated sphygmomanometer were taken with a 1-min interval after the participant had been seated were recorded on the left arm. The mean of these measurements was used in the analysis.
Biochemical, Immunological and hematological biomarkers
After fasting for 12h, venous blood was withdrawn in Ethylene Diamine Tetra acetic acid (EDTA) and BD Vacutainer ® Ultra Touch™ serum sterile tubes. Whole blood was allowed to stand for 30 min and centrifuged at 1500 rpm for 10 min. Plasma and serum samples were separated and divided into aliquots and then stored at -80°C for subsequent analysis. White blood cell counts and erythrocyte sedimentation rate (ESR) were determined using hematological autoanalyzers; Serum C-reactive protein (CRP) levels were measured using a turbidimetric assay (C8000, ABBOTT, Architect Abbott Laboratories, Abbott Park, IL, USA) and ferritin was measured with chemiluminescence microparticle assay (Architect, Abbott Laboratory, Abbott Park, IL, USA).
Oxidative and Nitrosative stress measurements: Samples for evaluating oxidative stress and total antioxidant capacity were performed with EDTA as anticoagulant and antioxidant. All samples were centrifuged at 3,000 rpm for 15 minutes and plasma aliquots stored at -70ºC until assayed. All nitro-oxidative stress measurements were performed in triplicate. Lipid hydroperoxides in plasma and red blood cells were evaluated by tert-butyl hydroperoxide-initiated chemiluminescence (CL-LOOH), as previously described [18], and the results are expressed in counts per minute (cpm). Determination of Advanced Oxidation Protein Products (AOPP) was performed in the plasma using the semi-automated method [19]. AOPP concentrations were expressed as micromoles per liter (𝜇mol/L) of chloramines-T equivalents. Nitric oxide (NO) concentration in sample was estimated by measuring nitric oxide metabolites nitrites (NO2-) and nitrates (NO3-) using cadmium beads for the reduction of nitrate to nitrite. The concentrations of these metabolites were later determined according to the method proposed by Griess [20]. The values were expressed in µM.
Sulfhydryl groups (SH) of protein were evaluated in plasma by a spectrophotometric assay based on 2,2-dithiobisnitrobenzoic acid (DTNB), as reported previously and the results were expressed in µM [21]. Total antioxidant capacity (TRAP) was determined as reported previously [22]. This method detects hydrosoluble and/or liposoluble plasma antioxidants by measuring the chemiluminescence inhibition time induced by 2,2-azobis(2-amidinopropane). The system was calibrated with vitamin E analog Trolox, and the values of TRAP are expressed in equivalent of 𝜇M Trolox/mg uric acid (UA).
Adhesion Molecules and Plasminogen Activator Inhibitor Type-1(PAI-1): Levels of platelet endothelial cell adhesion molecule (PECAM-1), ICAM-1, VCAM-1, E-selectin, platelet selectin (P-selectin), and plasminogen activator Inhibitor 1 (PAI-1) were determined by Human Magnetic Adhesion 6-Plex Panel (Novex Life Technologies, Frederick, United States of America) for Luminex® platform.
Statistical Analyses
The sample size was statistically estimated for each group considering a statistical power of 80% and the two-sided significance level of p <0.05. The sample size was calculated in order to detect statistical differences of at least 10% in the evaluated parameters. The G*Power 3.1.9.2 program for Windows was used to calculate the sample size, based on mean and standard deviation for some of the parameters previously evaluated in other studies.
Categorical data were analyzed with the chi-square or Fisher's exact test. The Wilcoxon matched pairs test was performed to verify changes from baseline (intra-group changes). Mann-Whitney test was performed to compare baseline values and differences across treatment groups (inter-group changes). Data are expressed as the medians and 25th–75th percentiles. All statistical analyses were performed using IBM SPSS windows version 24. Tests were 2-tailed and an alpha level of 0.05 indicated statistically significant results.
Forty patients completed the study, twenty in the fish oil group and twenty in the control group. Four patients in the fish oil group (3 women and 1 man) did not complete the study due to poor compliance (two), pregnancy or gastrointestinal intolerance.
The demographic and clinical characteristics of the patients at the baseline are shown in Table 1. The groups did not differ in relation to age, sex, ethnicity, tobacco use, physical activity, prevalence of metabolic syndrome, hypertension, and medications (p>0,05).
Table 1. Demographic and clinical characteristics in the control and fish oil groups of patients with psoriasis at the beginning of the study
|
Control (n=20) |
Fish oil (n=20) |
p |
Age (years) |
47.50
(54.50-42.00) |
55.50
(62.50-46.50) |
0.411 |
Sex (F/M) |
9 (45%)/ 11(55%) |
8 (40%)/ 12 (60%) |
0.749 |
Ethnicity (C/NC) |
18 (90%)/ 2(10%) |
17 (85%)/ 3(15%) |
0.633 |
Smoking (yes) |
1 (5%)/ 19 (95%) |
5 (25%)/ 15 (45%) |
0.077 |
Physical activity (yes) |
9 (45%) |
11 (55%) |
0.527 |
MetS (yes) |
10 (50%) |
7 (35%) |
0.337 |
SAH (yes) |
8 (40%) |
5 (25%) |
0.311 |
MTX |
6 (30.00%) |
4 (20.00%) |
0.465 |
Acitretin |
8 (40%) |
5 (25%) |
0.311 |
TNF-inhibitor
Etanercept
Infliximabe
Adalimumabe |
3 (15%)
3 (15%) |
5 (25%)
3 (15%)
1(5%)
1(5%) |
0.429 |
Topic |
10 (50%) |
10 (50%) |
0.752 |
Data are shown in median and inter quartile range (25% -75%) and absolute number (n) and percentage (%). Categorical data were analyzed with the chi-square or Fisher's exact test. Continuous data were analyzed with the Mann Withney test. F/M, female/male; C/NC, caucasian/not caucasian; MetS, metabolic syndrome; SAH, systemic arterial hypertension; MTX, Metrotexate; TNF, tumor necrosis factor.
Of note, no statistically significant changes between the groups were observed in any anthropometric, inflammatory biomarker, cell adhesion molecules or oxidative stress at the baseline (Table 2, Figures 1and 2). Also, there were no significant changes in any parameter in the control group (Table 2, Figures 1 and 2).
Table 2. Evaluation of anthropometric parameters, inflammatory biomarkers, and cell adhesion molecules and PAI-1 at the baseline and after 90 days of supplementation with oil fish oil
|
Controls (n=20) |
|
Fish oil (n=20) |
|
|
|
T0A |
T90 |
p |
T0B |
T90 |
p intra |
pAxB |
BMI (Kg/cm2) |
27.51
(25.53-33.82) |
27.08
(25.26-33.44) |
0.100 |
29.57
(25.85-34.18) |
29.98
(26.36-34.03) |
0.017 |
0.414 |
WC (cm) |
99.00
(91.50-107.50) |
101.00
(91.00-109.50) |
0.130 |
106.50
(95.0-121.0) |
104.50
(100.0-120.0) |
0.983 |
0.068 |
PASI |
4.00
(2.3-5.70) |
3.60
(0.90-5.10) |
0.296 |
2.30
(1.10-4.30) |
2.10
(0.90-5.45) |
0.313 |
0.105 |
DLQI* |
2.00
(1.00-4.50) |
2.00
(1.00-6.00) |
0.380 |
3.00
(0.00-9.00) |
0.00
(0.00-1.00) |
0.017 |
0.478 |
hsCRP (mg/L) |
5.10
(1.30-8.75) |
5.40
(0.90-8.20) |
0.887 |
3.10
(1.60-9.35) |
3.55
(1.50-10.45) |
0.717 |
0.779 |
ESR (mm/H) |
14.00
(6.50-25.00) |
11.50
(3.00-25.50) |
0.111 |
14.50
(7.50-21.00) |
11.00
(4.00-16.00) |
0.007 |
0.799 |
Ferritin (ng/L) |
159.72
(74.21-304.7) |
148.92
(44.3-292.26) |
0.601 |
185.78
(94.44-238.06) |
186.60
(116.72-227.52) |
0.398 |
0.749 |
Leukocytes(cells/uL) |
6.79
(5.84-7.87) |
7.12
(6.14-7.86) |
0.732 |
7.05
(6.09-8.30) |
7.42
(5.50-7.92) |
0.198 |
0.495 |
PECAM-1 (ng/mL) |
18963.75
(15513.37-23076.16) |
16807.53
(12696.85-22680.95) |
0.391 |
18112.52
(14071.63-23993.24) |
19685.46
(17383.12-26602.34) |
0.100 |
0.883 |
ICAM-1 (ng/mL) |
56927.51
(23561.07-216542.11) |
35244.24
(19944.73-95831.81) |
0.135 |
42987.35
(28966.05-309226.68) |
51293.56
(32856.10-241266.89) |
0.478 |
0.925 |
VCAM-1 (ng/mL) |
298282.91
(247148.20-474447.50) |
254460.35
(223160.05-399720.77) |
0.370 |
306558.23
(230484.39-478481.97) |
306233.47
(230950.59-369513.12) |
0.433 |
0.862 |
E-Selectin (ng/mL) |
70097.19
(51192.00-91622.12) |
59417.84
(39285.87-95440.97) |
0.455 |
73990.93
(42351.00-110026.78) |
75842.20
(59738.18-92447.35) |
0.911 |
0.841 |
P-Selectin (ng/mL) |
63890.33
(37556.36-78469.50) |
46007.64
(38916.47-65168.17) |
0.093 |
54013.86
(42601.17-68984.65) |
61307.95
(45654.55-70093.95) |
0.296 |
0.565 |
PAI-1 (ng/mL) |
16012.70
(10044.71-35915.20) |
13387.41
(9499.28-27237.96) |
0.391 |
23073.85
(12840.77-41083.30) |
32321.21
(22982.87-42211.95) |
0.086 |
0.369 |
Data are shown in median and interquartile range (25% -75%). The Wilcoxon test was performed to verify changes from baseline (intra-group changes). The Mann-Whitney test was performed to compare differences between the baseline values and across treatment groups (inter-group changes). BMI, Body Mass Index; WC, Waist Circumference; PASI, Psoriasis Area Severity Index; DLQI, Dermatology Life Quality Index; hsCRP, high sensitive C reactive protein; ESR, erythrocyte sedimentation rate; PECAM-1, Platelet Endothelial Cell Adhesion Molecule;ICAM-1, Intercellular Cell Adhesion molecule; VCAM-1, Vascular Cell Adhesion Molecule 1; E-selectin, endothelial selectin; P-selectin, platelet selectin; PAI-1, Plasminogen Activator Inhibitor 1. Intra – intra-group changes; AxB – differences between baselines; *Inter – inter-group changes p< 0.05.
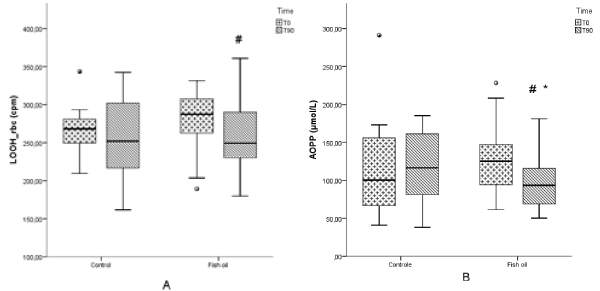
Figure 1. Red blood cells lipid hydroperoxide (LOOH) (a) and advanced oxidation protein products (AOPP) (b) in patients with psoriasis submitted or not to treatment with n-3 fish oil fatty acids for 90 days. Control T0, control group at the beginning of the study; Control T90, control group after 90 days; Fish oil T0, group at the beginning of the study; Fish oil T90, fish oil group after 90 days. # p < 0.05, Fish oil T0 vs. Fish oil T90; * p < 0.05, inter-group changes.
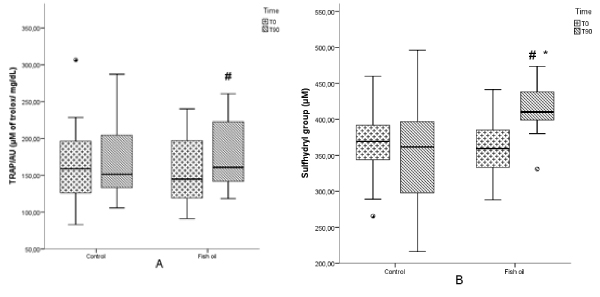
Figure 2. Total radical-trapping antioxidant parameter (TRAP) and sulfhydryl group (SH) in patients with psoriasis submitted or not to treatment with n-3 fish oil fatty acids for 90 days. Control T0, control group at the beginning of the study; Control T90, control group after 90 days; Fish oil T0, group at the beginning of the study; Fish oil T90, fish oil group after 90 days. # p < 0.05, Fish oil T0 vs. Fish oil T90; * p < 0.05, inter-group changes.
With regard to anthropometry, there was no significant difference between the groups after 90 days in WC, however there was an increase in BMI (p=0.017) in the fish oil group (Table 2). The PASI did not change significantly in the fish oil supplementation group, although an improvement in the patient’s life quality measured by DLQI (p=0.017) was observed in this group. Also, a decrease in ESR (p=0.007) was verified in the fish oil group, whereas no significant differences in hsCRP, ferritin and leucocytes were found. There were no significant differences in the cell adhesion molecules (PECAM-1, ICAM-1, VCAM-1, E-selectin, and P-selectin) and in PAI-1 (Table 2).
In relation to oxidative stress parameters, the fish oil group had a significant decrease in CL-LOOH measured in erythrocytes (p=0.048) (Figure 1a) and AOPP (p=<0.001) levels (Figure 1b), whereas an increase in TRAP/UA (p=0.01) (Figure 2a) and SH (p=0.001) (Figure 2b) was also verified in this group. Plasmatic CL-LOOH and NOx did not change significantly (data not shown).
Inter-group changes (p<0.05) verified an improvement in the patient’s life quality measured by DLQI (Table 2), a decrease in AOPP (Figure 1b) and an increase in SH (Figure 2b).
The main finding of this study was that fish oil n-3 fatty acids was able to decrease the oxidative stress and increase antioxidant capacity in patients with psoriasis after 3 months of supplementation. In addition, the patients showed an improvement in life quality and a reduction of the inflammatory process. In this study, the patients of both groups can be considered overweight, a condition that in some circumstances, such as the presence of metabolic syndrome, can increase oxidative stress [23]. Nevertheless, even the weight gain which occurred in the fish oil group was not able to interfere in the beneficial effects verified in this group.
Similarly to the findings of the present study, Balbás, et al. [24] showed an improvement in life quality measured by DLQI in psoriasis patients with fish oil supplementation. However, after 3 months of treatment, there was not significant differences in PASI decrease in the fish oil group, similarly to the result verified by Soyland, et al. [25], where sixty-two plaque psoriasis patients received 6 gr of fish n-3 fatty acids for 4 months. Nevertheless, several studies presented an improvement of the PASI after oral treatment [13] and fish oil infusion [12,26].
Besides significant inflammation in the skin, patients with psoriasis have a subclinical inflammation in the liver, joints, tendons and vascular tree, thus psoriasis is characterized as a systemic, chronic inflammatory disease [27]. ESR has been accepted as a measure of systemic inflammation, for clinical monitoring, following the course of disease over time, and predicting treatment response/duration [28]. Unlike other reports, which did not find significant results using fish oil in any inflammatory biomarker [14,25,29] the data of the current study showed a decrease in ESR.
The expression of the adhesion molecules is increased in keratinocytes and blood vessels of patients with psoriasis [30,31]. In the current study, there was no significant change in the expression of the adhesion molecules what may be due to the low disease activity found in the patients. Some other studies have also shown that there was no change in the expression of the molecules in the patients with plaques psoriasis with a PASI< 10, since the severity of the disease is directly related to expression of adhesion molecules [31,32].
Our results showed a significantly reduction of lipid and protein oxidation and an increase in antioxidant defenses in the intervention group when compared with the control group. An increase in lipid peroxidation in plasma and erythrocyte [6,33,34] and a decrease in the total antioxidant capacity [33] and erythrocyte antioxidants defenses as GSHx, catalase, GPx and SOD [6,33,34] have been reported in patients with psoriasis. Although NOx level has not shown any significant difference in this study, its increase has been reported in psoriasis [34].
Contradictory results on the effects of the consumption of EPA and DHA on lipid oxidation can be found in the literature. Corrocher, et al. [35] observed that fish oil enhanced EPA and DHA and decreased AA in the erythrocyte membrane lipids in the psoriasis patients. As a consequence, there was a decrease of lipid oxidation (MDA) and an increase of antioxidant capacity erythrocyte (GSH-Px). The current study showed a decrease in CL-LOOH in erythrocytes, but not in plasma; the erythrocyte evaluation takes into account lipoperoxidation in cellular membranes and thus proportionates a better view cellular behavior in oxidative stress, and especially in patients submitted to fish oil intervention than plasma lioperoxidation [36]. On the other hand, Wander & Du [36] showed increased concentration of MDA after supplementation in healthy postmenopausal women.
Although n-3 fatty acids are highly susceptible to free radical attack due to the number of double bonds in a polyunsaturated fatty acid, oxidizing easier than the other less unsaturated fatty acids, and thus increasing oxidative stress [37] we observed that the dietary supplementation with omega-3 fatty acids enhanced resistance against free radical injury, that is, reduced lipid peroxidation and increased the antioxidant capacity of the organism. This phenomenon has already been reported by our group in other inflammatory condition, such as ulcerative colitis [38]. Therefore, it is feasible to suggest that omega-3 fatty acids may act as free radical scavengers protecting the patients against the overall effect of oxidative stress in patients with immunoinflammatory diseases.
The patients with psoriasis in the current study have low disease activity shown by PASI, and therefore, our findings may not be applicable to patients with severe active disease, what can be considered a limitation of the study. Another limitation is the absence of a placebo control group, although a similar design has been previously used in other studies [24,35]. On the other hand, as far as we know, no other study to date has concomitantly evaluated the adhesion molecules, oxidative stress and inflammatory biomarkers in patients with plaques psoriasis supplemented with fish oil.
In conclusion, ingestion of capsules of n-3 fish oil fatty acids was able to improve the life quality of psoriasis patients, to reduce inflammatory status, to decrease lipid peroxidation and protein oxidation, and increase the total antioxidant capacity of patients with psoriasis.
The study was supported by grants from the Coordination for the Improvement of Higher Level of Education (CAPES) of Brazilian Ministry of Education; Institutional Program for Scientific Initiation Scholarship (PIBIC) of the National Council for Scientific and Technological Development (CNPq). We thank the University Hospital of State University of Londrina for technical support.
The authors have declared no conflicts of interest.
None
NLM was responsible for recruiting the patients, interpretation of the results and the writing of the manuscript. LFRFS, DFA, TF and MABL were responsible for the laboratorial analysis; LMMM, JPK, CPL and PST were responsible for recruiting the patients, medical assistance, and interpretation of the results; ANCS and ID were responsible for the original concept of the study, the study design, interpretation of the results and the writing of the manuscript. All authors read and approved the final manuscript.
- Chiricozzi A, Romanelli P, Volpe E, Borsellino G, Romanelli M (2018) Scanning the Immunopathogenesis of Psoriasis. Int J Mol Sci 19. [Crossref]
- Zhou Q, Mrowietz U, Rostami-Yazdi M (2009) Oxidative stress in the pathogenesis of psoriasis. Free Radic Biol Med 47: 891-905. [Crossref]
- Trouba KJ, Hamadeh HK, Amin RP, Germolec DR (2006) Oxidative Stress and Its Role in Skin Disease. Antioxid Redox Signal 52: 78-89.
- Briganti S, Picardo M (2003) Antioxidant activity, lipid peroxidation and skin diseases. What's new. J Eur Acad Dermatol Venereol 17: 663-669. [Crossref]
- Drewa G, Krzyzynska-Malinowska E, Wozniak A, Protas-Drozd F, Mila-Kierzenkowska C, et al. (2002) Activity of superoxide dismutase and catalase and the level of lipid peroxidation products reactive with TBA in patients with psoriasis. Med Sci Monit 8: 338-343.
- Kökçam I, Naziroğlu M (1999) Antioxidants and lipid peroxidation status in the blood of patients with psoriasis. Clin Chim Acta 289: 23-31. [Crossref]
- Veale D, Rogers S, Fitzgerald O (1995) Immunolocalization of adhesion molecules in psoriatic arthritis, psoriatic and normal skin. Br J Dermatol 132: 32-38. [Crossref]
- Calder PC (2012) Mechanisms of action of (n-3) fatty acids. J Nutr 142: 592S-599S. [Crossref]
- Deckelbaum RJ, Leaf A, Mozaffarian D, Jacobson T, Harris WS, et al. (2008) Conclusions and recommendations from the symposium, Beyond Cholesterol: Prevention and Treatment of Coronary Heart Disease with n-3 Fatty Acids. Am J Clin Nutr 87: 2010S–2012S.
- Grimminger F, Mayser P, Papavassilis C, Thomas M, Schlotzer E, et al. (1993) A double-blind, randomized, placebo-controlled trial of n-3 fatty acid based lipid infusion in acute, extended guttate psoriasis. Clin Investig 71: 634-643.
- Guida B, Napoleone A, Trio R, Nastasi A, Balato N, et al. (2014) Energy-restricted, n-3 polyunsaturated fatty acids-rich diet improves the clinical response to immuno-modulating drugs in obese patients with plaque-type psoriasis: A randomized control clinical trial. Clin Nutr 33: 399-405.
- Mayser P, Mrowietz U, Arenberger P, Bartak P, Buchvald J, et al. (1998) 3 Fatty acid–based lipid infusion in patients with chronic plaque psoriasis: Results of a double-blind, randomized, placebo-controlled, multicenter trial. J Am Acad Dermatol 38: 539–547.
- Adil M, Singh PK, Maheshwari K (2017) Clinical evaluation of omega-3 fatty acids in psoriasis. Przegl Dermatol 104: 314-23.
- Bjørneboe A, Smith AK, Bjørneboe GE, Thune PO, Drevon CA (1988) Effect of dietary supplementation with n-3 fatty acids on clinical manifestations of psoriasis. Br J Dermatol 118: 77-83. [Crossref]
- Gupta AK, Ellis CN, Goldfarb MT, Hamilton TA, Voorhees JJ (1990) The role of fish oil in psoriasis: A randomized, double-blind, placebo- controlled study to evaluate the effect of fish oil and topical corticosteroid therapy in psoriasis. Int J Dermatol 29: 591-595.
- Fredriksson T, Pettersson U (1978) Severe psoriasis--oral therapy with a new retinoid. Dermatologica 157: 238-244. [Crossref]
- Finlay AY, Khan GK (1994) Dermatology Life Quality Index (DLQI)--a simple practical measure for routine clinical use. Clin Exp Dermatol 19: 210-216. [Crossref]
- Gonzalez Flecha B, Llesuy S, Boveris A (1991) Hydroperoxide-initiated chemiluminescence: An assay for oxidative stress in biopsies of heart, liver, and muscle. Free Radic Biol Med 10: 93-100.
- Witko-Sarsat V, Friedlander M (1996) Advanced oxidation protein products as a novel marker of oxidative stress in uremia. Kidney Int 49: 1304-1313.
- Navarro-Gonzálvez JA, García-Benayas C, Arenas J (1998) Semiautomated measurement of nitrate in biological fluids. Clin Chem 44: 679-681.
- Hu ML (1994) Measurement of protein thiol groups and glutathione in plasma. Methods Enzymol 233: 380-385.
- Repetto M, Reides C, Gomez Carretero ML, Costa M, Griemberg G, et al. (1996) Oxidative stress in blood of HIV infected patients. Clin Chim Acta 255: 107-117. [Crossref]
- Venturini D, Simão ANC, Scripes NA, Bahls LD, Melo PAS, et al. (2012) Evaluation of oxidative stress in overweight subjects with or without metabolic syndrome. Obesity 20: 2361-2366.
- Balbás G, Regaña M, Millet P (2011) Study on the use of omega-3 fatty acids as a therapeutic supplement in treatment of psoriasis. Clin Cosmet Investig Dermatol 4: 73-77.
- Søyland E, Funk J, Rajka G, Sandberg M, Thune P, et al. (1993) Effect of dietary supplementation with very-long-chain n-3 fatty acids in patients with psoriasis. N Engl J Med 328: 1812-1816. [Crossref]
- Mayser P, Grimm H, Grimminger F (2002) n-3 fatty acids in psoriasis. Br J Nutr 87 Suppl 1: S77-82. [Crossref]
- Mehta NN (2011) Systemic and Vascular Inflammation in Patients With Moderate to Severe Psoriasis as Measured by [18F]-Fluorodeoxyglucose Positron Emission Tomography –Computed Tomography (FDG-PET/CT). Arch Dermatol 147: 1031.
- Bray C, Bell LN, Liang H, Haykal R, Kaiksow F, et al. (2016) Erythrocyte Sedimentation Rate and C-reactive Protein Measurements and Their Relevance in Clinical Medicine. Wisconsin Med Soc 115: 317-321.
- Veale DJ, Torley HL, Richards LM, O’Dowd A, Fttzsimons C, et al. (1994) A double-blind placebo controlled trial of efamol marine on skin and joint symptoms of psoriatic arthritis. Br J Rheumatol 33: 954-958.
- Torres-Álvarez B, Castanedo-Cazares J, Fuentes-Ahumada C, Moncada B (2007) The effect of methotrexate on the expression of cell adhesion molecules and activation molecule CD69 in psoriasis. J Eur Acad Dermatology Venereol 21: 334-339.
- Bressan AL, Picciani BLS, Azulay-Abulafi L, Fausto-Silva AK, Almeida PN, et al. (2018) Evaluation of ICAM-1 expression and vascular changes in the skin of patients with plaque, pustular, and erythrodermic psoriasis. Int J Dermatol 57: 209-216.
- Elias AN, Goodman MM, Rohan MK (1993) Serum ICAM-1 concentrations in patients with psoriasis treated with antithyroid thioureylenes. Clin Exp Dermatol 18: 526-529. [Crossref]
- Rocha-Pereira P, Santos-Silva A, Rebelo I, Figneiredo A, Quintanilha A, et al. (2004) Erythrocyte damage in mild and severe psoriasis. Br J Dermatol 150: 232-244. [Crossref]
- Kadam DP, Suryakar AN, Ankush RD, Kadam CY, Deshpande KH (2010) Role of oxidative stress in various stages of psoriasis. Indian J Clin Biochem 25: 388-392. [Crossref]
- Corrocher R, Ferrari S, de Gironcoli M, Bassi A, Olivieri O, et al. (1989) Effect of fish oil supplementation on erythrocyte lipid pattern, malondialdehyde production and glutathione-peroxidase activity in psoriasis. Clin Chim Acta 179: 121-131.
- Simão ANC, Suzukawa AA, Casado MF, Oliveira RD, F Guarnier FA, et al. (2006) Genistein abrogates pre-hemolytic and oxidative stress damage induced by 2,2V-Azobis (Amidinopropane). Life Sci 78: 1202-1210.
- Wander RC, Du S-H (2000) Oxidation of plasma proteins is not increased after supplementation with eicosapentaenoic and docosahexaenoic acids. Am J Clin Nutr 72:731-737.
- Barbosa DS, Cecchini R, El Kadri MZ, Rodríguez MAM, Burini RC, et al. (2003) Decreased oxidative stress in patients with ulcerative colitis supplemented with fish oil? -3 fatty acids. Nutrition 19: 837-842.