In this study, nano graphene oxide magnetite (Nano-GO/M) composite was prepared and characterized under laboratory conditions with FTIR and SEM analysis to investigate the metabolites of ciprofloxacin (CIP) and ofloxacin (OFL) antibiotics formed during photooxidation under sunlight. Two different metabolites of CIP and OFL namely desenthylenciprofloxacin (M1) and oxociprofloxacin (M3); and 9-piperazino ofloxacin (POF) and des-methyl ofloxacin (MOF) were in HPLC. For maximum removal efficiency (80%) of 1 mg/L initial CIP concentration, 250 min irradiation time were obtained as optimum time for photo-oxidation via sunlight irradiation at 80 W power in august at hours between 10.00 am and 17.00 pm (for 24 hours experiments, we keep going at these hours for 4.5 days). Best results were obtained at 1 mg/L initial concentration of CIP, at original pH of CIP solutions (6.5) and at 2 g/L Nano-GO/M concentration. For maximum OFL removal (82%) the optimum Nano-GO/M concentration was found to be 2 g/L at 1 mg/L OFL concentration, at pH 6.5, after 350 min irradiation time, at 35°C ± 5°C. Final concentrations of M1, M3, POF and MOF metabolites were found as 0.425, 0.125, 0.098 and 0.075 mg/L, respectively.
ciprofloxacin, ofloxacin, photo-oxidation, by-product, sunlight
Antibiotics are commonly utilized for treatment and prevention of deadly infections in humans and animals [1]. Fluoroquinolones antibiotics (FQs) are one type of the most important synthetic antibiotics that are widely employed to treat infections [2]. Ciprofloxacin (CIP), ofloxacin (OFL), moxifloxacin (MOX), and norfloxacin (NOR), are the antibacterial synthetic drugs, belonging to fluoroquinolones group [3]. They usually used to treat infections due to their potent antibacterial activity against gram-positive and gram-negative bacteria. Since the inefficient removal in the industrial and domestic wastewater treatment plants, FQs have been a frequently detected category of antibiotics in natural waters and wastewaters around the world, with concentrations ranging from ng/L to mg/L [4]. FQs in aquatic ecosystems could induce transcriptional changes in microbial communities, thus contributing to the development of resistant bacteria and genes [4]. FQs may also cause the physiological teratogenesis of plants/algae and be genotoxic/carcinogenic for organisms. Unfortunately, FQs are only weakly biodegradable [5]. As a consequence, the application of complementary processes able to efficiently eliminate antibiotics from water is urgently required [1]. So far, many different treatment technologies, such as adsorption [6–8], biodegradation [9,10] and mainly chemical oxidation [2,11-15] have been applied in FQ removal. Among these approaches, chemical oxidation by means of a catalyst is a crucial subject for removal of complex compounds. Therefore, it is necessary to develop efficient catalyst for FQ removal.
Advanced oxidation processes (AOPs) are used to oxidize complex compounds in wastewater which are not degrading biologically. AOP benefit from the reactions of highly reactive hydroxyl radicals (•OH) that are produced in various ways, depending on the technique applied [16]. Nowadays, AOPs have been developed to remove FQs from wastewater [4,12,17,18]. Photocatalytic oxidation is a type of AOP. Serpone and Emiline [19], defined that photocatalysis, in its most simplistic description, is the acceleration of a photoreaction by action of a catalyst. Among the AOPs, heterogeneous photocatalysis has attracted attention as a promising technique for solving environmental problems especially in the degradation of organic pollutants in water treatment [20]. Furthermore, in photo driven AOPs, energy costs can be saved by using sunlight.
Graphene is two-dimensional (2D) sheets of carbon atoms arranged in a honeycombed network and gained much attention in last fifteen years. Owing to their chemical, physical, and mechanical properties, such as large special surface area, excellent electrical and thermal conductivity, high mechanical strength, flexibility, high surface to volume ratio and efficient wide range of light adsorption, graphene-based materials are popular in a broad range of applications [21,22]. Graphene oxide (GO), originated from sheets of GO. There is a lot of oxygen-containing functional groups on GO nanosheets such as epoxy (C–O–C), hydroxyl (OH) and carboxyl (COOH) [23]. The oxygen containing groups on the GO nanosheets makes it easy to functionalize them. Iron oxide nanoparticles have received great interest in different applications due to their superior magnetic properties. Fe3O4, one of the iron oxides, has an inverse spinel structure where all the Fe2+ ions are located in the octahedral spaces and Fe3+ ions are located in the tetrahedral and octahedral spaces [24]. Being magnetic, abundant, biocompatible, and almost semiconductor, magnetite has received great attention in various fields especially in photocatalytic removal of organic pollutants [25]. Magnetic Fe3O4 has the advantage for the usage as support material of composite nano graphene oxide (Nano-GO/M) composite because it can be easily separated by an external magnetic field [26]. Iron oxide nanomaterials composited with GO as magnetic adsorbents were useful and do not need extra filtration or centrifugation.
Yoon et al. [27] studied arsenic removal using Fe3O4–graphene oxide composite (M-GO) and Fe3O4-reduced graphene oxide composite (M-rGO). The M-GO was obtained more effective to adsorb both As(III) and As(V) than M-rGO, because the more functional groups existing on the M-GO. The adsorption capacity of M-GO and M- rGO for As(III) and As(V) were 85 mg/g (M-GO for As(III)), 38 mg/g (M-GO for As(V)), 57 mg/g (M-rGO for As(III)), and 12 mg/g (M- rGO for As(V)). Kinetic results indicated that the adsorption process could be defined by the pseudo-second-order kinetic model under the selected arsenic concentration range (1 mg/L, 0.3 mg/L and 0.15 mg/L), and the adsorption isotherm was fitted well to Freundlich model. Dong et al. [26], recently reported a study about removal of two pollutants namely levofloxacin (LEV) and lead (Pb) by using GO. 10 mL GO suspension (40 mg/L) was used as the adsorbent. 10 mL of LEV or Pb solutions of seven different concentrations (LEV: 1, 2, 5, 10, 20, 30, and 40 mg/L; and Pb: 1, 2, 5, 10, 20, 40, and 60 mg/L) were used for sorption experiments for 24 h retention time at 25°C. GO showed strong affinity for LEV and Pb in aqueous solutions with Langmuir maximum adsorption capacities of 256.6 and 227.2 mg/g, respectively. Liu et al. [28], reported the use of graphene as an adsorbent for removal of methylene blue (MB) from its aqueous solution. The dye uptake capacity increased from 153.5 mg/g to 204.08 mg/g with the rise in temperature from 293 K to 333 K while the maximum dye removal (~ 99.68%) was observed at pH 10.0. Adsorption equilibrium data fitted well to the Langmuir isotherm model than the Freundlich model. Tayyebi et al. [29], studied the removal of Sr2+ and Co2+ ions (50 mg/L initial concentration) by using magnetic GO (M-GO). 20 mg of adsorbent was added to vessels which contained 1000 mL of Co2+ or Sr2+ solution at pH 6.5. M–GO is saturated at the loading of 0.28 and 0.56 meq/g of Sr2+ and Co2+ ions, respectively. Adsorption isotherms of Sr2+ and Co2+ ions, which were fitted by Langmuir monolayer model.
The objective of this study was i) to synthesize a novel nano particle, ii) to obtain the optimum operational conditions for maximum removal yields of CIP and OFL iii) and to evaluate the formation of by-products of CIP (M1 and M3) and OFL (POF and MOF) during photocatalytic decomposition under sunlight with Nano-GO/M.
Quartz glass reactors for the photocatalytic treatment under sunlight
In sunlight studies, quartz glass reactors coated with teflon were used for photocatalytic experiments. Experiments were carried out at different retention times of the day (30, 120, 250, 350 min and 24 h) and different initial concentration of CIP and OFL and the reactors were placed at an angle of 90 degrees to the sun at hours 08.00-17.00. The pH of the reaction mixture was adjusted from 4 to 6.5 and 10 using 1 mol/L of H2SO4 and NaOH solutions. The effects of 0.5 g/L, 2 g/L, 3.5 g/L, 5 g/L and 10 g/L Nano-GO/M composite concentrations on the removals of CIP and OFL with constant sunlight time (250 min for CIP removal, 350 min for OFL removal were chosen due to preliminary studies results) at original pH of CIP and OFL solution (pH=6.5) under sunlight irradiation with a power of 80 W at outdoor temperature (35°C ± 5°C).
Synthesis of nano-GO/M composite under laboratory conditions
GO was synthesized using modified Hummer’s method that involved both oxidation and exfoliation of graphene. In a typical synthesis, 5 g purchased graphene was dispersed in 120 ml H2SO4 by adding 2.5 g of NaNO3 in glass flasks coated by teflon on a magnetic stirrer for 30 min placed in a water bath at a temperature of 18°C by the procedure given by Nengsheng et al. [30]. After stirring the mixture mentioned above at a rpm of 5000; 15 g of KMnO4 was added gradually, and continued to stir the last mixture overnight, continuously at 18°C. Then, 150 ml H2O was slowly added and continued to mix a day at 98°C. Finally, 50 mL of 30% H2O2 was added to the final mixture. The mixture was washed with 5% HCl and deionized water for several times and then, centrifuged and dried under vacuum for purification the GO which was obtained in a solid phase. The Fe3O4 nano particles were dispersed in 25 mL water and added to 50 mL GO aqueous solution. This mixture contained 1 mg Fe+3 /1mL GO and it was stirred at 60°C through 1 h. The nano-composite was collected by using a magnet from the outside of the glass reactor and washed with water three times [30].
HPLC Equipment Specifications: A HPLC Degasser (Agilent 1100), a HPLC Pump (Agilent 1100), a HPLC Auto-Sampler (Agilent 1100), a HPLC Column Oven (Agilent 1100) and a HPLC Diode-Array-Detector (DAD) (Agilent 1100) were used. Figure 1 and 2 shows the molecular structure of CIP and OFL and their metabolites, respectively.

Figure 1. Molecular structures of CIP and its metabolites namely M1 (desenthylenciprofloxacin) and M3 (oxociprofloxacin)

Figure 2. Molecular structures of OFL and its metabolites namely POF (9-piperazino ofloxacin) and MOF (des-methyl ofloxacin)
For quantification, an external standard method was utilized. Peak areas from the HPLC chromatogram were plotted against to the known concentrations of stock solutions at varying concentrations. Equations generated by linear regression were used to establish concentrations for CIP and OFL standard solutions.
Standard solutions and calibration curves for CIP and its metabolites
Mean areas generated from the standard solutions were plotted against concentration to establish calibration equations. CIP, M1 (desenthylenciprofloxacin) and M3 (oxociprofloxacin) peaks were seen at 7.342, 6.51 and 8.49 min (Figure 3–5). The mobile phase consisted of KH2PO4 in aqueous solution and Acetonitrile (95:5, v/v). The flow rate was set at 1.5 mL/min and injection volume at 20 μL. C18 column was used for the analysis.
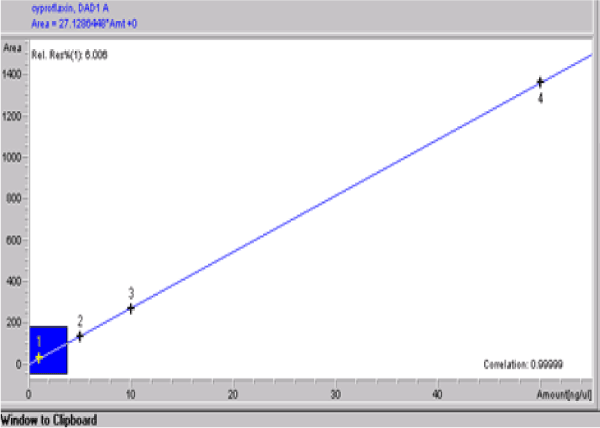
Figure 3. Calibration graph of CIP
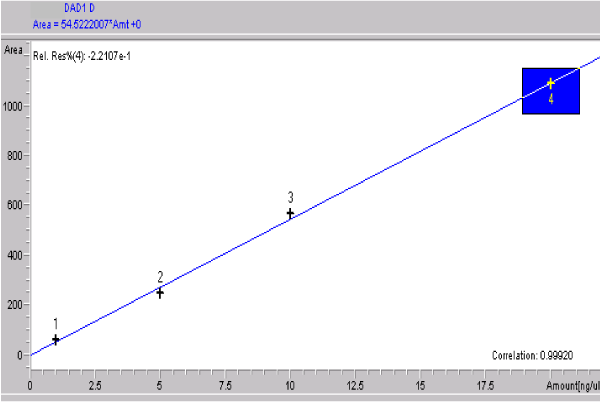
Figure 4. Calibration graph of M1 (desenthylenciprofloxacin)
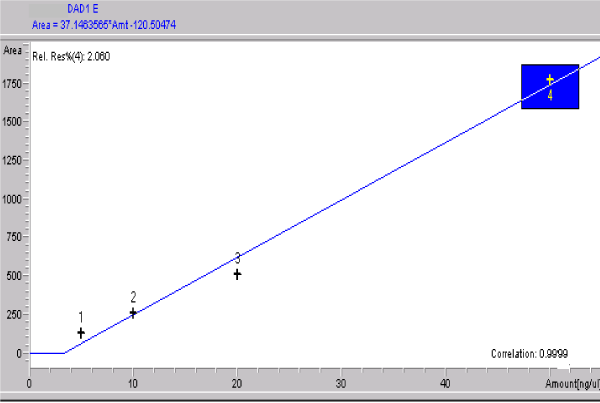
Figure 5. Calibration graph of M3 (oxociprofloxacin)
Standard solutions and calibration curves for OFL and its metabolites
The mobile phase consisted of acetonitrile (18:82, v/v). The aqueous component of the mobile phase was prepared using ammonium acetate and potassium perchlorate by ultrasonic treatment. The column was equilibrated to stable baseline at a flow rate of 1.0 mL min−1, maintaining the temperature of the column at 45 °C. Detection was at 294 nm [31]. OFL, POF (9-piperazino ofloxacin) and MOF (des-methyl ofloxacin) metabolites peaks were seen at 10.01, 7.99 and 9.68 min (Figure 6–8).
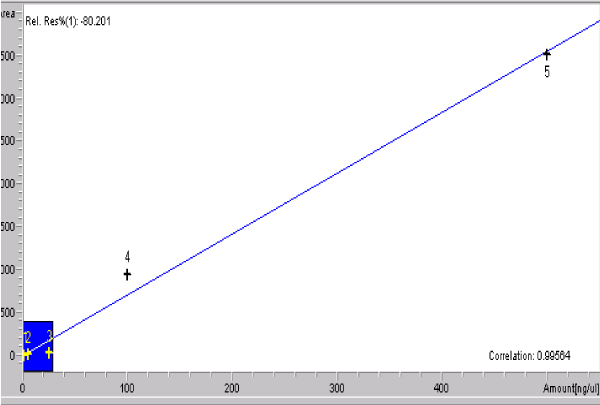
Figure 6. Calibration graph of OFL
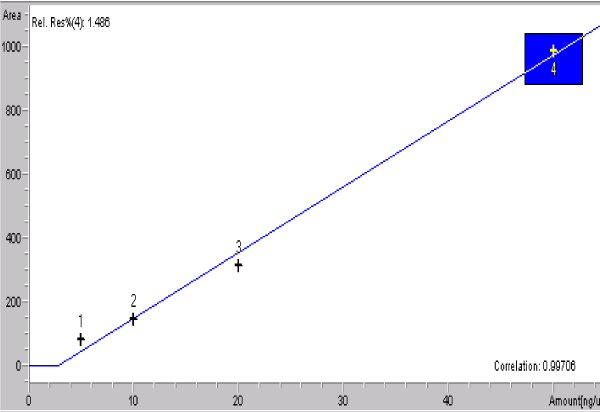
Figure 7. Calibration graph of POF (9-piperazino ofloxacin)
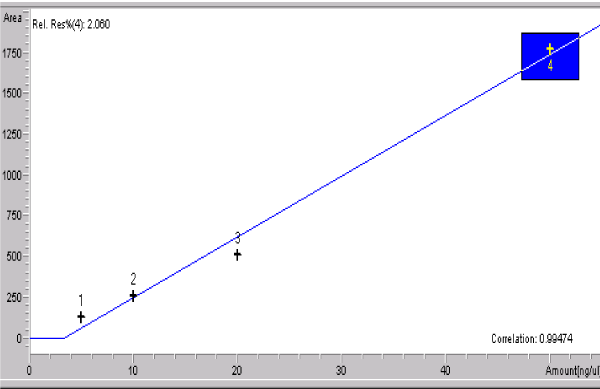
Figure 8. Calibration graph of MOF (des-methyl ofloxacin)
Fourier transform infrared (FT-IR)
FT- IR spectra’s of Nano-GO/M after different conditions applied were measured with the Perkin Elmer FTIR System Spectrum BX with the KBr method for photocatalytic processes.
SEM
The morphological and structural observation was made on a scanning electron microscope VegaII/LMU (Tescan, Czech Republic) for photocatalytic processes.
Physicochemical properties of nano-GO/M
FTIR analysis of nano-GO/M
The produced nano-composite was characterized using Fourier transform infrared spectroscopy (FTIR). In the spectrum of Nano-GO/M, the peaks at 2359, 1568 cm−1 are the characteristics spectrum of benzene ring of Nano-GO/M while the peak at 1073 cm−1 is the characteristic spectrum of the C–OH rings of Nano-GO/M (Figure 9). This confirms the presence of graphene oxide peak at 600 cm−1 which is the characteristics of Fe3O4 giving an evidence of the successful preparation of the Nano-GO/M as reported by Huamin et al. [32].
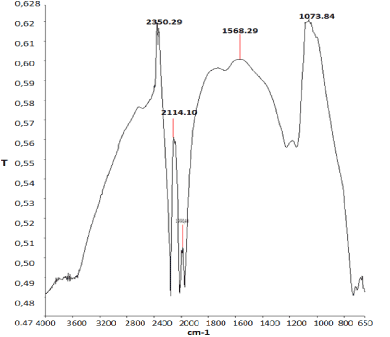
Figure 9. FTIR analysis of the synthesized Nano-GO/M composite
SEM Analysis of Nano-GO/M
The SEM images of synthesized GO, Fe3O4 nanoparticles and Nano-GO/M were given in figure 10,11 and 12. While GO structure was seen in a sheet form, Fe3O4 nanoparticles seen as small dots on the GO sheets (Figure 10). The anchored spherical clusters of magnetite nanoparticles on the wrinkled and layered GO platelets can be observed in the micrographs (Figure 11) [25]. Fe3O4 and GO were dispersed densely and evenly on the surface of the Nano-GO/M composites and they had a core shell structure (Figure 12).
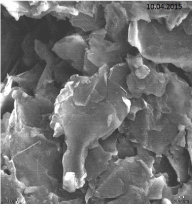
Figure 10. SEM imagine of synthesized GO (1 µm)
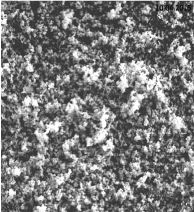
Figure 11. SEM imagine of Fe3O4 (500 nm)
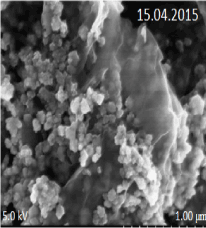
Figure 12. SEM image of raw Nano-GO/M
Determination of optimum operational conditions for the maximum removal yields of CIP and OFL
Effects of concentration of nano-GO/M composite on the treatment of CIP and OFL under sunlight
Effects of 0.5 g/L, 2 g/L, 3.5 g/L, 5 g/L and 10 g/L Nano-GO/M composite concentrations on the removals of CIP and OFL were studied with constant sunlight time (for CIP: 250 min, for OFL: 350 min was chosen due to preliminary studies results) at original pH of CIP and OFL solution (pH=6.5) under sunlight irradiation with a power of 80 W at outdoor temperature (35°C ± 5°C). Figure 13 summarizes the effects of increasing Nano-GO/M concentrations (0,5, 2, 3.5, 5 and 10g/L) on CIP removal yields at a CIP concentration of 1 mg/L after 250 min irradiation time at pH = 6.5 and at 35°C ± 5°C and with a power of 80 W sunlight. The effect of Nano-GO/M concentration on the degradation efficiency of CIP was investigated over the concentration range from 0.5 to 10 g/L. A significant increase is observed in the efficiency of degradation of CIP within the range of Nano-GO/M concentration from 0.5 to 3.5 g/L. As the concentration of Nano-GO/M was increased from 0.5 g/L to 2 g/L and to 3.5 g/L, the CIP removal efficiency increased from 49% to 80% and to 82% for initial CIP concentration of 1 mg/L (Figure 13). The number of available adsorption and Nano-GO/M sites on the Nano-GO/M surface increases with increasing in Nano-GO/M concentration, resulting in the observed enhancement in degradation efficiency [33]. However, a further increase in Nano-GO/M (from 3.5 to 10 g/L) concentration also reduces the removal efficiency of CIP antibiotic. Because, further increases in Nano-GO/M catalyst loading led to an evident decrease of degradation efficiency due to the excess catalyst acts as scatter or reflects photons to hinder the excitation of the photocatalyst. Moreover, with increasing quantities of photocatalyst, the population of active sites was found to be reduced due to the aggregation of photocatalyst particles [2]. As a result, the optimum Nano-GO/M concentration was chosen as 2 g/L to reduce the operational cost of photocatalytic removal of CIP.
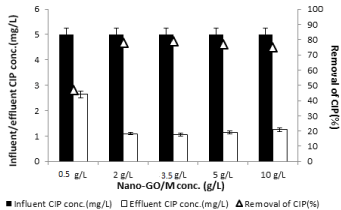
Figure 13. Effect of increasing concentration of Nano-GO/M (0.5, 2, 3.5, 5 and 10 g/L) on the yields of CIP removal for constant CIP concentration (1 mg/L) at pH = 6.5, at 35°C ± 5°C and 250 min irradiation time and with a power of 80 W sunlight (< α (0.05))
To investigate the effect of Nano-GO/M dosage on the removal efficiency of OFL; CIP treatment procedure was applied to OFL antibiotic. Effects of 0.5 g/L, 2 g/L, 3.5 g/L, 5 g/L and 10 g/L Nano-GO/M composite concentrations on the removals of OFL studied with constant sunlight time (350 min was chosen due to preliminary studies results) at original pH of OFL solution (pH = 6.5) under sunlight irradiation with a power of 80 W at outdoor temperature (35°C ± 5°C). The results were given in figure 14. A significant increase is observed in the efficiency of degradation of OFL within the range of Nano-GO/M concentration from 0.5 to 3.5 g/L. The number of available adsorption and Nano-GO/M sites on the Nano-GO/M surface increases with increasing in Nano-GO/M concentration, resulting in an enhancement in degradation efficiency. However, a further increase in Nano-GO/M (from 3.5 to 10 g/L) concentration also reduces the specific activity of the catalyst because of agglomeration of catalyst particles and light scattering and screening effect, thus leading to the decreased photocatalytic degradation efficiency from 82% to 73% for 1 mg/L initial OFL concentration. Therefore, all experiments were carried out with 2 g/L Nano-GO/M to avoid the excessive usage of the catalyst.
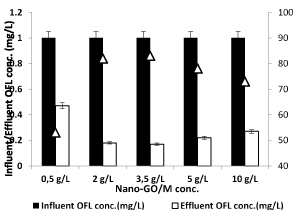
Figure 14. Effect of increasing concentration of Nano-GO/M (0.5, 2, 3.5, 5 and 10 g/L) on the yields of OFL removal for constant OFL concentration (1 mg/L) at pH = 6.5, at 35°C ± 5°C and 350 min irradiation time and with a power of 80W sunlight (<α (0.05))
Effects of irradiation time on the treatment of CIP and OFL under sunlight
The optimum dosage of catalyst and light irradiation time were necessary to ensure strong degradation efficiency [21]. Since the optimum Nano-GO/M composite concentration was found as 2 g/L; the effects of five different sunlight irradiation times (30 min, 120 min, 250 min, 350 min and 24h) on the CIP and OFL photooxidation times were studied at a pH of 6.5 and at constant 2 g/L Nano-GO/M composite concentration with a power of 80 W sunlight. As the irradiation time was increased from 30 min to 120 min, to 250 min and to 350 min the CIP removals increased from 55% to 75% to 80% and to 81% for initial CIP concentration of 1 mg/L (Figure 15). Further increase in irradiation time from 350 min to 24 h did not affect the CIP removal yield significantly. CIP removal efficiency was increased only 2% (from 81% to 83%). The optimum sunlight irradiation time can be considered as 250 min for the maximum removal efficiency of CIP.
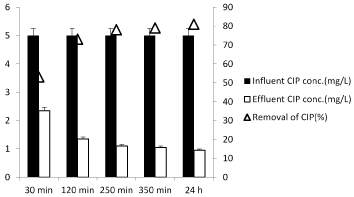
Figure 15. Effect of irradiation time on the yields of constant CIP concentration (5 mg/L), at a constant Nano-GO/M concentration (2g/L), at a pH of 6.5 and at 35°C ± 5°C and at increasing irradiation time and with a power of 80 W sunlight (<α (0.05)).
To determine the optimum irradiation time for maximum OFL removal yields, increasing irradiation (30 min, 120 min, 250 min, 350 min and 24h) times were used (Figure 16). As aforementioned in the upper section, the optimum Nano-GO/M composite concentration was found as 2 g/L. Therefore, the effects of irradiation times of sunlight on the removal of OFL studied under the same operational conditions {at constant OFL concentration (1 mg/L), at five different sunlight irradiation times (30 min, 120 min, 250 min, 350 min and 24h), at a pH of 6.5 and at constant 2 g/L Nano-GO/M composite concentration with a power of 80 W sunlight)}. The removal yields of OFL were obtained as 57%, 77%, 79% and 82% at 30 min, 120 min, 250 min and 350 min, respectively. Further increase in irradiation time from 350 min to 24 h did not affect the OFL removal yield significantly (Figure 16). OFL removal efficiency was increased only 3% (from 82% to 85%). The optimum sunlight irradiation time can be considered as 350 min for the maximum removal efficiency of OFL (82%- for 1 mg/L OFL). Lin and Wu [34] showed that CIP was degraded as a function of time at a Na2S2O8 concentration of 1.92 g/L. The efficiency of photo-degradation of CIP (initial concentration 10 mg/L) reached 70% after 5 min and then increased with time and the maximum CIP yield was recorded as 90%. They also reported that after 30 min irradiation time the degradation efficiency did not show a significant increase compared to our study.
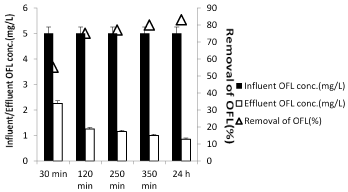
Figure 16. Effect of irradiation time on the yields of constant OFL concentration (5 mg/L), at a constant Nano-GO/M concentration (2g/L), at a pH of 6.5 and at 35°C ± 5°C and at increasing irradiation time and with a power of 80 W sunlight (<α (0.05))
Effects of pH on the of removal CIP and OFL throughout photodegradation under sunlight
Due to the chemical nature of fluoroquinolones, pH is the parameter ruling the photodegradation of CIP onto the catalyst surface. The pH value is among the most important parameters that has an impact on the photocatalytic capacity of Nano-GO/M. The effects of pH on the on the 1 mg/L CIP and OFL concentrations were studied under acidic, neutral and alkaline pHs (4, 6.5 and 10) at an irradiation time of 250 min for CIP and 350 min for OFL, at a Nano-GO/M concentration of 2 g/L and at 35°C ± 5°C. Table 1 represents the effects of different pHs on the removal efficiency of CIP. Photocatalytic removal efficiency of CIP and OFL on Nano-GO/M was relatively high at pH 6.5 (Table 1). The zero charge point of (pHpzc) Nano-GO/M is at pH ≈ 5.5 [35]. Thus, the surface of Nano-GO/M was positively charged when pH < pHpzc, and negatively charged when pH > pHpzc. CIP has positively charged (cationic; pH = 3), negatively charged (anionic; pH = 7.5), and/or zwitterionic (pH = 10) species at pHs due to different pKas of 6.1 and 8.7, respectively [36]. In the case of pH 6.5 (the natural pH of CIP), photocatalytic removal efficiency was the highest and the surface of Nano-GO/M was still in the positive form and the CIP was in its neutral form [37]. The low photodegradation efficiency at more acidic pH (for example, at 4) may be related to the decomposition and corrosion of catalyst in acidic medium [38]. On the other hand, both Nano-GO/M and CIP were negatively charged in basic conditions, leading to electrostatic repulsion between them and the lower photodegradation efficiency of CIP. In the case of pH 6.5 (the natural pH of CIP), photocatalytic removal efficiency was the highest and the surface of Nano-GO/M was still in the positive form and the CIP was in its neutral form [37]. The photooxidation of OFL depends on pH value of OFL solution same as CIP antibiotic. Since it determines the surface charge properties of the photocatalyst and therefore the adsorption behavior of the organic substrate. pH 4 and 10 are not suitable for OFL adsorption on the Nano-GO/M surface. According to the protonation constants of OFL (log K1 8.28, log K2 = 6.00), OFL exists as a species positively charged on the piperazine nitrogen atom at pH 4, as zwitterionic form, positively charged on piperazine moiety and negatively charged on quinoline moiety, at pH 7, and as the species negatively charged on quinoline at pH 9 [39].
Table 1. Photocatalytic removal efficiencies of CIP and OFL at acidic, neutral and alkaline pHs (4, 6.5 and 10) at 35°C ± 5°C and at 2 g/L constant Nano-GO/M concentration at 250 min under 80W sunlight
|
CIP concentrations (1 mg/L) |
OFL concentrations (1 mg/L) |
Removal efficiency (%) at pH = 4 |
69 |
71 |
Removal efficiency (%) at pH = 6.5 |
80 |
82 |
Removal efficiency (%) at pH = 10 |
50 |
53 |
Determination of by-products of CIP and OFL
In this study we also investigated the metabolites of CIP (M1: desenthylenciprofloxacin ans M3: oxociprofloxacin) and OFL ( POF: 9-piperazino ofloxacin and MOF: des-methyl ofloxacin) which are released during photocatalytic processes. To measure the metabolites of CIP and OFL (initial antibiotic conc. 1 mg/L), all experiments were realized at original pH (6.5) of antibiotic solutions with 2 g/L Nano-GO/M AT PHOTOOXIDATION TIMES OF 250 min AND 350 MİN FOR CIP AND OFL,RESPECTIVELY. It WAS OBSERVED THAT after photocatalytic treatment 1 mg/L INITIAL CIP DEGRADED WITH A YİELD OF 80%. 0.8 mg/L CIP was photodegraded into the final product such as CO2 and H2O( TABLE 2). 20 % of CIP was remained in the effluent WİTH AN EFFLUENT CONCENTRATION OF 0.2 MG/L. After photocatalytic treatment from 1 mg/L OFL 0.82 mg/L OFL was photodegraded while 18% of OFL was not REMOVED. Final concentrations of M1, M3, POF and MOF metabolites were found as 0.425, 0.125, 0.098 and 0.075 mg/L, respectively. Mella et al. (2001) found that 7-[(2-aminoethyl)amino]-6-fluoroquinoline) formed by the loss of the piperazine ring. This pathway was widely reported in the literature as being the primary one for CIP photo-degradation under acidic conditions [40]. Previous studies demonstrated that with longer irradiation times, the aforementioned product photo-degraded, resulting in 7-amino-6-fluoroquinoline. However, this species was not detected in the present study. Despite the fact that these compounds were preferentially found under acidic conditions, they have been observed to a very low extent at neutral pH, as well as in alkaline medium (pH 8.6 and 10.6). According to the authors, under such alkaline conditions several additional photo-degradation products were detected, corroborating our results. However, no consistent information was found regarding the mechanism of these reactions. Albini and Monti have suggested possible hydrogen abstraction either through some excited state or by hydroxyl radicals arising through the direct oxidation of water or the activation of residual dioxygen. Because an air-flushed solution was used in our study, the latter hypothesis must especially be considered here. The differences in metabolites could be attributed to the differences in the nanocomposites used, to the temperature, to the pH and to the other environmental condıtıons. However, Pico and Andrew (2007), Bobu et al.(2008), Senta et al.(2011) and Radjenovic et al. [41] investigated similar metabolites from CIP and OFL although the removal processes ( photodedradation, Biological treatment in membrane bioreactor) are quaite different.
Table 2. Shows the influent/effluent and removed/transformed CIP (250 min) and OFL (350 min), (operational conditions: pH 6.5, 2 g/L Nano-GO/M and 80 W sunlight)
|
Influent (mg/L) |
Effluent (mg/L) |
Removed concentration (mg/L) |
CIP |
1 |
0.2 |
0.8 |
M1 (desenthylenciprofloxacin) |
0 |
0.425 |
0.425 |
M3 (oxociprofloxacin) |
0 |
0.125 |
0.125 |
Total metabolites |
0 |
0.540 |
0.540 |
The rest of CIP |
1 |
0.25 |
0.05 |
OFL |
1 |
0.18 |
0.82 |
POF (9-piperazino ofloxacin) |
0 |
0.098 |
0.8211 |
MOF (des-methyl ofloxacin) |
0 |
0.075 |
2.2110 |
Total metabolites |
0 |
0.173 |
3.032 |
The rest of OFL |
1 |
0.467 |
0.647 |
Fluoroquinolones in the triplet state can be quenched by oxygen through energy transfer with organic metabolites containing -NH and –F groups. The formation of singlet oxygen and electron transfer to form the superoxide anion and AN fluoroquinolone cation radical. Another possibility is the direct decarboxylation of the CIP. In the current investigation no other electrolyte or buffer was present and, under such conditions, HO− would work as an electron donor following the mechanisms mentioned above. Starting from there and taking into account the capacity of quinolones without a piperazine moiety to convert to a triplet state is possible, After partial degradation of the piperazine side chain and subsequent formation of an metabolite containing the –OH, -NH2, -O and NH groups can be occurred, Xing et al. [42] examined eighteen of degradation products ( some of these are………. Yaz) of CIP and the most of the degradation products had lower toxicity than CIP, but some of the degradation products ( yaz neler )were more toxic.
In this paper, we synthesized and characterized a novel nano particle namely Nano-GO/M. After a successfully preparation, this nano particle was used for the treatment of two different and commonly used antibiotics (CIP and OFL), which are belong to fluoroquinolone group antibiotic, at different operational conditions. Also, four metabolites of these antibiotics were investigated by HPLC. The maximum photooxidation yield of CIP (1 mg/L) under sunlight was found to be 80% at a Nano-GO/M concentration of 2 g/L at a pH of 6.5 and at a temperature of 35°C ± 5°C after 250 min irradiation time. The maximum photooxidation yield under sunlight was found to be 82% for 1 mg/L OFL at a Nano-GO/M concentration of 2 g/L at a pH of 6.5 and at a temperature of 35°C ± 5°C after 350 min irradiation time. The CIP metabolites were desenthylenciprofloxacin and oxociprofloxacin while 9-piperazino ofloxacin and des-methyl ofloxacin are the phtooxidation metabolites of OFL.
The Authors Would Like to Express Appreciation for the Support of the Sponsors Dokuz Eylul University Scientific Research Project (KB.FEN.020), TUBITAK 2210-C National Grant for Master Thesis Relevant to Priority Subjects and Pamukkale University Scientific Research Project (2016KRM004).
- Serna-Galvis EA, Montoya-Rodríguez D, Isaza-Pineda L, Ibáñez M, Hernández F, et al. (2018) Sonochemical degradation of antibiotics from representative classes-Considerations on structural effects, initial transformation products, antimicrobial activity and matrix. Ultrason Sonochem 50: 157-165. [Crossref]
- Wang F, Feng Y, Chen P, Wang C (2018) Photocatalytic degradation of fluoroquinolone antibiotics using ordered mesoporous g-C3N4under simulated sunlight irradiation: Kinetics, mechanism, and antibacterial activity elimination. Appl Catal B Environ 227: 114-122.
- Hubicka U, Zmudzki P, Talik P, Zuromska-Witek B, Krzek J (2013) Photodegradation assessment of ciprofloxacin, moxifloxacin, norfloxacin and ofloxacin in the presence of excipients from tablets by UPLC-MS/MS and DSC. Chem Cent J 7: 1-12. [Crossref]
- Feng M, Wang X, Chen J, Qu R, Sui Y, et al. (2016) Degradation of fluoroquinolone antibiotics by ferrate (VI): Effects of water constituents and oxidized products. Water Res 103: 48-57. [Crossref]
- Xiuwei Ao, Wenjun Liu, Wenjun Sun, Meiquan Cai, Zi Ye, et al. (2018) Medium pressure UV-activated peroxymonosulfate for ciprofloxacin degradation: Kinetics, mechanism, and genotoxicity. Chem Eng J 345: 87-97.
- Hu ZH, Wang YF, Omer AM, Ouyang XK (2018) Fabrication of ofloxacin imprinted polymer on the surface of magnetic carboxylated cellulose nanocrystals for highly selective adsorption of fluoroquinolones from water. Int J Biol Macromol 107: 453-462. [Crossref]
- Wan Y, Liu X, Liu P, Zhao L, Zou W (2018) Optimization adsorption of norfloxacin onto polydopamine microspheres from aqueous solution: Kinetic, equilibrium and adsorption mechanism studies. Sci Total Environ 639: 428-437. [Crossref]
- Paul T, Liu J, Machesky ML, Strathmann TJ (2014) Adsorption of zwitterionic fluoroquinolone antibacterials to goethite: A charge distribution-multisite complexation model. J Colloid Interface Sci 428: 63-72. [Crossref]
- Wang L, Qiang Z, Li Y, Ben W (2017) An insight into the removal of fluoroquinolones in activated sludge process: Sorption and biodegradation characteristics. J Environ Sci 56: 263-271. [Crossref]
- Pan LJ, Li J, Li CX, Tang XD, Yu GW, et al. (2018) Study of ciprofloxacin biodegradation by a Thermus sp. isolated from pharmaceutical sludge. J Hazard Mater 343: 59-67.
- Durán-Álvarez JC, Avella E, Ramírez-Zamora RM, Zanella R (2016) Photocatalytic degradation of ciprofloxacin using mono- (Au, Ag and Cu) and bi- (Au-Ag and Au-Cu) metallic nanoparticles supported on TiO2 under UV-C and simulated sunlight. Catal 266: 175-187.
- Serna-Galvis EA, Ferraro F, Silva-Agredo J, Torres-Palma RA (2017) Degradation of highly consumed fluoroquinolones, penicillins and cephalosporins in distilled water and simulated hospital wastewater by UV254and UV254/persulfate processes. Water Res 122: 128-138.
- Sturini M, Speltini A, Maraschi F, Pretali L, Ferri EN, et al. (2015) Sunlight-induced degradation of fluoroquinolones in wastewater effluent: Photoproducts identification and toxicity. Chemosphere 134: 313-318. [Crossref]
- Sturini M, Speltini A, Maraschi F, Rivagli S, Pretali l, et al. (2015) Sunlight photodegradation of marbofloxacin and enrofloxacin adsorbed on clay minerals. J Photochem Photobiol A Chem 299: 103-109.
- Paul T, Dodd MC, Strathmann TJ (2010) Photolytic and photocatalytic decomposition of aqueous ciprofloxacin: Transformation products and residual antibacterial activity. Water Res 44: 3121-3132. [Crossref]
- Tegze A, Sági G, Kovács K, Homlok R, Tóth T, et al. (2018) Degradation of fluoroquinolone antibiotics during ionizing radiation treatment and assessment of antibacterial activity, toxicity and biodegradability of the products. Radiat Phys Chem 147: 101-105.
- Chen M, Chu W (2015) Photocatalytic degradation and decomposition mechanism of fluoroquinolones norfloxacin over bismuth tungstate: Experiment and mathematic model. Appl Catal B Environ 168-169: 175-182.
- Jiang C, Ji Y, Shi Y, Chen J (2016) Sulfate radical-based oxidation of fluoroquinolone antibiotics: Kinetics, mechanisms and effects of natural water matrices. Water Res 106: 507-517.
- Serpone N, Emeline A V (2002) Suggested terms and definitions in photocatalysis and radiocatalysis. Int J Photoenergy 4: 91-131.
- Umukoro EH, Peleyeju MG, Ngila JC, Arotiba A (2016) Photocatalytic degradation of acid blue 74 in water using Ag-Ag2O-Zno nanostuctures anchored on graphene oxide. Solid State Sci 51: 66-73.
- He K, Chen G, Zeng G, Huang Z, Shi J, et al. (2018) Three-dimensional graphene supported catalysts for organic dyes degradation. Appl Catal B Environ 228: 19-28.
- Mishra A (2018) Study of organic pollutant removal capacity for magnetite@ graphene oxide nanocomposites. Vacuum 157: 1-6.
- Khan W, Singh AK, Naseem S, Husain S, Shoeb M, et al. (2018) Synthesis and magnetic dispersibility of magnetite decorated reduced graphene oxide. Nano-Structures and Nano-Objects 16: 180-184.
- Farazi R, Vaezi MR, Molaei MJ, Saeidifar M, Behnam-Ghadera AA (2018) Effect of pH and temperature on doxorubicin hydrochloride release from magnetite/graphene oxide nanocomposites. Mater Today Proc 5: 15726-15732.
- Rad TS, Khataee A, Rahim Pouran S (2018) Synergistic enhancement in photocatalytic performance of Ce (IV) and Cr (III) co-substituted magnetite nanoparticles loaded on reduced graphene oxide sheets. J Colloid Interface Sci 528: 248-262. [Crossref]
- Dong S, Sun Y, Wu J, Wu B, Creamer AE, et al. (2016) Chemosphere Graphene oxide as filter media to remove levo fl oxacin and lead from aqueous solution. Chemosphere 150: 759-764. [Crossref]
- Yoon Y, Park WK, Hwang TM, Yoon DH, Yang WS, et al. (2016) Comparative evaluation of magnetite – graphene oxide and magnetite-reduced graphene oxide composite for As (III) and As (V) removal. J Hazard Mater 304: 196-204. [Crossref]
- Liu T1, Li Y, Du Q, Sun J, Jiao Y, et al. (2012) Adsorption of methylene blue from aqueous solution by graphene. Colloids Surfaces B Biointerfaces 90: 197-203. [Crossref]
- Tayyebi A, Outokesh M, Moradi S, Doram A (2015) Synthesis and characterization of ultrasound assisted “graphene oxide-magnetite” hybrid, and investigation of its adsorption properties for Sr(II) and Co(II) ions. Appl Surf Sci 353: 350-362.
- Ye N, Xie Y, Shi P, Gao T, Ma J (2014) Synthesis of magnetite/graphene oxide/chitosan composite and its application for protein adsorption. Mater Sci Eng 45:8-14.
- Zivanovic L, Zigic G, Zecevic M (2006) Investigation of chromatographic conditions for the separation of ofloxacin and its degradation products. J Chromatogr A 1119: 224-230. [Crossref]
- Wang Y, Duan H, Li L, Wang X, Li J, et al. (2012) A chemiluminescence sensor for determination of epinephrine using graphene oxide-magnetite-molecularly imprinted polymers. Carbon N Y 50: 4052-4060.
- Li ZQ, Wang HL, Zi LY, Zhang JJ (2015) Preparation and photocatalytic performance of magnetic TiO<inf>2</inf>-Fe<inf>3</inf>O<inf>4</inf>/graphene (RGO) composites under VIS-light irradiation. Ceram Int 41: 10634-10643.
- Lin CC, Wu MS (2014) Degradation of ciprofloxacin by UV/S2O82- process in a large photoreactor. J Photochem Photobiol A Chem 285: 1-6.
- Liu G, Wang N, Zhou J, Wang A, Wang J, et al. (2015) Microbial preparation of magnetite/reduced graphene oxide nanocomposites for the removal of organic dyes from aqueous solutions. RSC Adv 5: 95857-95865.
- Gu C, Karthikeyan KG (2005) Sorption of the antimicrobial ciprofloxacin to aluminum and iron hydrous oxides. Environ Sci Technol 39: 9166-9173.
- Roca Jalil ME, Baschini M, Sapag K (2015) Influence of pH and antibiotic solubility on the removal of ciprofloxacin from aqueous media using montmorillonite. Appl Clay Sci 114: 69-76.
- Daneshvar N, Aber S, Seyed Dorraji MS, Khataee A (2007) Photocatalytic degradation of the insecticide diazinon in the presence of prepared nanocrystalline ZnO powders under irradiation of UV-C light. Sep Purif Technol 58: 91-98.
- Nurchi VM, Crespo-Alonso M, Pilo MI, Spano N, Sanna G, et al. (2015) Sorption of ofloxacin and chrysoidine by grape stalk. A representative case of biomass removal of emerging pollutants from wastewater. Arab J Chem
- Vasconcelos TG, Henriques DM, König A, Martins AF, Kümmerer K (2009) Photo-degradation of the antimicrobial ciprofloxacin at high pH: Identification and biodegradability assessment of the primary by-products. Chemosphere 76: 487-493.
- Gu Y, Huang J, Zeng G, Shi L, Shi Y, et al. (2018) Fate of pharmaceuticals during membrane bioreactor treatment: Status and perspectives. Bioresource Technology 268: 733-748.
- Xing X, Du Z, Zhuang J, Wang D (2018) Removal of ciprofloxacin from water by nitrogen doped TiO2immobilized on glass spheres: Rapid screening of degradation products. J Photochem Photobiol A Chem 359: 23-32.


