Background: The early identification of the nutritional status of patients admitted to a hospital has a beneficial impact on the control of medical care costs and therapeutic strategies aimed at those patients who require it. Nutritional screenings are used to detect nutritional risk, allow early intervention and influence the prognosis.
Objective: To identify the prevalence of malnutrition in patients admitted to the Central Aeronautical Hospital of Argentina, evaluating what is the most efficient tool that would allow us to evaluate the patients’ nutritional status.
Method: Cross sectional, observational, descriptive and unicentric study. Nutritional status was evaluated in 208 subjects at hospital admission, between August and November 2014, using the Malnutrition Screening Tool (MST), the Subjective Global Assessment (SGA) and measurement of anthropometric parameters.
Results: MST and SGA scores indicated a higher proportion of patients with malnutrition in relation to the assessment of anthropometry parameters. Comparing the results obtained with MST and anthropometry methods, a statistically significant association was found between them, as well as the association between the results obtained by anthropometry and SGA. Most frequent pathologies associated with malnutrition status were those of infectious, metabolic and surgical origin.
Conclusion: To restore the patient to health, it is important to identify the nutritional status on time when admitted to a hospital. SGA method is of choice in most health centers, however, due to the strong correlation with the MST, an easy method to apply, we consider that its use is an appropriate strategy for the systematic evaluation of patients at hospital admission.
hospital malnutrition, nutritional status, nutritional screening tests
It was reported that worldwide prevalence of hospital malnutrition (HM) depends on several factors, such as a patient's diagnosis, age, indicators of food availability, access to them and their consumption, indicators of nutritional status (body measurements, mortality rates and clinical and biochemical data) [1,2]. HM ranges between 25% and 50% and it is certainly alarming in emerging regions such as Latin America. In this population, a higher prevalence was observed in people older than 60 years old [3]. An increase in global population aging has been observed recently as a substantial and permanent rise in the number of elderly people in relation to the rest of the population. Therefore, the risk of malnutrition in older adults is expected to increase in parallel to the predicted life expectancy global increase [4]. Also, the prevalence of malnutrition is a situation of concern whereby a coordinated intervention is needed, with specific objectives of nutritional status in those patients who present acute or chronic diseases and identify themselves as complex in hospital admissions [5]. Most frequent pathologies associated with malnutrition were those of neoplastic, respiratory and cardiovascular origin. Some studies have shown that the departments of internal medicine and intensive care showed the highest percentage of malnourished patients [6]. However, malnutrition can also develop due to other factors such as therapeutic procedures, lack of coverage in the hospital system on the nutritional requirements of patients, and limited records of nutritional status in the clinical history. This could lead to a failure to detect malnutrition status as well as potential risks of malnutrition due to the previously mentioned causes [7]. Therefore, the evaluation of nutritional status would have to be considered as an integral part of the clinical evaluation in the admission of a patient, and significant consequences could be prevented [8]. HM has a clear and consistent negative impact, such as an increased morbidity and mortality of patients, prolonged hospitalization time, a higher rate of hospital readmissions and elevated economic expenses [9]. In this sense, and applying the integral aspect of nutritional status, it becomes necessary to have one method to carry out a nutritional assessment in clinical situations of different etiology, that may include other variables such as patients’ gender and age. Despite worldwide recognition of malnutrition as a problem of hospitalized patients and available measures aimed at its prevention, even today there is no gold-standard systematic method for early detection of nutrition status screening of this population [10]. Recent evidence has shown that the Malnutrition Screening Tool (MST) correctly diagnoses more than 80% of patients (S=69.4%, E=94.2%), and that it has a good reliability and validity with respect to nutritional assessment in institutionalized and hospitalized subjects [11]. Apart from that, it does not require any calculation: it is quick and easy to perform, consisting of only 2 questions, and it can be self-administered. On the other hand, the American Society of Parenteral and Enteral Nutrition (A.S.P.E.N.) recommends the use of a Subjective Global Assessment (SGA) to establish a nutritional status diagnosis. It is considered a reproducible clinical method that evaluates patients’ nutritional status, combining clinical history of patients (anamnesis) and anthropometric parameters [12]. It can be used as a predictor of medical complications. The usefulness of SGA in critical patients has not been evaluated formally. This method has low sensitivity and could fail to detect mild grades of malnutrition. Regardless of the method used, all patients must undergo an assessment of their nutritional status at hospital admission. However, despite the technological advance in nutritional screening tools and methods, their advantages and disadvantages are still under discussion. In addition, it is important to note that the selected tools should adapt to the hospital environment in which they will be established. The Central Aeronautical Hospital of our country is the main health center that treats military and civilian personnel of the institution and their families. In the present study, we set out to evaluate the most efficient resource that allows us to know the nutritional status of patients admitted to our hospital, considering that the detection tools should be simple, using a validated, fast and economical method. To do this, we set the following objectives: Principals: i) to establish the prevalence of malnutrition or risk of malnutrition at hospital admission from patients with medical or surgical pathologies, ii) to evaluate the use of the best systematic method for early detection of malnutrition at hospital admission. Minors: i) to correlate the results obtained between two different methods of nutritional screening, MST and SGA, ii) to recognize and compare the most frequent pathological conditions associated with malnutrition status, iii) to establish and compare the relationship between other conditions, such as gender and age with nutritional status.
Study design
We conducted an observational, descriptive, cross-sectional and unicentric study in the Central Aeronautic Hospital, in the areas of Internal Medicine, General Surgery, Traumatology and Urology from August to November 2014. Patients under 18 years old or those who could not be diagnosed through anamnesis were excluded, as well as pregnant women or women in immediate postpartum period. The study was approved by the hospital’s ethics committee. All patients in the study group were informed about the purpose of the study and provided written informed consent for their involvement.
The examination of each patient was performed on a single day, within 48 hours of hospital admission, and consisted of:
1) Assessment of nutritional clinical history: diagnosis of admission, changes on eating habits, anamnesis. History of toxic habits, daily drugs used, gastrointestinal symptoms and chronic diseases. Malnutrition screening tests were applied: MST and SGA.
2) All anthropometric measurements were taken using standard techniques, which included weight (W), height (H), body mass index (BMI), wrist circumference (WC) and ideal weight calculation (IW) measurements. Also, the percentage of ideal weight (PIW) and the calculation of percentage of weight loss (PWL) were measured in the corresponding cases. In the case of patients whose weight and height could not be measured due to their clinical condition, the reason was included in the form. Additionally, the following determinations were made: BMI: individual’s weight over height squared. (BMI=W/H2). It was expressed in Kg/m2 (meters2). Wrist circumference: measured with flexible metric tape located distal to the styloid process of the radius at the wrist. A crossing technique was used. Its result was expressed in centimeters (cm). Contexture: quotient between size and wrist circumference, both expressed in cm. Calculation of ideal weight: weight tables according to size, gender and contexture. Percentage of Weight Loss: PWL=(Normal weight- Current weight/Normal weight)×100. Calculation of Percentage of Ideal Weight: PIW=Current weight (Kg)/Ideal weight (Kg)×100.
Statistical analysis
Results of numerical variables are expressed as arithmetic mean and standard deviation (X ± SD), and those of the categorical variables in frequencies (%). For the analysis of the relationship between variables, the chi-square test was used, with a level of significance of 0.05.
A total of 208 patients (110 females and 98 males) were evaluated within 48 hours of hospital admission during a period of four months, by applying MST, SGA and anthropometric measurements as variables when feasible. It was only feasible to record the anthropometric parameters of weight and height in 176 patients (84.61%). In the rest it was not possible use to inability to mobilize them. The average age of total population studied was 63.5 years old (+/- 17.86 years). MST and SGA scores indicated a higher proportion of patients with malnutrition (44.2% and 40.3% respectively) in relation to the assessment of anthropometry parameters (10.2%).
Anthropometric evaluation showed an average BMI value of 26.79 Kg/m2 (+/- 5.5) and 66.95% of the patients were within the overweight (45.45%) or obesity (21.5%) range. Comparing the results obtained with MST and anthropometry methods, a statistically significant association was found between them, as well as the association between the results obtained by anthropometry and SGA. Only 33.7% of the total patients evaluated by both methods (n: 176) who were detected some degree of malnutrition by the SGA method were categorized in the same way by anthropometric parameters. The remaining patients (66.3%), who were included in SGA “B” and “C” categories, presented normal weight (27%), overweight (25.6%) or obesity (13.5%) according to the anthropometric parameters used. No statistical association was presented between the prevalence of malnutrition assessed by MST and patients’ gender. (Chi-square test, p value=0.2271). No association between patients’ gender and SGA assessment (Chi-square test, p value=0.1133) was observed either. These results are presented in Table 1 and Table 2. It was evaluated the correlation between different methods and a statistically significant association was found between the assessments of the nutritional status by SGA and MST. 11% of the total patients were included in “A” SGA category and they were considered at risk of malnutrition by MST. Surprisingly, 22% of the patients assigned to “B” SGA category were included in the group of patients without risk of malnutrition by the MST method (Table 3). Figure 1 shows the most frequent pathologies associated with malnutrition status. There were those of infectious (21.2%), metabolic (20%) and surgical (19.2%) origin, depending on different evaluation methods used.
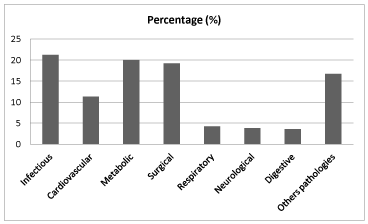
Figure 1. Frequent of pathologies associated with malnutrition status
Table 1. SGA and anthropometry association
Anthropometry / SGA |
A |
B |
C |
Total |
Mild malnutrition |
1 |
13 |
2 |
16 |
Moderate malnutrition |
0 |
2 |
6 |
8 |
Severe malnutrition |
0 |
0 |
1 |
1 |
Normal |
22 |
15 |
5 |
42 |
Obesity |
31 |
9 |
1 |
41 |
Overweight |
49 |
19 |
0 |
68 |
Total |
103 |
59 |
15 |
176 |
SGA: Subjective global assessment. A statistically significant association was found between malnutrition values given by anthropometry and SGA (p value<0.0001, Chi square independence test)
Table 2. MST and anthropometry association
Anthropometry / MST |
R |
SR |
Total |
Mild malnutrition |
15 |
1 |
16 |
Moderate malnutrition |
7 |
1 |
8 |
Severe malnutrition |
1 |
0 |
1 |
Normal |
19 |
23 |
42 |
Obesity |
12 |
29 |
41 |
Overweight |
21 |
47 |
68 |
Total |
75 |
102 |
176 |
MST: Malnutrition Screening Tool. A statistically significant association was found between malnutrition values given by anthropometry and MST (p value<0.0001, Chi square independence test)
Table 3. Correlation between SGA and MST
SGA/MST |
Risk of malnutrition |
No risk of malnutrition |
Total |
A |
13 |
99 |
112 |
B |
59 |
17 |
76 |
C |
20 |
0 |
20 |
Total |
92 |
116 |
208 |
Comparison between different results, SGA and MST. (p value <0.0001, Chi square independence test)
It is known that nutritional status depends on a wide range of factors, and that they should be analyzed in food, health and care categories [13]. These are key aspects to consider in the nutritional evaluation, especially to identify patients at risk of malnutrition during hospital admission. The present study has been designed to identify the prevalence of malnutrition in hospitalized patients in the Central Aeronautical Hospital in the city of Buenos Aires, Argentina. As detailed above, the identification of malnutrition varies depending on the criteria used for its definition and diagnosis at the point of admission and the use of adequate nutritional risk tools. Data has shown a prevalence of between 10% and 44% in patients with some degree of malnutrition or at risk of it, depending on the method used. Our findings are in line with previous reports that indicate a similar malnutrition prevalence percentage rate in patients around 60 years old [14]. The detection of malnutrition status or malnutrition risk was higher when MST and SGA methods were applied (44% and 40%, respectively) in comparison with the results obtained by anthropometric parameters (10%). Some authors consider that the use of anthropometric measurements could be an alternative for the calculation and estimation of BMI and, consequently, for the classification by malnutrition risk [15,16]. We consider that the assessment of nutritional status by only using anthropometric parameters is not convenient, because anthropometry applied in isolation presents low sensitivity compared with other methods used.
Taking into consideration the items that constitute the SGA method (questions associated with physical examination), it could prove to be an accurate tool that allows to know with more detail the degree of malnutrition in patients, to initiate a therapeutic treatment according to their requirements. As for its disadvantages, it requires trained staff and more time to perform it, compared with other methods. The MST method presented good correlation with the results obtained from SGA. In addition, it could be a simpler method with the capacity to determine an action according to its results: to apply a more exhaustive method and patient reassessment during hospitalization. Therefore, MST could be the best method for us to assess patients at hospital admission.
On the other hand, it has been observed that malnutrition related to disease is usually frequent at hospital institution admission, worldwide and at all ages [17,18]. In case of our hospital admission, we demonstrated that the most frequent pathologies associated with a certain degree of malnutrition were those of infectious, metabolic and surgical origin. The analysis of the most frequent pathologies with malnutrition status clearly shows that the origin is heterogeneous and with a significant percentage to be considered [19]. The status of hospitalized malnourished patients has negative consequences that impact clinical evolution. This is associated with increased costs for the institution and society [20]. Malnourished hospitalized patients present high risks of developing complications and increase mortality rates. The risk of worsening malnutrition increases together with the duration of the hospital stay, being detrimental to patients’ health [21,22]. Thus, considering the relevance of the prevalence of malnutrition at hospital admission, and with a high possibility of worsening during hospitalization, the most appropriate, fast and economic tools for diagnosis and organizational structure of each hospital center must be chosen.
In summary, each health center should use the available screening method in their hospital environment. To our knowledge, this study is the first to identify evidence of prevalence of malnutrition in the Central Aeronautical Hospital. Nowadays, the SGA is the method of choice in most health centers. However, due to the strong correlation with the MST, an easy method to apply, we consider that its use is an appropriate strategy for the systematic evaluation of patients at hospital admission.
The author(s) declared no potential conflicts of interest with respect to the research, authorship, and/or publication of this article.
The author(s) received no financial support for the research, authorship, and/or publication of this article.
- Norman K, Pichard C, Lochs H, Pirlich M (2008) Prognostic impact of disease-related malnutrition. Clinical Nutrition 27: 5-15.
- Barker LA, Gout BS, Crowe TC (2011) Hospital malnutrition: prevalence, identification and impact on patients and the healthcare system. International Journal of Environmental Research and Public Health 8: 514-527.
- Correia MI, Campos AC (2003) Prevalence of hospital malnutrition in Latin America: the multicenter ELAN study. Nutrition 19: 823-825.
- Swinburn BA, Sacks G, Hall KD, McPherson K, Finegood DT, et al. (2011) The global obesity pandemic: shaped by global drivers and local environments. The Lancet 378: 804-814.
- Ravasco P, Camilo ME, Gouveia-Oliveira A, Adam S, Brum G (2002) A critical approach to nutritional assessment in critically ill patients. Clinical Nutrition 21: 73-77.
- Lew CCH, Yandell R, Fraser RJL, Chua AP, Chong MFF, et al. (2017) Association between malnutrition and clinical outcomes in the intensive care unit: A systematic review. JPEN J Parenter Enteral Nutr 41: 744‐758.
- Alberda C, Graf A, Mc Cargar L (2006) Malnutrition: etiology, consequences, and assessment of a patient at risk. Best Practice & Research Clinical Gastroenterology 20: 419-439.
- Ahmed T, Haboubi N (2010) Assessment and management of nutrition in older people and its importance to health. Clin Interv Aging 5: 207-216. [Crossref]
- Lim SL, Ong KC, Chan YH, Loke WC, Ferguson M, et al. (2012) Malnutrition and its impact on cost of hospitalization, length of stay, readmission and 3-year mortality. Clinical Nutrition 31: 345-350. [Crossref]
- Suárez-Llanos JP, Mora-Mendoza A, Benítez-Brito N, Pérez-Méndez L, Pereyra-García-Castro F, et al. (20180 Validity of the new nutrition screening tool Control of Food Intake, Protein, and Anthropometry (CIPA) in non-surgical inpatients. Arch Med Sci 14: 1020-1024. [Crossref]
- Castro-Vega I, Veses Martín S, Cantero Llorca J, Salom Vendrell C, Bañuls C, et al. (2018) Validation of nutritional screening Malnutrition Screening Tool compared to other screening tools and the nutritional assessment in different social and health areas. Nutrición Hospitalaria 35: 351-358. [Crossref]
- Wang F, Chen W, Bruening KS, Raj S, Larsen DA (2016) Nutrition screening tools and the prediction of clinical outcomes among chinese hospitalized gastrointestinal disease patients. PLoS One 11: e0159436. [Crossref]
- Spagnuolo MI, Liguoro I, Chiatto F, Mambretti D, Guarino A (2013) Application of a score system to evaluate the risk of malnutrition in a multiple hospital setting. Ital J Pediatr 39: 81. [Crossref]
- Neelemaat F, Meijers J, Kruizenga H, van Ballegooijen H, van Bokhorst-de van der Schueren M. (2011) Comparison of five malnutrition screening tools in one hospital inpatient sample. J Clin Nurs 20: 2144-2152.
- Stratton RJ, Hackston A, Longmore D, Dixon R, Price S, et al. (2004) Malnutrition in hospital outpatients and inpatients: prevalence, concurrent validity and ease of use of the ‘malnutrition universal screening tool’ (‘MUST’) for adults. Br J Nutr 92: 799-808.
- Skipper A, Ferguson M, Thompson K, Castellanos VH, Porcari J (2012) Nutrition screening tools: An analysis of the evidence. J Parenter Enteral Nutr 36: 292-298.
- Pawellek I, Dokoupil K, Koletzko B (2008) Prevalence of malnutrition in paediatric hospital patients. Clin Nut 27: 72-76.
- Schuetz P, Fehr R, Baechli V, Geiser M, Deiss M, et al. (2019) Individualised nutritional support in medical inpatients at nutritional risk: A randomized clinical trial. Lancet 393: 2312-2321.
- Cereda, E, Pedrolli C, Klersy C, Bonardi C, Quarleri L, et al. (2016) Nutritional status in older persons according to healthcare setting: a systematic review and meta-analysis of prevalence data using MNA®. Clinical Nutrition 35: 1282-1290.
- Konturek PC, Herrmann HJ, Schink K, Neurath MF, Zopf Y (2015) Malnutrition in hospitals: It was, is now, and must not remain a problem! Med Sci Monit 21: 2969-2975. [Crossref]
- Ockenga J, Freudenreich M, Zakonsky R, Norman K, Pirlich M, et al. Nutritional assessment and management in hospitalised patients: implication for DRG-based reimbursement and health care quality. Clin Nutr 24: 913-919.
- van Venrooij LM, de Vos R, Borgmeijer-Hoelen MM, Haaring C, de Mol BA (2008) Preoperative unintended weight loss and low body mass index in relation to complications and length of stay after cardiac surgery. Am J Clin Nutr 87: 1656-1661.