Very low-carbohydrate (VLC) diet with intermittent fasting (IF) have been shown to improve glycemic control and promote weight loss. However, their sustainability beyond 12 months has yet to be shown. This observational study aimed to assess sustainable weight loss and improvement in metabolic profile with such strategy in a self-motivated cohort. Subjects were recruited from a social media-based group who had to be on VLC±IF. Participants completed a questionnaire through on online survey tool. Participants voluntarily provided laboratory data pre- and post-lifestyle intervention. 63 patients participated in the study. Mean length on the diet was 35.8 months. Mean weight loss was 16.1 kg (|Z|-value 4.13, p<.0001). 53/63 (84.1%) respondents practiced IF. 18/63 (28.6%) reported fasting for 16 hours and eat within an 8-hour window whereas 15/63 (23.8%) reported fasting for 18 hours and eat within a 6-hour window. Mean carbohydrate intake was 10%. Change in mean glucose level was from 121.6 mg/dl to 90.4 mg/dl (|Z|-value 3.08, p 0.0034) and hemoglobin A1c from 6.87% to 5.2% (|Z|-value 3.96, p .0002). Triglycerides level showed reduction from 159.4 mg/dl to 98.4 mg/dl (|Z|-value 3.39, p 0.0012). HDL levels increased from 50.2 mg/dl to 66.9 mg/dl (|Z|-value 3.46, p<0.001) whereas total cholesterol level and LDL level increased from 206.3 mg/dl to 236 mg/dl (|Z|-value 1.94, p 0.0561) and from 138.4 mg/dl to 156.4 mg/dl (|Z|-value 1.68, p 0.0977) respectively. Participation of social media-based support group provides a unique opportunity to study the effects of different dietary and fasting approaches in real-world situations and is more likely to indicate the durability of such approaches. Although observational in nature with the caveat of self-reporting, the results are promising and call for larger, randomized trials.
very low carbohydrate diet, intermittent fasting, lower insulin, hemoglobin A1c, weight loss, steatohepatitis
Very low-carbohydrate (VLC) diets are among many diets available for weight loss and diabetes control. In comparison with low-fat diets, VLC diets have shown more pronounced recuperation of insulin sensitivity as well as a steeper decrease of weight and triglyceride levels. However, there is a paucity of data pertaining to their sustainability beyond one year [1-4]. A randomized trial demonstrated that a VLC diet compared to a low-fat diet resulted in greater weight loss at 3 months that continued on at 9 months. However, follow-up at 2 years there no longer was a significant difference in weight loss, hyperlipidemia nor hemoglobin A1c (HgbA1c) levels [5,6]. Similarly, a larger randomized 2-year study observed a maximal weight loss in patients on a VLC diet at the 6-months mark after which the weight regain was observed. The same group published a follow-up study after 4 more years and observed that the patients on the VLC diet had a mean of 3 kg of weight regain [7]. Patients still showed a significant drop in their total cholesterol- and triglyceride levels. Even though the authors reported an adherence rate of 67% to the diet, the sharp increase in weight and triglyceride levels after the 2-year dietary intervention phase was striking, raising doubts about the actual adherence rate. Usually, patients participating in nutrition- and weight loss studies are randomly assigned to a particular diet which might explain their lack of motivation to continue this specific diet once the trial has ended. Thus, while the short-term effects of a VLC diet on weight- and diabetes control are quite compelling, there remains the question of sustainability of this form of nutrition. A VLC diet significantly reduces hunger in comparison to a low-fat diet [8,9]. Fasting might be easier to pursue while on a VLC diet given that the feeling of hunger is less pronounced. Intermittent fasting (IF) further facilitates weight loss and glycemic control. Therefore, we aimed to study the impact of combination of a VLC diet and IF on metabolic parameters and adherence.
Study design
In order to find patients for this observational trial who had voluntarily put themselves on a VLC diet with IF, we looked at appropriately focused social media platforms. We chose to recruit the participants from members of a Facebook group called “Lower Insulin”. This group discusses the scientific evidence for the development of metabolic diseases due to food- and lifestyle choices. Therefore, many members of the group have been following a VLC diet with IF lifestyle long term. Participants had to be on a VLC diet with less than 20% of their nutrition coming from carbohydrates. Study protocol was approved by Hennepin Healthcare Research Institute (HHRI) that serves as Institutional Review Board (IRB) for Hennepin Healthcare System. Participants for this study were asked to fill out a questionnaire with 56 questions (SurveyMonkey) on patient characteristics (age, gender, height, weight), details on their specific diets (macronutrients, fasting patterns, refeeding days, adherence), laboratory levels (fasting insulin, plasma glucose, HgbA1c, lipid panel), current medication, lifestyle choices (smoking, exercise) and metabolic disorders (cancer, cardiovascular diseases including myocardial infarction, stroke and peripheral vascular diseases), insomnia, arthralgia, non-alcoholic fatty liver disease, autoimmune diseases, memory loss, depression). Two time points were surveyed – before participants had started on the VLC with IF and current. Participants were asked to provide copies of their original laboratory data.
Statistical analysis
Comparisons were made between the pre and post periods using SAS Enterprise Guide version 4.3. Chi squared statistics were used to determine significant differences between the two time periods for categorical variables t-tests were used to compare means between the two time periods. Odd ratios were calculated using logistic regression.
63 members of “Lower Insulin” filled out the questionnaire. 49.2% were female and 51.8% were male. 92.1% were Caucasians. 2 participants had type 1 diabetes mellitus (DM). 5 respondents had prediabetes. 14 respondents had type 2 DM. 32 of the 63 (51%) participants provided their lab values. Mean length of time on the diet was 35.8 months; median length of time was 20 months (lower quartile 14, upper quartile 38). 18/63 (29%) respondents were on the diet for more than 36 months.
Mean weight loss for the 63 participants was 16.1 kg (|Z|-value 4.13, p<.0001) (Figure 1). 53/63 (84.1%) respondents practiced intermittent fasting. 18/63 (28.6%) reported fasting for 16 hrs and eat within an 8-hr window whereas 15/63 (23.8%) respondents reported fasting for 18 hrs and eat within a 6-hr window (Table 1) (Figure 2). The mean carbohydrate intake was 10% whereas mean fat intake was 50.1% and of protein was 38.8%. 23% of patients reversed their diabetes and 21% their pre-diabetes. 8.8% went from diabetes to pre-diabetes (Table 2).
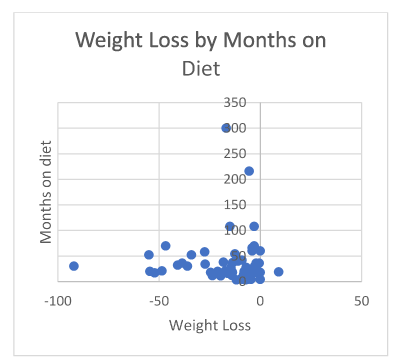
Figure 1. Weight loss by months on diet
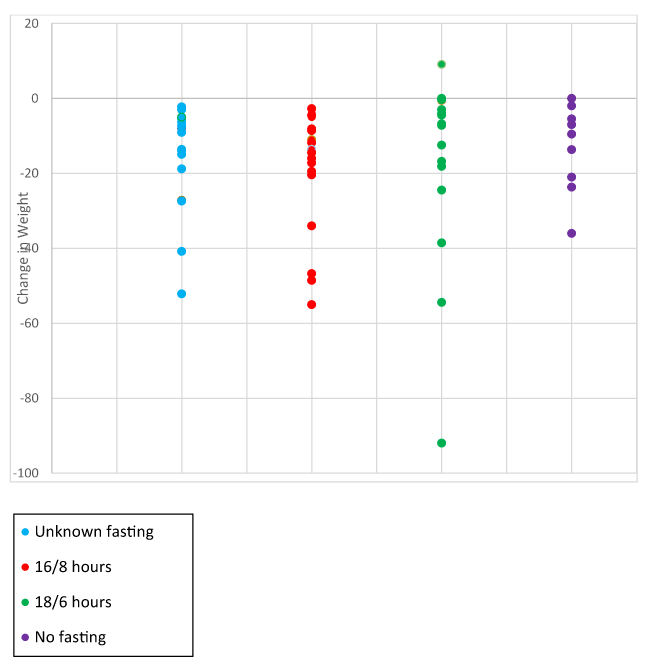
Figure 2. . Change in weight in association with intermittent fasting type
Table 1. Baseline characteristics of study participants
|
All respondents |
16/8 fasting |
18/6 fasting |
No fasting |
| |
n |
mean±(SD) |
n |
mean±(SD) |
n |
mean±(SD) |
n |
mean±(SD) |
Male |
63 |
0.51±(0.50) |
18 |
0.33±(0.49) |
16 |
0.63±(0.50) |
10 |
0.50±(0.53) |
Caucasian |
63 |
0.92±(0.27) |
18 |
0.94±(0.24) |
16 |
0.94±(0.25) |
10 |
0.90±(0.32) |
Months on diet |
63 |
54.35±(10.36) |
18 |
53.33±(6.63) |
16 |
56.94±(9.89) |
10 |
48.80±(14.37) |
Age |
63 |
35.79±(47.14) |
18 |
27.36±(20.27) |
16 |
47.19±(70.04) |
10 |
42.90±(63.01) |
Exercise (hours per week) |
54 |
5.37±(3.11) |
16 |
4.99±(3.74) |
13 |
5.19±(1.94) |
8 |
5.38±(1.85) |
Table 2. Mean change in metabolic variables stratified according to fasting and non fasting group
|
n |
baseline mean±(SD) |
final mean±(SD) |
mean change± (SD)
(final - baseline) |
Wilcoxon rank sum test |
Wilcoxon Rank Sum Exact > Chi-square, Bonferroni correction
|
Kruskal-Wallis Test PR > Chi-Square |
Friedman non-parametric test Prob |
Glucose |
All respondents |
25 |
121.60±(63.79) |
90.43±(12.64) |
-31.13±(45.98) |
0.0034 |
- |
- |
- |
16/8 fasting |
7 |
92.31±(7.69) |
91.68±(16.15) |
-0.63±(12.65) |
0.7077 |
- |
0.1475 |
0.0109 |
18/6 fasting |
6 |
119.70±(43.20) |
90.61±(17.57) |
-29.04±(27.18) |
0.0607 |
- |
- |
- |
No fasting |
6 |
148.40±(92.85) |
88.27±(8.40) |
-60.15±(65.92) |
0.0706 |
- |
- |
- |
HbA1c |
All respondents |
34 |
6.87±(2.51) |
5.20±(0.59) |
-1.67±(1.82) |
0.0002 |
- |
- |
- |
16/8 fasting |
9 |
6.47±(2.24) |
5.17±(0.69) |
-1.30±(1.66) |
0.1026 |
- |
0.6073 |
0.0003 |
18/6 fasting |
8 |
6.88±(1.75) |
4.95±(0.35) |
-1.93±(1.26) |
0.0058 |
- |
- |
- |
No fasting |
7 |
7.63±(3.04) |
5.54±(0.47) |
-2.09±(2.18) |
0.2678 |
- |
- |
- |
Total cholesterol |
All respondents |
34 |
206.30±(51.12) |
236.00±(62.40) |
29.71±(57.04) |
0.0561 |
- |
- |
- |
16/8 fasting |
9 |
206.70±(62.54) |
240.40±(50.00) |
33.63±(56.62) |
0.4125 |
- |
0.0236 |
0.1703 |
18/6 fasting |
6 |
224.60±(20.60) |
295.40±(62.15) |
70.87±(46.30) |
0.0922 |
0.0044 |
- |
- |
No fasting |
8 |
195.80±(51.33) |
184.60±(48.55) |
-11.19±(49.96) |
1 |
0.0044 |
- |
- |
Triglycerides |
All respondents |
35 |
159.40±(114.10) |
98.40±(97.64) |
-60.99±(106.20) |
0.0012 |
- |
- |
- |
16/8 fasting |
12 |
174.70±(93.82) |
120.30±(159.20) |
-54.47±(130.70) |
0.0341 |
- |
0.2309 |
0.0055 |
18/6 fasting |
6 |
90.21±(22.84) |
88.94±(47.20) |
-1.28±(37.08) |
0.6966 |
- |
- |
- |
No fasting |
8 |
186.30±(174.90) |
95.51±(47.37) |
-90.80±(128.10) |
0.1486 |
- |
- |
- |
LDL-C |
All respondents |
33 |
138.40±(53.66) |
156.40±(52.35) |
18.02±(53.01) |
0.0977 |
- |
- |
- |
16/8 fasting |
10 |
134.90±(45.48) |
153.50±(41.06) |
18.65±(43.33) |
0.5524 |
- |
0.0207 |
0.2055 |
18/6 fasting |
6 |
150.30±(36.03) |
205.70±(66.66) |
55.46±(53.58) |
0.1564 |
0.0018 |
- |
- |
No fasting |
7 |
110.20±(38.57) |
110.60±(36.09) |
0.46±(37.35) |
0.8023 |
0.0018 |
- |
- |
HDL-C |
All respondents |
33 |
50.28±(14.35) |
66.89±(19.68) |
16.61±(17.22) |
0.001 |
- |
- |
- |
16/8 fasting |
10 |
48.43±(12.55) |
68.36±(18.19) |
19.93±(15.63) |
0.0238 |
- |
0.1505 |
0.0045 |
18/6 fasting |
6 |
59.54±(16.81) |
66.49±(20.88) |
6.95±(18.95) |
0.1564 |
- |
- |
- |
No fasting |
8 |
46.75±(15.57) |
60.74±(22.40) |
13.99±(19.29) |
0.1907 |
- |
- |
- |
Insulin |
All respondents |
9 |
19.63±(27.46) |
6.61±(11.14) |
-13.03±(20.95) |
0.0632 |
- |
- |
- |
16/8 fasting |
2 |
5.50±(0.71) |
2.50±(0.71) |
-3.00±(.071) |
0.3293 |
- |
0.2128 |
0.0135 |
18/6 fasting |
1 |
4 |
4 |
0.00 |
|
- |
- |
- |
No fasting |
3 |
30.80±(40.01) |
2.46±(2.40) |
-28.34±(28.34) |
0.1413 |
- |
- |
- |
4/63 (1.6%) interrupted their low-carbohydrate diet for more than one month.
Laboratory results
Mean glucose levels in 25/63 participants decreased from 121.6 mg/dl to 90.4 mg/dl (|Z|-value 3.08, p 0.0034) (Figure 3). Accordingly, HgbA1c levels in 34/63 respondents decreased from 6.87% to 5.2% (|Z|-value 3.96, p 0.0002) (Figure 4).
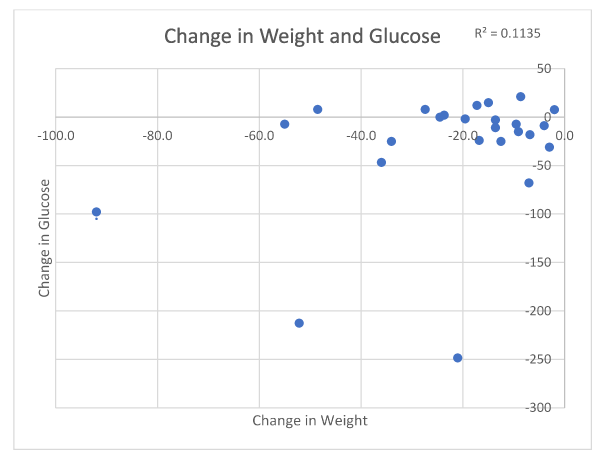
Figure 3. Change in weight in association with glucose level
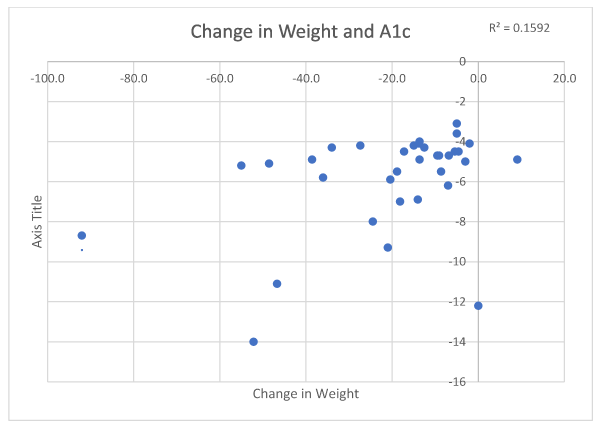
Figure 4. Change in weight in association with HgbA1c
Mean insulin level in 9/63 participants was 19.6 mg/dl (SD 27.46, minimum 1.1, maximum 77) prior to the start of the diet and 6.6 mg/dl (SD 11.14, minimum 0, maximum 36).
Mean triglycerides in 35/63 respondents improved from 159.4 mg/dl to 98.4 mg/dl (|Z|-value 3.39, p 0.0012) (Figure 5). Mean HDL in 33/63 respondents increased from 50.2 mg/dl to 66.9 mg/dl (|Z|-value, 3.46, p 0.001) (Figure 6). Mean LDL in 33/63 respondents increased from 138.4 mg/dl to 156.4 mg/dl (|Z|-value 1.68, p 0.0977) (Table 2) (Figure 7).
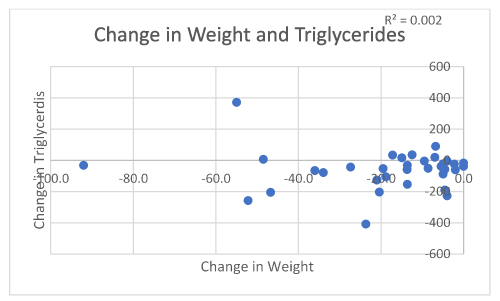
Figure 5. Change in weight in association with triglyceride levels
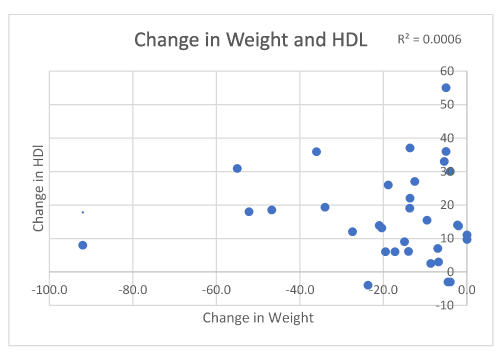
Figure 6. Change in weight in association with HDL levels
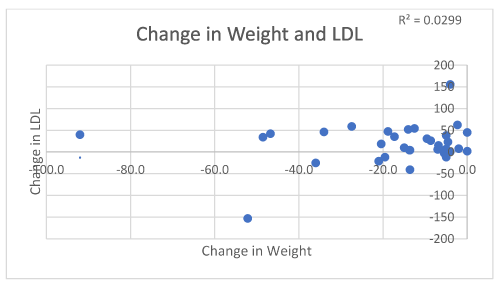
Figure 7. Change in weight in association with LDL
Medications
Out of the 12 patients taking diabetes medication before the start of VLC with IF, 7 (58%) stopped their diabetes medication. 2 (17%) patients were able to reduce the number of medications. Therefore 9/12 (75%) had either stopped taking diabetes medication or reduced the number of diabetes medications.
Out of the 12 patients initially taking antihypertensives, 4 (33%) stopped their medication completely, 3 (25%) reduced their antihypertensives. However, 7 patients had no changes and 2 (16%) patients added antihypertensives.
7 patients were on lipid-lowering drugs prior the start of the intervention. 5/7 (71%) were able to stop the lipid-lowering drugs while on VLC with IF.
Comorbidities
8/61 (13.11%) participants reported fatty liver disease prior to the onset of the intervention. Only 1/61 (1.6%) respondent documented hepatic steatosis while on VLC diet with IF. 20/62 (32.26%) participants experienced documented insomnia before the start of the regimen, whereas only 5/62 (8.1%) still reported insomnia. 2/62 (3.23%) developed insomnia while on the current regimen (likelihood ratio 5.1406, p 0.0234). 30/59 (50.85%) participants checked joint pain on the questionnaire at baseline whereas 4/59 (6.8%) still had joint pain while on the intervention. 1/59 (1.69%) developed joint pain who did not have joint pain prior to the start of the diet (likelihood ratio 0.19846, p 0.1589). 15/61 (24.6%) respondents reported memory loss prior to the start of a VLC diet with IF while 2/61 (3.3%) reported memory loss (not significant) while on the regimen.
The participants of this trial were chosen from a preselected social media platform group focusing on a VLC diet with IF lifestyle. Our cohort demonstrated significant and durable improvement in fasting glucose, insulin levels, HgbA1c, triglycerides and HDL cholesterol levels.
The rising LDL- and total cholesterol levels were a remarkable finding. Several studies have shown a similar effect on the lipid panel during a low-carbohydrate diet. A study by Shai et al. showed a rise in LDL cholesterol for the first 6 months after which the levels decreased again. During the same time adherence to a VLC diet decreased as well [10]. Similarly, a non-significant rise of LDL-C in patients on a VLC diet was seen at the 12-months mark and decreasing levels of HDL-C and TG at 6 and 12 months in another study by Gjuladin-Hellon et al. [11]. A study focusing on a ketogenic diet attributed the increase of LDL to large LDL sub-fraction [12]. Further studies need to be conducted regarding prognostic significance of these lipid parameters in the setting of low insulin levels. Postprandial hyperinsulinemia by itself is associated with CVD [13]. The risk of CVD might be substantially decreased in the setting of low insulin levels independent of the LDL- and cholesterol levels.
A VLC diet with IF leading to a mean weight loss of 16 kg, ongoing for a mean of 3 years in the 63 self-motivated participants of this observational study is significant. Moreover, 23% of patients reversed diabetes, 8.8% went from diabetes to pre-diabetes and 21% reversed pre-diabetes. The data may indicate that combining VLC diet with IF possibly renders the diet itself more feasible and further contributing to weight loss and glycemic control. Most patients did not interrupt their diet; only 1.6% of patients stopped their diet for more than one month. There could be several possible explanations for the excellent adherence rate of the participants. For one, selection bias could have prevented patients, not adhering to the diet, to participate in the trial. Participants could have also had a much better adherence rate than previously reported as they had voluntarily put themselves on this particular diet as opposed to be randomly assigned. In addition, the high rate of intermittent fasting might have facilitated adherence to a low-carbohydrate diet. Fasting has been linked to restoration of beta-cells in mice which underlines its possible importance in conjunction with a very-low carbohydrate diet in humans with diabetes [14].
Even though self-reported and not statistically significant, participants demonstrated less steatohepatitis on a VLC diet. Patients with hyperinsulinemia, for example in the setting of polycystic ovarian disease (PCOS), have an increased risk of non-alcoholic fatty liver disease [15-17]. Decreasing insulin levels to reduce the risk of steatosis hepatitis is an important argument to follow a low-carbohydrate diet. A recent study uncovered the pathophysiologic mechanisms of NAFLD amelioration in patients on such diet [18].
Lack of sleep is considered a risk factor for the development of diabetes mellitus. VLC diet with IF in our cohort was correlated with significant improvement in insomnia leads to the question whether it isn’t rather the hyperinsulinemia leading to insomnia, eventually leading to diabetes mellitus [19] although this needs to be investigated systematically.
The results in this study are not significant for reduction of memory loss and arthralgia. Nevertheless, these findings are hypothesis-generating and should be further investigated. Hyperinsulinemia has been associated with the development of Alzheimer’s disease. Continuous reduction in insulin levels through a VLC diet with IF might lead to risk reduction for developing Alzheimer’s disease [20,21].
This study relies on self-reporting of the participants which affects its validity. However, to reduce the risk of self-reporting bias we asked the participants to provide laboratory reports where available. A comparable trial using social media platforms has been done on type I diabetes patients. In this case 42% of respondents were comprised of the parents of the patients, and laboratory documentation were not available [22]. In our trial we assessed type 2 diabetes which is predominantly a metabolic dysregulation compared to type 1 diabetes which has underlying autoimmune pathology. Data from this retrospective study cannot be extrapolated to the general population. However, these data will be helpful to the physicians questioning whether a VLC diet with IF will be sustainable for their motivated patients.
To our knowledge this is the first trial showing that a VLC with IF is effective long-term. Although observational in nature with the caveat of self-reporting, the results are promising and call for larger, randomized trials.
This research received no external funding.
The authors declare no conflict of interest.
- Foster GD, Wyatt HR, Hill JO, McGuckin BG, Brill C, et al. (2003) A randomized trial of a low-carbohydrate diet for obesity. N Engl J Med 348: 2082-2090. [Crossref]
- Stern L, Iqbal N, Seshadri P, Chicano KL, Daily DA, et al. (2004) The effects of low-carbohydrate versus conventional weight loss diets in severely obese adults: one-year follow-up of a randomized trial. Ann Intern Med 140: 778-785. [Crossref]
- Volek J, Sharman M, Gómez A, Judelson D, Rubin M, et al. (2004) Comparison of energy-restricted very low-carbohydrate and low-fat diets on weight loss and body composition in overweight men and women. Nutr Metab (Lond) 1: 13. [Crossref]
- Daly ME, Paisey R, Paisey R, Millward BA, Eccles C, et al. (2006) Short-term effects of severe dietary carbohydrate-restriction advice in Type 2 diabetes- A randomized controlled trial. Diabet Med 23: 15-20. [Crossref]
- Dyson PA, Beatty S, Matthews DR (2007) A low-carbohydrate diet is more effective in reducing body weight than healthy eating in both diabetic and non-diabetic subjects. Diabet Med 24: 1430-1435. [Crossref]
- Dyson PA, Beatty S, Matthews DR (2010) An assessment of low-carbohydrate or low-fat diets for weight loss at 2 year's follow-up. Diabet Med 27: 363-364. [Crossref]
- Schwarzfuchs D, Golan R, Shai I (2012) Four-year follow-up after two-year dietary interventions. N Engl J Med 367: 1373-1374. [Crossref]
- Nickols-Richardson SM, Coleman MD, Volpe JJ, Hosig KW (2005) Perceived hunger is lower and weight loss is greater in overweight premenopausal women consuming a low-carbohydrate/high-protein vs high-carbohydrate/low-fat diet. J Am Diet Assoc 105: 1433-1437. [Crossref]
- McClernon FJ, Yancy WS Jr, Eberstein JA, Atkins RC, Westman EC (2007) The effects of a low-carbohydrate ketogenic diet and a low-fat diet on mood, hunger, and other self-reported symptoms. Obesity 15: 182-187. [Crossref]
- Shai I, Schwarzfuchs D, Henkin Y, Shahar DR, Witkow S, et al. (2008) Weight loss with a low-carbohydrate, Mediterranean, or low-fat diet. N Engl J Med 359: 229-241.
- Gjuladin-Hellon T, Davies IG, Penson P, Amiri Baghbadorani R (2019) Effects of carbohydrate-restricted diets on low-density lipoprotein cholesterol levels in overweight and obese adults: a systematic review and meta-analysis. Nutr Rev 77: 161-180. [Crossref]
- Bhanpuri NH, Hallberg SJ, Williams PT, McKenzie AL, Ballard KD, et al. (2018) Cardiovascular disease risk factor responses to a type 2 diabetes care model including nutritional ketosis induced by sustained carbohydrate restriction at 1 year: an open label, non-randomized, controlled study. Cardiovasc Diabetol 17: 56. [Crossref]
- Ormazabal V, Nair S, Elfeky O, Aguayo C, Salomon C, Zuñiga FA (2018) Association between insulin resistance and the development of cardiovascular disease. Cardiovasc Diabetol 17: 122. [Crossref]
- Lv M, Zhu X, Wang H, Wang F, Guan W (2018) Intermittent administration of a fasting-mimicking diet intervenes in diabetes progression, restores β cells and reconstructs gut microbiota in mice. Nutr Metab 15: 80.
- Kumarendran B, O'Reilly MW, Manolopoulos KN, Toulis KA, Gokhale KM, et al. (2018) Polycystic ovary syndrome, androgen excess, and the risk of nonalcoholic fatty liver disease in women: A longitudinal study based on a United Kingdom primary care database. PLoS Med 15: e1002542. [Crossref]
- Finck BN (2018) Targeting metabolism, insulin resistance, and diabetes to treat nonalcoholic Steatohepatitis. Diabetes 67: 2485-2493. [Crossref]
- DiNicolantonio JJ, OKeefe JH (2017) Added sugars drive coronary heart disease via insulin resistance and hyperinsulinaemia: A new paradigm. Open Heart 4: e000729. [Crossref]
- Mardinoglu A, Wu H, Bjornson E, Zhang C, Hakkarainen A, et al. (2018) An integrated understanding of the rapid metabolic benefits of a carbohydrate-restricted diet on hepatic steatosis in humans. Cell Metab 27: 559-571. [Crossref]
- Grandner MA, Seixas A, Shetty S, Shenoy S (2016) Sleep duration and diabetes risk: Population trends and potential mechanisms. Curr Diab Rep 16: 106. [Crossref]
- Li X, Song D, Leng SX (2015) Link between type 2 diabetes and Alzheimer's disease: from epidemiology to mechanism and treatment. Clin Interv Aging 10: 549-560. [Crossref]
- de la Monte SM (2017) Insulin resistance and neurodegeneration: Progress towards the development of new therapeutics for Alzheimer's disease. Drugs 77: 47-65. [Crossref]
- Lennerz BS, Barton A, Bernstein RK, Dikeman RD, Diulus C, et al. (2018) Management of type 1 diabetes with a very low-carbohydrate diet. Pediatrics 141: e20173349. [Crossref]