Kidney transplantation (KT) in patients with pre-existing diabetes is seldomly studied. The aim of the study was to show the 10-year experience of patients with diabetes mellitus before the surgical procedure and their clinical evolution after a year.
A retrospective cohort (2009-2018) was analyzed.The clinical and biochemical data were obtained from patient files after the transplant including a year of follow-up.For nominal variables, the data are shown in medians and interquartile ranges.The risk factor analysis was performed using logistic regression. p values of less than 0.05 were considered statistically significant. Data were analyzed with SPSSw version 25.
Patient survival was 95.34% for the total cohort versus 90.91 in diabetic patients, while graft survival was 90.25% versus 82.95%, respectively.The risk factor for lower patient survival was found related to the deceased donor (OR 8.55,95% CI 1.006-72.79, p 0.049).The risk factors for lower kidney graft survival were the deceased donor (OR 5.41,95% CI 1.40-20.85, p 0.014), delayed function (OR 19.05,95% CI 2.23-162.79, p 0.007) and acute dysfunction (OR 18.13,95% CI 2.07-158.15, p 0.009).
KT in patients with pre-existing diabetes has a good prognosis at a year. There was a lower survival rate for both the patient and the graft compared to non-diabetic recipients at our center.
diabetes mellitus, kidney transplantation, patient survival, graft survival
Peritoneal dialysis, hemodialysis, and kidney transplantation (KT) are the alternatives currently available for patients with end-stage chronic kidney disease (ESRD); among them, kidney transplantation is considered the best option [1]. Despite the above, until a few years ago KT was contraindicated in patients who had diabetic nephropathy as a cause of ESRD, today behaviors have changed and not only is the kidney transplanted, but the simultaneous pancreas/kidney transplant has increased the survival of these patients over other substitution therapies (peritoneal dialysis or hemodialysis) [2,3]. It has also been shown that patients with diabetes mellitus (DM) are less likely to receive a new kidney mainly due to the related cardiovascular comorbidity. However, the survival of patients is comparable to that of patients without DM [4].
DM is among the most frequent causes of kidney damage in Mexico and in the world, with figures ranging from 30% up to 40% in most populations [5-7]. Several studies have shown that mortality in transplanted diabetic patients is higher when compared to non-diabetic patients and may be more than double in some populations with the disadvantage greater in diabetic recipients under 40 years old [8]. The disadvantages are due to the association of DM with other diseases such as high blood pressure and obesity, which are on the rise [9]. Another important aspect is post-transplant metabolic control, for which effective measures have been established that include reducing immunosuppression and education programs aimed both at the recipient with pre-existing diabetes and at those who develop diabetes once transplanted [10-12].
Surveillance of the transplanted diabetic patient should include monitoring of fasting glucose, postprandial glucose, and glycosylated hemoglobin, and the use of ideal hypoglycemic agents for each case and insulin or both when considering treatment [13]; however, experience with the latter is still limited [13-15]. The aim of this study was to analyze the clinical outcomes in the first year after kidney transplantation in a cohort of diabetic patients accumulated over 10 years at a single center and to identify the factors associated with the survival of the recipient and the kidney graft.
Design
A retrospective cohort of diabetic recipients of a kidney transplant at the 21st Century National Medical Center (Centro Médico Nacional (CMN) “Siglo XXI”) of the Mexican Institute of Social Security in Mexico City was studied over a period of 10 years and monitored for a year after transplantation.
Outcomes
The primary outcomes (endpoints) were patient and graft survival. Secondary outcomes included acute rejections, decreased kidney function, and hospital admissions.
Patients
Patients diagnosed with type 2 DM and receiving a transplant between January 1, 2009 and December 31, 2018 were considered eligible. Also included were patients with clinical and biochemical data necessary for a baseline analysis and during the one-year follow-up period. Patients with incomplete information or who lost social security medical insurance coverage were excluded.
Data collection
The clinical records were reviewed by trained personnel and the relevant information was retrieved. Demographic information and the evolution of diabetes prior to transplantation were included, as well as the dialysis modality and treatment times, biochemical and virology data (hepatitis B, C, HIV and cytomegalovirus), and evaluation by specialists related to the management of diabetes, particularly clinical, imaging, and cardiology functional tests. The compatibility with the donor was included (blood group, lymphocytotoxicity tests, HLA locus A, B, Cw, DR, DQ, DP), the type of induction of immunosuppression, the type of anticalcineurin, in addition to the time of the start of the function of the graft. Acute graft dysfunction and cause, as well as treatment were also recorded.
Statistics
Data are presented as means and standard deviations for continuous variables, or as frequencies or medians and interquartile ranges for nominal or non-normally distributed variables. The difference of means was established with chi square or Student's “t” test. The risk factor analysis was performed using bivariate logistic regression. p values of less than 0.05 were considered statistically significant. Data were analyzed with SPSSw version 25.
During the study period (2009-2018), 1118 transplants were performed, including 89 in diabetic patients. One patient was excluded for not having information on the clinical outcomes under study. The pre-transplant data are shown in Table 1. Most of the patients had an acceptable nutritional and cardiovascular status according to the serum albumin level in normal ranges, as well as adequate values in the ejection fraction. The viral panel (hepatitis B and C, HIV) and VDRL were negative in all 88 cases. When the PPD was > 5 mm, prophylaxis with rifampicin 300 mg every 24 hours for 3-6 months was administered.
Table 1. Baseline Characteristics. 88 transplanted diabetic patients
Variable |
Mean |
SD (±) |
Median |
IQR 25-75 |
Age (years) |
47.89 |
10.39 |
49.5 |
41-55 |
Previous Transfusions |
1.11 |
1.34 |
1.0 |
0-2 |
Weight (kilograms) |
69.28 |
12.25 |
69.2 |
61-78 |
Height (meters) |
1.64 |
0.09 |
1.6 |
1.58-1.70 |
Hemoglobin (gr/dl) |
11.14 |
1.9 |
11.1 |
9.6-12.4 |
Hematocrit (%) |
33.73 |
5.98 |
33.7 |
29.85-37.75 |
Leucocytes |
7.14 |
1.99 |
7.1 |
5.8-8.5 |
Platelets |
248.24 |
74.89 |
245.0 |
201-276 |
PT (prothrombin time, sec) |
13.74 |
3.31 |
13.0 |
12.3-14.1 |
PTT (partial thromboplastin time, sec) |
30.74 |
14.11 |
29.0 |
27-31 |
Albumin (gr/dl) |
4.01 |
0.58 |
4.0 |
3.8-4.4 |
ALT (alanine aminotransferase, IU/l) |
21.64 |
10.89 |
19.5 |
14.25-26.75 |
AST (aspartate aminotransferase, IU/l) |
22.95 |
13.44 |
20.5 |
14-27 |
Uric Acid (mg/dl) |
5.79 |
1.63 |
5.8 |
4.9-6.9 |
Sodium (mEq/l) |
139.05 |
3.4 |
139.0 |
137-141 |
Potassium (mEq/l) |
5.01 |
0.83 |
4.9 |
4.4-5.5 |
Calcium (mg/dl) |
8.92 |
0.8 |
8.9 |
8.4-9.4 |
Glucose (mg/dl) |
124.07 |
57.47 |
109.0 |
86-137.5 |
Cholesterol (mg/dl) |
178.17 |
52.13 |
177.0 |
141-214 |
LVEF (%) |
62.36 |
7.68 |
62.0 |
58-68 |
SD: standard deviation; IQR: interquartile range; LVEF: left ventricular ejection fraction |
Men (67) (76.1%) predominated; blood group O + (59%), followed by group A + (26.1%), B + (12.5%) and a patient O– (1.1%) and another with AB + (1.1%). The dialysis modality was hemodialysis in 37 patients (42%), peritoneal dialysis in 41 (46.6%) and 10 underwent early transplantation (11.4%). Regarding the type of donor, 43 people received a graft from a deceased donor (48.9%) and the remaining 45 (51.1%) from living donors. Of these, 29 cases were related to donors and 16 cases were unrelated.
The findings in other studies were as follows: a) chest X-ray, normal in 62 cases (70.5%), cardiomegaly to some degree in 18 patients (22.4%) aortosclerosis in five cases (5.7%) pleural effusion in two patients ( 2.2%) and one case with an air bronchogram (1.1%); b) electrocardiogram, normal in 72 cases (81.8%), left ventricular hypertrophy in nine patients (10.2), other alterations in eight cases (9.1%); c) metabolic bone series, normal in 41 cases (46.6%), same for osteopenia (46.6%), six of them with some other changes (6.7%), d) endoscopy with normality in 38 patients (43.2%) with different findings in the rest of the patients from bulb-duodenitis, atrophic, erosive gastropathy, etc., e) voiding cystogram with normality in 69 cases (78.4%), residual urine in three cases (3.4%), and the other cases with increased and decreased bladder capacities, vesicourethral reflux in varying degrees, urethral stricture, proximal double ureter, among others, all these studies as part of the routine studies of the service.
The complementary studies considered in diabetic patients were the following: a) gastric emptying, 30 with delayed function (34.1%) and two with accelerated function (2%); b) ultrasound of iliac vessels with 60 patients with patency (68.2%), atheromatosis in seven patients (7.8%), one with vascular calcification (1.1%) and one with slow flow of the left common iliac (1.1%); the study was not carried out in 20 patients (22.8%), c) electromyography was normal in 11 patients (12.5%), the most common alteration was demyelinating axonal motor sensory polyneuropathy in 28 cases (31.8%), severe polyneuropathy in three cases (3.4%), 21 cases such as mild or moderate polyneuropathy (23.9%) and 25 patients did not undergo the study (28.4%), d) the cardiac scintigraphy with thallium was reserved for patients that the Cardiology Ward physicians considered necessary.
Surgical findings and immunosuppression are represented in Table 2, where the use of monoclonal agents for induction is included. In this case, 55 patients received basiliximab (62.5%), immunosuppression was entirely achieved with prednisone in 88 patients as a steroid, and mycophenolate mofetil as an anti-proliferative agent.
Table 2. Management related to the transplant and surgical maneuvers
Variable |
|
Frequency |
Percentage |
Induction |
|
|
|
|
Basiliximab |
52 |
59.1 |
|
Thymoglobulin |
30 |
34.1 |
Steroid |
|
|
|
|
Prednisone |
88 |
100 |
Antiproliferative |
|
|
|
Mycophenolate |
88 |
100 |
Anticalcineuritc |
|
|
|
Tacrolimus |
68 |
77.2 |
|
Cyclosporin |
20 |
22.8 |
Kidney taken |
|
|
|
Right |
44 |
50 |
|
Left |
44 |
50 |
Number of arteries |
|
|
|
1 |
53 |
60.2 |
|
2 |
26 |
29.5 |
|
4 |
1 |
1.1 |
Complications and biochemical data at the end of a year of follow-up are shown in Table 3. Creatinine at one year equal to 1.64 mg/dl, glucose of 143 mg/dl and glycosylated hemoglobin of 8.97% (the latter was not taken in all the cases).
Table 3. Clinical outcomes and biochemical parameters a year post-transplant
Variable |
|
Frequency |
Percentage |
Retarded graft function |
|
26 |
29.5 |
New surgery |
|
12 |
13.6 |
Acute graft dysfunction |
|
35 |
39.8 |
Graft survival |
|
73 |
83 |
Patient survival |
|
80 |
90.9 |
Variable |
Mean |
SD (±) |
Median |
IQR 25-75 |
Cr at a year (mg/dl) |
1.64 |
1.4 |
1.29 |
0.96-1.75 |
Glucose at a year (mg/dl) |
143.28 |
75.75 |
126 |
87-181 |
HbA1c (%) |
8.97 |
1.84 |
8.55 |
7.8-10.15 |
SD: standard deviation; IQR: interquartile range; Cr: creatinine, HbA1c: glycosylated hemoglobin |
The results of the analysis of the factors related to the survival of the kidney graft and the patient are shown in Table 4. Eight patients (9.09%) died in the period analyzed, seven lost the graft (7.95%) and 73 of 88 (82.95 %) had a functional graft at the end of the first year. The factors analyzed were: sex (taking females as the reference group), deceased donor, induction with basiliximab, delayed graft function, reoperation, and acute graft dysfunction. When graft survival and patient survival were compared in the diabetic group with the total non-diabetic patients from the same center, a difference of 4.43% and 7.3% was found for patient and graft survival, respectively (Table 5 and Figure 1).
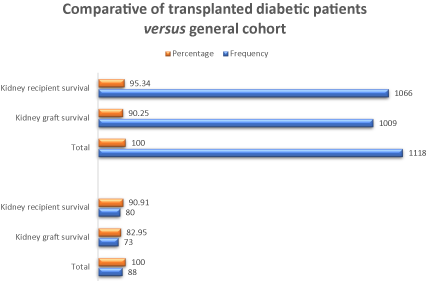
Figure 1. A comparative of transplanted diabetic patients versus general cohort of patients in relation to kidney graft and recipient survival at a year of follow-up
Table 4. Regression Analysis Survival of the renal graft
Variable |
p Value |
OR |
Confidence Interval |
Inferior |
Superior |
Sex (Female) |
0.780 |
0.830 |
0.230 |
2.960 |
Deceased Donor |
0.014 |
5.419 |
1.408 |
20.854 |
Induction with basiliximab |
0.761 |
0.837 |
0.260 |
2.630 |
Late function of the graft |
0.007 |
19.050 |
2.230 |
162.790 |
Second surgery required |
0.090 |
0.220 |
0.038 |
1.270 |
Acute graft dysfunction |
0.009 |
18.130 |
2.070 |
158.150 |
|
|
Survival of the kidney receptor |
Sex (Female) |
0.351 |
0.480 |
0.100 |
2.220 |
Deceased Donor |
0.049 |
8.550 |
1.006 |
72.790 |
Induction with basiliximab |
0.955 |
0.957 |
0.210 |
4.350 |
Late function of the graft |
0.102 |
6.540 |
0.680 |
62.380 |
Second surgery required |
0.348 |
0.256 |
0.010 |
4.420 |
Acute graft dysfunction |
1.000 |
1.000 |
0.000 |
0.000 |
OD: odds ratio; CMV: cytomegalovirus |
Table 5. Diabetic patients and center cohort comparative
Variable |
|
Frequency |
Percentage |
Diabetic patients |
|
|
|
Total |
88 |
100 |
|
Kidney graft survival |
73 |
82.95 |
|
Kidney recipient survival l |
80 |
90.91 |
Transplant cohort 2013-2017 |
|
|
|
Total |
1118 |
100 |
|
Kidney graft survival |
1009 |
90.25 |
|
Kidney recipient survival |
1066 |
95.34 |
Few studies have analyzed patient and kidney graft survival in diabetic patients whom were recipients of kidney transplantations. In this study, an integrated retrospective cohort was analyzed including 89 patients diagnosed with diabetes mellitus (DM) prior to transplantation, a cohort followed for 10 years and later undergoing transplantation. Patient survival was 90.91% (80 of 88) participants a year after transplantation, and graft survival was 82.95% (73 of 88) in the same period. Compared with a cohort of non-diabetic patients from the same center, lower patient and graft survival were found, 4.43% and 7.3%, respectively. The factors that influenced this decrease were receiving a kidney from a deceased donor, delayed graft function, and acute graft dysfunction. Creatinine at a year was higher than in non-diabetic patients with the same monitoring time and metabolic control outside the accepted range, glycated hemoglobin was 8.97% and fasting glucose was 143.28 mg/dl.
The increasing number of diabetic patients receiving a kidney transplant raises many questions and the comparison between diabetics and non-diabetics is required. In a study by Rocha A, et al. [16] in which 62 diabetics were compared to 62 non-diabetics, creatinine (Cr) values a year after transplantation were 1.3 mg/dl in both groups; however, in our study it was 1.64 mg/dl, similar to that of the non-diabetic cohort. In this study, 29.5% of the patients had delayed graft function, which was associated more with the deceased donor than with being diabetic. Acute graft dysfunction was found in 39.8% of the cases, the majority due to rejection, this percentage was less than 24.2% shown in that study. Survival at one year was not shown, so it cannot be compared with our study.
The study by Hee, et al. [17] is possibly the one most similar to ours. However, it does have some differences: among them: type of donor, in that study all grafts were from living donors, while in ours 48.9% were from deceased donors. This difference is relevant since in the multiple logistic regression analysis it was found to be significant as a risk for graft survival (OR = 5.419, 95% CI 1.408-20.854, p = 0.014), as well as for recipient survival (OR = 8.55, 95% CI 1.006-72.790, p = 0.049). Our study does not have an adequate control group, we only have the graft and patient survival at a year to compare them with the rest of the cohort in the center; the two rates were higher in the cohort of non-diabetic patients. In the study by Hee, et al. survival at a year was 97.2% and 93.3% in non-diabetic and diabetic populations, respectively, and they concluded that these are favorable results and that diabetes, infections, and cardiovascular disease did not significantly influence kidney graft failure. In this study, the deceased donor, the delayed function of the graft (related to the type of donor) and the acute dysfunction due to any cause had an impact on graft survival, while only having a deceased donor was significant in patient survival.
For many years, the diabetic patient only had access to peritoneal dialysis or hemodialysis, as treatment options for ESRD. Since the first transplant attempts in diabetic patients, good results have been demonstrated, similar to those of non-diabetic patients, despite which accessibility to transplantation is still limited. Studies such as that by Keivinen M. et al. [18] in 2018, show that the probability of receiving a kidney transplant is lower in diabetics, which could not be fully explained by the characteristics and comorbidities of the patient; however, the 5-year survival was comparable to that of non-diabetic patients.
The monitoring of the metabolic control of the post-transplant patient is generally undemanding and the use of glycated hemoglobin (HbA1c) is rare, either to assess the current degree of control, or its ability to predict pre-diabetes and post-transplant diabetes mellitus (PTDM) associated or not with medications. In the study by Tillman F, et al. [19], it was found that the HbA1c level at 90 days after transplantation is able to predict an altered glucose metabolism at a year, and in the long term, it can serve as a predictor of diabetes and allow for early interventions to prevent PTDM if the level is over 6.2% (sensitivity = 0.97 and specificity = 1.00). In a study by Ussif, et al. [20], it was concluded that the combined use of fasting glucose and HbA1c values in patient follow-up are an applicable diagnostic strategy in patients at risk for PTDM without the need for a glucose tolerance curve after a year of follow-up (area under the ROC curve = 0.858). In our study, HbA1c was measured, but, although elevated levels were detected (median = 8.55%, IQR 7.8-10.15%), the number of measurements was insufficient for analysis.
The study had certain limitations. There was a multidisciplinary group in the control of the patients, there was no systematic nutritional surveillance, nor was guidance given to stimulate lifestyle changes, factors that have a decisive influence on the development of comorbidities in the diabetic patient.
Kidney transplantation in patients with pre-existing diabetes has a good prognosis at a year of follow-up, although it has a lower survival rate for both the patient and the graft compared to non-diabetic patients at our center. The deceased donor is also a good option; however, this is the most significant risk factor for patient survival. The significant risk factors for decreased kidney graft survival were the deceased donor, delayed graft function, and acute graft dysfunction. Studies are required that consider interventions in lifestyle, a healthy diet, and frequent monitoring of metabolic control to improve transplantation outcomes in diabetic patients.
Based on our findings, we thoroughly recommend searching for an insulin resistance syndrome. Another of the proposals, and supported by other studies is to carry out a strict control of glycated hemoglobin, fasting serum glucose, and postprandial serum glucose. We consider low doses of steroids, prevention of infectious processes, optimizing the control of arterial hypertension, hypertriglyceridemia, obesity and hyperuricemia within some other metabolic conditions important to follow in patients.
The authors have no conflicts of interest and have followed international ethical guidelines for the protection of patients' personal data.
- King H, Aubert R, Herman WH (1998) Global burden of diabetes, 1995–2025. Diabetes Care 21: 1414-1431. [Crossref]
- Annual report (2006) USRDS.
- Dinavahi R, Akalin E (2007) Preemptive Kidney Transplantation in Patients with Diabetes Mellitus. Endocrinol Metab Clin N Am 36: 1039-1049. [Crossref]
- Kervinen M, Lehto S, GroÈnhagen-Riska C, Finne P (2012) Effect of vascular comorbidities on survival of type 2 diabetes patients on renal replacement therapy. Am J Nephrol 36: 509-515. [Crossref]
- ANZDATA Registry (2014) Incidence of end stage kidney disease. Adelaide: Australia and New Zealand Dialysis and Transplant Registry.
- McDonald S, Russ G (2002) New patients commencing treatment in 2001. Adelaide: Australia and New Zealand Dialysis and Transplant Registry.
- Chapman J, Wright J (2014) Transplant Waiting List. Adelaide: Australia and New Zealand Dialysis and Transplant Registry.
- Lim W, Wong G, Pilmore H, McDonald S, Chadban S (2017) Long-term outcomes of kidney transplantation in people with type 2 diabetes: a population cohort study. Lancet Diabetes Endocrinol 5: 26–33 [Crossref]
- Sulanc E, Lane JT, Puumala SE, Groggel GC, Wrenshall LE, et al. (2005) New-onset diabetes after kidney transplantation: an application of 2003 International Guidelines. Transplantation 80: 945-952. [Crossref]
- Othman N, Gheith O, Al-Otaibi T, Abdou H, Halim M, et al. (2019) Role of Diabetes Education Program in Controlling Posttransplant Diabetes in a Recent Renal Transplant Bodybuilder: Case Report and Review of the Literature. Exp Clin Transplant 17: 169-171. [Crossref]
- Geraci MJ, Cole M, Davis P (2011) New onset diabetes associated with bovine growth hormone and testosterone abuse in a young body builder. Hum Exp Toxicol 30: 2007-2012. [Crossref]
- Boregowda K, Joels L, Stephens JW, Price DE (2011) Persistent primary hypogonadism associated with anabolic steroid abuse. Fertil Steril 96: e7-e8. [Crossref]
- Shapey L, Summers A, Yiannoullou P, Bannard-Smith J, Augustine T, et al. (2019) Insulin therapy in organ donation and transplantation. Diabetes Obes Metab 21: 1521-1528.
- Geer EB, Islam J, Buettner C (2014) Mechanisms of glucocorticoid-induced insulin resistance: focus on adipose tissue function and lipid metabolism. Endocrinol Metab Clin North Am 43: 75-102. [Crossref]
- Aljiffry M, Hassanain M, Schricker T (2016) Effect of insulin therapy using hyper-insulinemic normoglycemic clamp on inflammatory response in brain dead organ donors. Exp Clin Endocrinol Diabetes 124: 318-323. [Crossref]
- Rocha A, Malheiro J, Marins L, Fonseca I, Dias L, et al. (2013) Kidney Transplantation in Type 2 Diabetic Patients: A Matched Survival Analysis. Transplantation Proceedings 45: 2141–2146.
- Hee C, Kim H, Don S, Jang M, Kim W, et al. (2018) Outcomes of living donor kidney transplantation in diabetic patients: age and sex matched comparison with non-diabetic patients. Korean J Intern Med 33: 356-366. [Crossref]
- Kervinen MH, Lehto S, Helve J, GroÈnhagen-Riska C, Finne P (2018) Type 2 diabetic patients on renal replacement therapy: Probability to receive renal transplantation and survival after transplantation. PLoS ONE 13: e0201478. [Crossref]
- Tillman F, Rump L, Quack I (2018) HbA1c levels at 90 days after renal transplantation in non-diabetic recipients predict de novo pre-diabetes and diabetes at 1 and 3 years after transplantation. Int Urol Nephrol 50: 1529-1534. [Crossref]
- Ussif A, Åsberg A, Strøm T, Nordheim E, Hartmann A, et al. (2019) Validation of diagnostic utility of fasting plasma glucose and HbA1c in stable renal transplant recipients one year after transplantation. BMC Nephrol 20: 12. [Crossref]
Editorial Information
Editor-in-Chief
Dr. Abdullah H. A. Almalki
Section Head of Nephrology, Department of Medicine, KAMC, Saudi Arabia
Article Type
Research Article
Publication history
Received date: November 14, 2020
Accepted date: November 24, 2020
Published date: November 27, 2020
Copyright
©2020 Rojas-Arzola LJ. This is an open-access article distributed under the terms of the Creative Commons Attribution License, which permits unrestricted use, distribution, and reproduction in any medium, provided the original author and source are credited.
Citation
Rojas-Arzola LJ, Pérez RE, Cruz-López M, Hernández-Rivera JCH, Paniagua-Sierra R (2020) Kidney graft survival at a year, clinical evolution and associated factors in transplant patients with pre-existing diabetes. Trends in Transplant 14(1): DOI: 10.15761/TiT.1000287