Abstract
We discuss the superiority of the high order tensor approach to HARDI, or High Angular Resolution Diffusion Tensor Imaging, over the probabilistic tractography approachesand the lower order tensor model (DTI, or Diffusion Tensor Imaging) discussed inProbabilistic tractography methods, which utilize Monte Carlo sampling and bootstraptechniques, have a distinct disadvantage inherent in the need for assumed arbitrary priors in light of unknown circumstances (i.e., the obscure nature of the connective structureof the brain). In such situations, fewer model assumptions make more sense. Thismotivates our proposed method, which uses a semi-parametric high order tensor functionwith the ability to differentiate between multiple fiber directions. The ability to handlemultiple or crossing fibers is the main advantage to the high order approach over DTI.Since it is known that such instances commonly occur in white matter, there is a clear needfor a method which can effectively model this phenomenon. In this paper we discuss theadvantages and disadvantages of the current works to highlight the reasons medics wouldimprove analysis through our method. We also discuss the evaluation of performance onsimulated and brain data.
HARDI
In the calculation of the model under the Bayesian approach, one must choose a "prior"distribution to combine with one's data, assumed to be the true distribution of the parameter of interest prior to the consideration of data. Unfortunately, these arbitrary priors arenot robust and cannot perform well over a wide range of data. Situations will thereforeinevitably arise in which our data disagrees with our prior belief.
Since the detailed anatomy of the brain is still uncharted in terms of connectivity dueto high amount of noise, this approach runs a high risk for misplacement of curve estimatesand so called "phantom images". The prior information for one region is not guaranteedto be applicable to any other region. Hence repeated sampling methods attempting toquantify uncertainty in the model may be used on an incorrect basis.
In light of this it makes sense for a completely data driven, or non-parametric, approachfor the sake of robustness in obscure data one deals with in diffusion MRI analysis. To thisend, we move towards a semi-parametric high order tensor model approach of the estimationof trajectories. Non-parametric or semi-parametric methods have inherited robustness tomisspecification because they are completely data driven (or nearly completely) and fewerassumptions are made. The methods in [1-3] for DTI and HARDI models, both semi-parametric approaches, have this advantage.
We provide a tracing of the fiber along with surrounding confidence ellipsoids so thatscientists can better understand where the truefiber is located. Since the error in rawdata measurements can result in a large error in curve estimates, we assess how muchby following the curve with a surrounding confidence band. This method would enhanceMRI analysis by helping to solidify confidence in correct interpretations of fiber locationsby allowing the scientist to supplement information from original images with a region ofconfidence surrounding the regions of interest, as they indicate how reliable the location ofthe estimated fiber is (the tighter the confidence band, the more confident we are in thatbeing the true location of the fiber). This is a one-step tracing process of the curve withits surrounding confidence ellipsoids, so that our method has the benefit of no iterativesampling. This makes it very advantageous in a computational sense. That is, we arecarrying easily interpretable uncertainty through from the acquisition of the raw data withus to the curve tracing to obtain closed form estimates of tract uncertainty as opposed tothe Bayesian approach, in which one needs to construct thousands of empirical curves inorder to estimate the posterior curve distribution or perform repeated sampling methodsfor uncertainty quantification.
Another component of our method is the ability to perform hypothesis tests of whethertwo points in the brain are connected. Given some starting point, we can use propertiesof our curve estimators to construct a hypothesis test that the curve starting at the giveninitial point will pass through some other point of interest. One can test regions of interestor exhaustively to supplement analysis and improve interpretability of images.
While these advantages are pertinent to the approaches of both DTI and HARDI, highorder tensor model approach can trace branching or intersecting curves. As mentionedbefore, this is highly preferred since it is known such branching and crossing phenomenonsexist in the brain. In the paper [4] the high order tensor model is compared to the standardmatrix model in all circumstances of fiber thickness, signal-to-noise ratio and crossingfibers. It also yields tighter confidence ellipsoids by as much as a factor of 10 across allcombinations of these parameters and by a factor of up to 1,000 for high signal-to-noiseratios. This is a huge advantage, since C, Y, or X shaped patterns (the ones that we observethe performance of our methods on) are commonly observed. Sequential combinations ofthese patterns can create any pattern one might expect to stumble across during analysis(or could imagine anatomically exists).
We first evaluated our method on simulated data. The data was simulated in a mannermimicking the information provided by the MRI image. We employed our method to assessits ability to trace common patterns. Since most tracings in the brain can be combined bythese sequential C, Y, or X patterns, this makes sense to simulate such patterns and applyour method to assess how well we are able to trace the patterns. It is worth mentioningthat the simulation of data for practical purposes is debatable due to the question of how torealistically simulate noise. Thus, another artificial dataset which simulates realistic fibersis the so-called tractometer[5]. A competition between different approaches revealed nosingle winner but showed how a fair comparison can be performed. Our approach performedexcellent on this dataset using just the DTI model, see [6].
Our method performs well on brain data as well. In the paper[1] we summarizedthe analysis of the region of the white matter C-shaped area in the brain of the corpuscallosum. The performance of the high order model yielded estimated curves consistentwith the known anatomy of this region of the brain with small covariance. The method iscurrently being further used to explore the detailed anatomy of other regions of the brainand a paper is in preparation. For example, we applied our method to a diffusion-weightedimaging (DWI) dataset collected from a healthy adult brain on a GE 3T Signal HDx MRscanner (GE Healthcare, Waukesha, WI) with an 8-channel head coil. The subject signedthe consent form approved by the Michigan State University Institutional Review Board.DWI images were acquired with a dual spin-echo echo-planar imaging (EPI) sequence for7 minutes and 45 seconds with the following parameters: 54 contiguous 2.4-mm axial slicesin an interleaved order, FOV = 22 cm-by-22 cm, matrix size = 128 -by- 128, number ofexcitations (NEX) = 1, TE = 86.6 ms, TR = 15.5 s, 25 diffusion-weighted volumes (oneper gradient direction) with b = 1000 s/mm2, 4 volumes with b = 0 and parallel imagingacceleration factor = 2. Figure 1 summarizes our findings. Figure 1(a) shows the tracingof a fiber across a voxel at the central body of corpus callosum. The fiber is shown inred surrounded by the confidence band in black. Figure 1(b) shows the tracing of a fiberconnecting the right and left lateral occipital cortical regions. The seed voxel is at thewhite matter near the right lateral occipital cortex. The fiber is shown in red surrounded
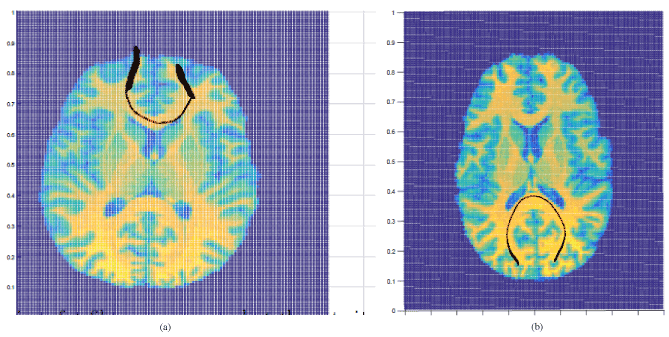
Figure 1. Real examples of images obtained via HARDI with estimated integral curves andconfidence ellipsoids. A black 95% confidence band surrounds the estimated fiber.(a) Tracing of a fiber across a voxel at the anterior body of corpus callosum is in red. (b) Tracing of a fiber connecting the right and left lateral occipital cortical regions is in red.
by the confidence band in black. We use 95% confidence level for both images[7].
Conclusion
Our high order tensor model approach is an improvement over the existing standard matrix model approach in terms of both tightness of confidence bands and performance forconnectivity testing. It has the advantage of no arbitrary assumptions in the presence ofhighly unknown situations and does not require iterative sampling. This sensible and computationally inexpensive approach can greatly improve the analysis of brain connectivityby instilling more confidence in the interpretation of images. We make now a move towardan entirely non-parametric approach as a direction of future research work.
Acknowledgment
The authors report no conict of interest. Research was partially supported by the NSFgrant DMS-1612867 and by AGEP supplement, NSF grant DMS- 1742881.
References
- Carmichael O, SakhanenkoL (2015) Estimation of integral curves from high angular resolution diffusion imaging (HARDI) data. Linear Algebra and its Appl473: 377-403. [Crossref]
- Assemlal HE., Tschumperle D, Brun L, Siddiqi K (2011) Recent advances in diffusion MRI modeling: Angular and radial reconstruction. Med Image Anal 15:369-396.[Crossref]
- CarmichaelO,Sakhanenko L (2016) Integral curves from noisy diffusion MRI data with closed-form uncertainty estimates. Statistical Inference for Stochastic Processes 19: 289-319.
2021 Copyright OAT. All rights reserv
- Sakhanenko L, DeLaura M (2017) A comparison study of statistical tractography methodologies for Diffusion Tensor Imaging. International Journal of Statistics:Advances in Theory and Applications1: 93-110.
- Daducci A, Canales-RodrguezE, Descoteaux M, Garyfallidis E, Gur Y, et al. (2014) Quantitativecomparison of reconstruction methods for intra-voxel fiber recovery from diffusion MRI. 33: 384-399. [Crossref]
- Sakhanenko L (2015) Using the Tractometer to assess performance of a new statistical tractography technique. Journal of Nature and Science1: 1-12.
- Sakhanenko L, DeLaura M (2017) A comparison study of statistical tractography methodologies for Diffusion Tensor Imaging. International Journal of Statistics:Advances in Theory and Applications1: 93-110.