Abstract
The metal packaging is ideal for storing canned food especially tinplate. Due to the acid nature of the canning solution, the interaction of the food with the metal packaging determines its shelf life, as there may be corrosion, which occurs when there is dissolution of the metals present in the packaging. The layer of varnish of these packages aims to minimize interactions of the metals with the food thus increasing the expiration with the storage time, as well as to evaluate the role of the lacquer layer (varnish) in reducing the corrosion rate. Firstly, the pH, conductivity, °Brix, viscosity, density and NaCl concentration of the canning solution corn were determined and the values were 6.05; 35.8 mS/cm; 6%; 1.26 cP; 1.024 g/mL; 9000 ppm, respectively. The metal can microstructural characterization was made by optical microscopy (OM) and X-ray diffraction (XRD). The linear polarization technique was used to identify the corrosion rate (Tc) of cans. The Tc increased significantly when the varnish was removed, and the lid was the region of the can that showed the highest corrosion rate, reaching 0.760 mm/year in the absence of varnish which reduced the corrosion by approximately 25 percent. The Fe contents on the third day of analysis showed values within the Brazilian legislation. The increase of the NaCl concentration and the pH medium directly influence the increase of the corrosion rate.
Key words
electrochemical corrosion, tinplate, green corn, linear polarization
Introduction
Packaging is essential to preserve the physical, chemical and organoleptic properties of the product, increasing its useful life and ensuring safe consumption [1-11].
There is several food packaging, one of them is the metal packaging, which is widely used due to its barrier properties to environmental factors such as gases, humidity, micro-organisms and light, in addition it is environmentally and economically viable. The metal material most commonly used in the manufacture of food cans is tinplate, which is highly resistant, malleable and with good weldability. It is also easily recycled, what makes it ideal for food and beverage packaging. However, it can be kneaded during transportation and commercialization being able to suffer corrosion [6-11].
The tinplate layer is composed of: base steel leaf coated on both sides by a layer of tin (which gives greater strength), FeSn2 alloy, free Sn layer, passivation oxide films and an internal varnish layer. The interaction of the package with the product may occur and it is characterized by the dissolution of the metals constituting the package [2-6] which is influenced by food matrix, oxygen concentration, pH, time, temperature of storage, and presence of oxidizing reagents [10]. This phenomenon is called metal corrosion and it is minimized by the internal layer varnish of the metal can.
The good performance varnish depends on its thickness and on its adhesion on the sheet. However, if the protective layer breaks down the interaction of the metal with the food will occur, resulting in a galvanic cell where the food is the electrolyte, favoring the migration of metals or even of the varnish. In this electrochemical process the oxidation of metals (corrosion) is one of the most common reactions that can occur, and it compromises the properties of food [1].
The green corn of the species Zea mays L. is a large consumed food in Brazil and in the world, being one of the three cereals, most cultivated today. It is considered an energy food because of its predominantly carbohydrate and lipid composition and it is also a source of minerals, such as calcium (2 mg.100 g-1) and magnesium (20 mg.100 g-1). Thus, the concern with the storage corn becomes important, as like all food, it has characteristics that must be preserved to being fit for consumption [9-12]. Foods that are packaged in canning solutions, such as canned green corn, study material of this work, have acid character and a considerable amount of dissolved salts, their interaction with the metallic packaging often determines their shelf life and may be corrosive [3]. Due to these factors it becomes important to evaluate the corrosion of these packages to ensure the product quality.
When purchasing a product packaged in metallic packaging it is essential to verify if it is undamaged in its structure to avoid possible corrosion. The food conditions storage (such as pH, temperature, salts and integrity of the varnish layer) can favor corrosion. Thus, it is important to study the storage conditions and the evolution of this possible corrosion with the time.
This work aims to study the corrosion of metallic containers of green corn and their evolution with storage time, as well as to evaluate the role of the varnish layer in corrosion rate.
Materials and methods
List of symbols
L-V1: lid varnished in the first day of experiment;
L-V2: lid varnished in the second day of experiment;
L-V3: lid varnished in the third day of experiment;
L-UV1: lid unvarnished in the first day of experiment;
L-UV2: lid unvarnished in the second day of experiment;
L-UV3: lid unvarnished in the third day of experiment;
BD-V1: body varnished in the first day of experiment;
BD-V2: body varnished in the second day of experiment;
BD-V3: body varnished in the third day of experiment;
BD-UV1: body unvarnished in the first day of experiment;
BD-UV2: body unvarnished in the second day of experiment;
BD-UV3: body unvarnished in the third day of experiment;
BT-V1: bottom varnished in the first day of experiment;
BT-V2: bottom varnished in the second day of experiment;
BT-V3: bottom varnished in the third day of experiment;
BT-UV1: bottom unvarnished in the first day of experiment;
BT-UV2: bottom unvarnished in the second day of experiment;
BT-UV3: bottom unvarnished in the third day of experiment.
For the study of the corrosion, green corn can of the same brand were used. Physical-chemical characterizations of the canning solution were carried out. The micro-structural and electrochemical characterizations of the varnished (V) and unvarnished (UV) metal cans were analyzed.
Physical chemical characterization of the canning solution
The canning solution was characterized by measurements of pH, viscosity, ºBrix, conductivity and density. The NaCl concentration was obtained from the argentiometric titration. The pH was determined using the HANNA pH meter and the conductivity acquired by the MULTIPARAMETROS Edge Hl2020 meter. The viscosity was obtained using the Ostwald viscometer and the degree Brix was made in the Abbe refractometer. The density was made by the pycnometer. The measurements were performed in triplicate for the calculation of the mean and the standard deviation.
The detection of iron in the canning solution was determined by the atomic absorption spectrophotometry by the AA-1275A Intralab spectrophotometer. The measurements were done on the third day of experiment for the body, lid and bottom of the packaging in the presence and absence of varnish.
Electrochemical analysis
The corrosion rate of the metal packaging was determined by linear polarization in an Autolab PGSTAT 101 Potentiostat/Galvanostat in a scanning range of -0.1 to 0.1 V, with a velocity of 0.001 V/s. The Tafel curves were obtained and treated using NOVA software to determine the corrosion rate (Tc). The measurements were performed in a 50 mL electrochemical cell composed of three electrodes, according to Figure 1. The reference electrode used was Ag/AgCl and the auxiliary electrode was platinum. For the working electrode the three parts of the green corn can (lid, body and bottom) were used in the presence and absence of varnish with an active area of 1 cm2. The electrolyte used was the green corn solution. The varnish on the packaging was removed with acetone.
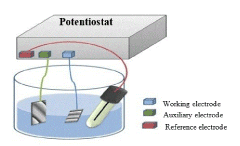
Figure 1. Scheme of three-electrode cell used in electrochemical measurements
The corrosion was evaluated for three days for different parts of the can (lid, body and bottom) in the varnished and unvarnished canned corn sample.
Aqueous solutions of different sodium chloride (NaCl) concentrations (1000, 5000, 9000 and 10000 ppm) were used as electrolyte to analyze the effect of this salt in corrosion rate.
Electrochemical analysis via linear polarization was also performed to investigate the influence of pH on corrosion rate. For this purpose, a NaCl electrolyte of 9000 ppm was used (approximate value of the NaCl concentration of the canning solution). From this solution the pH was changed to 4, 5, 7 and 8. These analyses were also performed for all parts of the can V and UV during 3 days.
Microstructural characterization of metal packaging
The electrodes were analyzed with and without varnish in the first and in the last day of the experiment. These samples were also characterized by X-ray diffraction on a Shimadzu XRD-6000 with Cu K?? irradiation, a Cu filter, and scanning speed of 2°min−1.
Results and discussion
Physical chemical characterization of canning solution
Table 1 shows the results of Brix degree, pH, conductivity, density, viscosity and NaCl concentration of green corn canning solution.
Table 1. Physicochemical parameters of green corn canning solution
Physicochemical
parameters |
Results* |
Standard
deviation |
pH |
6.05 |
± 0.015 |
Conductivity (mS/cm) |
35.8 |
±1.31 |
Density (g/mL) |
1.024 |
±1.27e-5 |
ºBrix (%) |
6.0 |
- |
Viscosity (cP) |
1.26 |
±1.63e-3 |
NaCl Concentration(ppm) |
9000 |
- |
*average of the measures.
The canning pH is slightly acidic, and it can cause corrosion due to the presence of chlorides and acids in this medium [3]. Therefore, it requires an adequate choice of the internal varnish of the packaging. The presence of salt in the canning solution increases its conductivity and contributes to the corrosion process.
Table 2 shows the iron concentrations in the third day of experiment for the lid, body and bottom varnished (V) and unvarnished (UV) cans.
Table 2. Iron concentration of the samples in the third day
Sample |
Fe (mg/kg) |
Lid- V |
48.96 |
Body- V |
39.67 |
Bottom- V |
39.41 |
Lid- UV |
51.80 |
Body- UV |
40.40 |
Bottom- UV |
64.87 |
The Brazilian Legislation does not establish limit for the iron, since this is a fundamental element for the human diet [3]. Therefore, increasing its concentration reveals the oxidation development of the metal packaging, causing the reduction of the vacuum and, possibly, the sensory alterations of the conditioned product [4]. Iron concentrations higher than 40 mg.kg-1 may cause changes in taste in canned peas and may be considered a limiting factor for shelf-life [3]. The increase of iron concentration indicates that the varnish has lost its protective characteristics, which leads the product to metallic contaminations, due to corrosion processes that can occur over the time [5].
Electrochemical analysis
Figure 2 shows the cor2021 Copyright OAT. All rights reserv for V and UV samples. For the electrochemical measurements the electrolyte was the green corn canning solution.
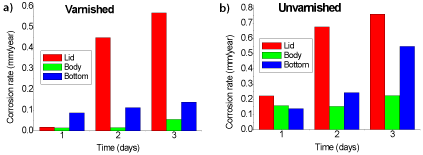
Figure 2. Corrosion rate for the three parts of the can (a) V (b) UV
According to Figure 2a it is observed that there was an increase of Tc values in all parts of the can with varnish over the time. The lid varnish and unvarnished had the highest corrosion rate on the third day of experiment, 0.568 mm/year and 0.760 mm/year, respectively. The Tc value of all unvarnished samples was higher as expected. The varnish layer reduced the Tc by approximately 25 percent as also evidenced by Costa et al. [1]. They also found the lid with the highest Tc (1.7 mm/year) when analyzing canned pea packaging. For this purpose, it is fundamental to maintain the quality of the varnish of metal food packaging in order to have a good quality of the product.
Figures 3 and 4 show Tafel curves of the metal lid with and without varnish on the third day of experiment.
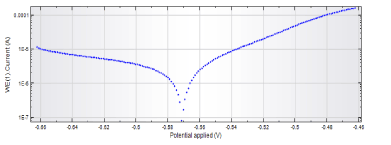
Figure 3. Curves Tafel of the metal lid varnished
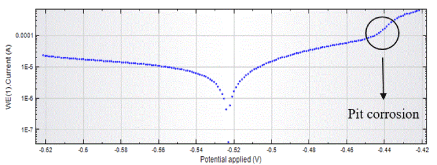
Figure 4. Curves Tafel of the metal lid unvarnished
Corrosion rate is influenced by several factors, such as the storage time of the packed food, the storage temperature and the pH. The value may also be different for each part of the can. This may be due to the different compositions of the packaging parts. In addition, the varnishes layers of can have different thicknesses and porosities, besides the possible presence of risk and "defects" in the surface. These factors also influence the Tc values [1-3].
Figure 4 shows a significant increase in current from -440 mV. This fact shows possible pit corrosion. In addition, the presence of salts in the canning solution contributes to this effect.
To evaluate the influence of NaCl on the Tc value, measurements were made at different concentrations of the salt, as shown in Figure 5.
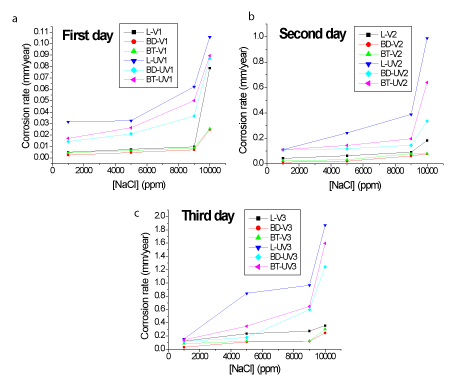
Figure 5. Tc at different NaCl concentrations during 3 days of experiment. (a) First day (b) Second day (c) Third day
It can be observed that the corrosion rate increases with increasing NaCl concentration in all samples over the time. However, it is possible to observe that from 9000 ppm there is an abrupt increase of Tc values highlighting possible pit corrosion. For varnished samples this behavior is less pronounced, due to the barrier for charge transfer promoted by varnish insulating properties.
Figure 6 shows the corrosion rate as a function of pH, using as electrolyte NaCl solution at a concentration of 9000 ppm, to evaluate the effect of pH on Tc.
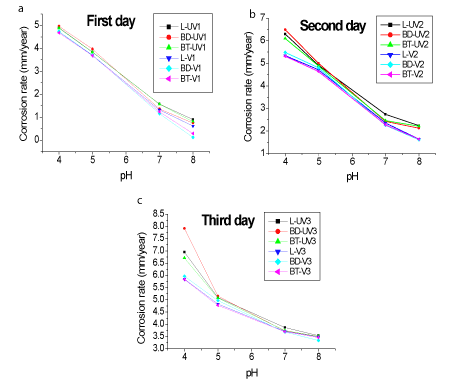
Figure 6. Tc rate versus pH, using as electrolyte NaCl solution at a concentration of 9000 ppm. (a) First day (b) Second day (c) Third day
The Tc has a higher value in acidic pH. The pH value directly influences the corrosion rates [8]. At lower pH the can body is less resistant to corrosion. At pH close to that of the solution canning (pH=6), the metallic lid had a higher Tc value (approximately 4, 87 UV).
The variation in NaCl concentration caused greater differences between the corrosion rates than a variation of pH. In the last case, all samples show close behavior.
Samples with pH=6 and 9000 ppm NaCl concentration (Figure 6) show Tc values higher than the values presented for canning solution (Figure 2). Probably this fact is due to the presence of buffering and antioxidants agents in the solution that help in the corrosion reduction. Future studies will be carried out to characterize the presence of these substances.
Therefore, it is important for the consumer paying attention to the time the product remains in the can, since Tc tends to increase with time, a fact that was observed in a few days. It is also important to check the integrity of the can, as even partial breakage can cause corrosion.
Figure 7 shows the diffractograms of the sample V and UV layers. It is possible to observe the (110) and (200) crystallographic planes relating to the carbon steel (base material of the tinplate) in bottom can (Figure 7a). Figure 7b shows Sn and SnO peaks, both in the presence and absence of the varnish layer for the lid. During the varnish removal process, the Sn layer may have been removed, contributing to the increase of Tc value as observed in the Figure 2.
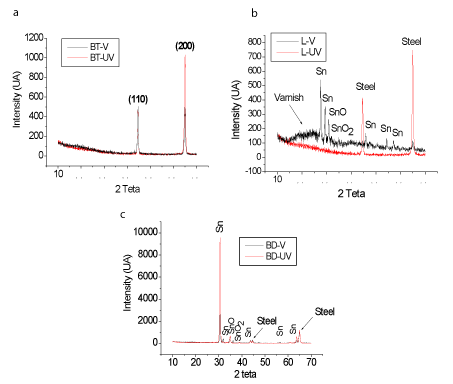
Figure 7. Diffractogram of the parts of the can: (a) bottom V e UV, (b) lid V e UV e (c) body V e UV
In Figure 7c, it is observed peaks referring to Sn and SnO in both varnished and unvarnished samples. Apparently, the better crystallization of Sn layer is responsible for the best performance in relation to corrosion resistance as shown in Figure 2.
Conclusions
The green corn canning solutions presented pH 6.05 and conductivity 35.2 mS/cm. The crystallographic peaks related to Sn and SnO were evidenced by XRD in varnish and unvarnished body and in the lid varnished. From the linear polarization, it was verified that the lid showed highest Tc, 0.760 mm/year and 0.568 mm/year for the sample unvarnished and varnished, respectively. Tc increases significantly when the varnish is removed (about 25 %). The varnish is very important in the reduction of corrosion, since a small wear can compromise the quality of the food. The Fe contents on the third day of analysis presented values according to the Brazilian legislation. The NaCl concentration and the pH of the medium directly influence the increase of the corrosion rate.
Acknowledgements
The authors wish to thank the Federal University of São João del Rei and CNPq for the financial support.
References
- Costa IM, Taroco CG, Garcia EM, Melo JOF, Souza AG, et al. (2016) Electrochemical Corrosion study via linear polarization in peas can. Scientific Electronic Archives 9: 145- 150.
- Dantas ST, Soares BMC, Saron ES, Gatti JAB, Kiyataka PHM (2010) Avaliação de latas de folha de flandres para acondicionamento de leite condensado. Braz J Food Technol 13: 52-59.
- Dantas ST, Saron ES, Gatti JAB, Kiyataka PHM, Dantas FBH (2011) Estabilidade de ervilha em conserva em embalagem metálica com baixo revestimento de estanho. Braz J Food Technol 14: 249-257.
- Dantas ST, Gatti JAB, Dantas FBH, Saron ES, Kiyataka PHM (2012) Estabilidade de extrato de tomate em embalagens metálicas com baixo revestimento de estanho. Braz J Food Technol 15: 228-236.
- Felipe AMPF (2008) Estudo da interação produto embalagem em folha-de-flandres aplicada à polpa de cupuaçu (Theobroma grandiflorum). Tese de Doutorado – Universidade Estadual de Campinas. Campinas, pp: 74.
- Jorge N (2013) Embalagens para alimentos. São Paulo: Cultura Acadêmica: Universidade Estadual Paulista, Pró-Reitoria de Graduação.
- Landim, APM, Bernardo CO, Araujo Martins IB, Francisco MR, Santos MB, et al. (2016) Sustentabilidade quanto às embalagens de alimentos no Brasil. Polímeros: Ciência e Tecnologia.
- Mayouf AA, Juhaiman LA, Subaybani A (2008) Corrosion of aluminum in ascorbic, citric and tartaric acids with and without chloride ions. Anti-Corrosion Methods and Materials 55: 79-85.
- Paes MCD (2006) Aspectos físicos, químicos e tecnológicos do grão de milho. Sete Lagoas, MG: Embrapa Milho e Sorgo.
- Perring L, Basic-dvorzak M (2002) Determination of total tin in canned food using inductively coupled plasma atomic emission spectroscopy. Anal Bioanal Chem 374: 235-243. [Crossref]
- Soares NFF, da Silva WA, dos Santos Pires AC, Camilloto GP, Silva PS (2015) Novos desenvolvimentos e aplicações em embalagens de alimentos. Ceres.
- Unicamp ON (2006) TACO–Tabela Brasileira de Composição de Alimentos. Editora: Fórmula, Campinas, SP.


