Background: Preservation of residual renal function (RRF) is an important factor in achieving adequate peritoneal dialysis (PD) therapy for patients with end-stage renal disease (ESRD). We investigated whether dietary salt restriction was effective during conservative therapy as a factor to prevent decreased RRF after starting PD therapy.
Methods: We retrospectively observed 30 patients introduced to PD in a single center. To investigate the relationship between effects of a salt diet and decreased RRF in PD patients for the first year after starting PD, we divided patients into two groups according to salt intake before starting PD therapy: Group 1, <6 g/day; and Group 2, ≥6 g/day. Sodium intake was calculated using samples from 24-hour urinary collection and/or 24-hour peritoneal dialysate collection.
Results: Before starting PD, residual renal Kt/V (rKt/V) and CCre (rCCre) were significantly lower in Group 1 than in Group 2 (p<0.001 and p<0.005, respectively). Normalized protein-equivalent of nitrogen appearance was also significantly lower in Group 1 than in Group 2 (p<0.001), suggesting that Group 1 might also maintain good control of protein. Moreover, compared with Group 2, decline rates in rKt/V and rCCre during the first year were significantly lower in Group 1 (p<0.005 and p<0.001, respectively).
Conclusion: Our results suggested that restricting salt intake was not only important to preserve RRF during the conservative therapy period in ESRD patients, but also might be important to prevent early decreases in RRF among PD patients.
peritoneal dialysis, salt restriction, residual renal function
In patients with end-stage renal disease (ESRD), peritoneal dialysis (PD) is one option for renal replacement therapies (RRT). Although PD therapy offers numerous advantages as an RRT, maintenance of long-term PD therapy is not easy. In past reports, including our own, many PD patients have needed to stop PD therapy because of frequent episodes of peritonitis, other PD-related complications, social problems, and the risk of encapsulating peritoneal sclerosis [1-4]. However, failure to adequately remove uremic toxins and control body fluid volume are also important obstacles to achieving long-term maintenance of PD [2,4]. In particular, volume overload is reportedly associated with withdrawal of PD and reduced survival [5-7]. To maintain adequate control of body volume in PD patients, preservation of residual renal function (RRF) is known as an important factor not only to prevent withdrawal of PD, but also to decrease modality associated with cardiovascular disease [8,9].
In ESRD patients, interstitial accumulation of salt and extracellular fluid volume overload due to excessive sodium intake caused hypertension and congestive heart failure [10-12]. Recently, excessive salt intake has been reported to potentially induce local inflammation with lymphogenesis and develop organ injuries such as myocardial hypertrophy [13-15]. In fact, restriction of salt intake is an important factor in maintaining adequate body volume not only for dialysis patients, but also for pre-dialysis patients under conservative therapies as a recommendation for chronic kidney disease (CKD) [8,16,17]. In PD patients, preservation of RRF is important both for performing adequate PD and for generally improving prognosis [9,18].
The present study retrospectively investigated effects of a salt-restricted diet during conservative therapy to prevent decreases in RRF after starting PD therapy.
Patient population and background
The present study analyzed 30 of the 61 patients who started PD at Nagoya University Hospital between April 1st, 2010 and March 31st, 2016, and medical records were observed for more than one year. We excluded patients who had undergone severely invasive laparotomy and patients who died within one year after starting PD. A detailed list of the exclusion criteria is shown in Figure 1. Data collection from medical records and analysis were approved by the Ethics Committee for Human Research of the Faculty of Medicine at Nagaya University (#309-3) and consent was obtained from each patient prior to enrolment in the study. All patients used the Baxter PD system (Tokyo, Japan).
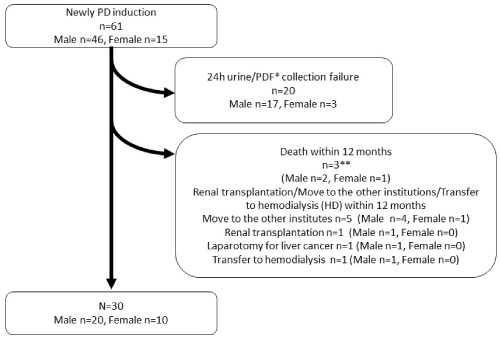
Figure 1. Detailed exclusion criteria for the present study. Thirty cases were evaluated from 61 cases. *Peritoneal dialysate; **Causes of death in three patients were suicide, aplastic anemia, and senility for 1 patient each
We collected background factors from medical records such as diabetes mellitus (DM) status, sex, age, body mass index (BMI), history of smoking, cardiothoracic ratio (CTR), use of angiotensin receptor blockers (ARBs) and/or angiotensin-converting enzyme inhibitors (ACE-Is), use of diuretics, mean blood pressure (MBP), and data for the normalized protein-equivalent of nitrogen appearance (nPNA), serum levels of albumin (Alb), creatinine (Cre), sodium, potassium, calcium, phosphate, C-reactive protein (CRP), and total cholesterol (T-cho), and blood urea nitrogen (BUN) at the time of starting PD. In addition, medical records were used to obtain patient background characteristics (Table 1), laboratory data for 24-hour (h) urine collection before induction of PD therapy, and laboratory data for 24-h urine collection and 24-h peritoneal dialysate collection in the first year after starting PD therapy. Values of nPNA were used to estimate protein intake [19] and were calculated according to the formula proposed by Randerson et al. [20]:
Table 1. Background in 30 patients on peritoneal dialysis
Number of patients |
30 |
Age, years (mean±SD) |
58.6±14.4 |
|
Sex, n (%) |
Male |
20 (66.7) |
Female |
10 (33.3) |
|
Cause of end-stage renal disease, n (%) |
|
Chronic glomerulonephritis |
6 (20.0) |
Diabetic nephropathy |
8 (26.7) |
Nephrosclerosis |
6 (20.0) |
Others |
10 (33.3) |
*End-stage renal disease; **Angiotensin receptor antagonist; ***Angiotensin converting enzyme-inhibitor; ****Ratio of creatinine in dialysate to creatinine in plasma as peritoneal equivalent test; *****Cardiothoracic ratio; ******Normalized protein equivalent of nitrogen appearance.
Comparisons of values of rKt/V, rCCre, and urinary volume before starting PD and of decline rate of rKt/V during the first year after starting PD therapy between Groups 1 and 2
Under conservative therapy for ESRD, both rKt/V and rCcre were significantly preserved in Group 2 as compared with those in Group 1 (Figures 2A and 2B). Urinary volume (UV) was higher in Group 2 than in Group 1 (Figure 2C). Different from conservative therapy for ESRD, decline rates of both rKt/V, rCcre and UV were significantly slower in Group 1 than in Group 2 (Figures 2D-2F). Timings of the 24-h urinary collection test before starting PD and of 24-h urinary and PDF collection tests around 1 year after starting PD were also not significantly different between Groups 1 and 2 (Table 3).
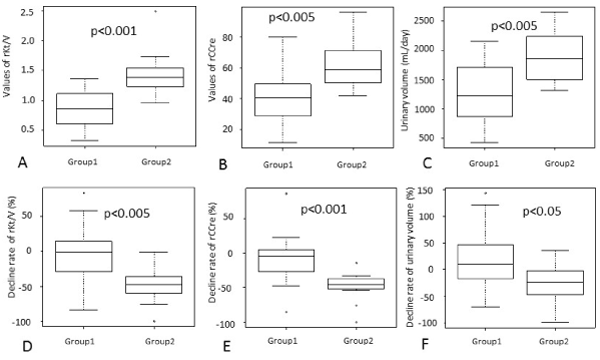
Figure 2. Comparison of residual renal function between Groups 1 and 2. Values of residual renal Kt/V (rKt/V) (A), CCre (rCCre) (B), and urinary volume (C) under conservative therapy before starting peritoneal dialysis (PD) and rates of decline between starting PD and one year after starting PD (D, E, and F, respectively). Refer to the text for formulas to calculate rKt/V and rCCre
Table 2. Comparison of characteristics between Groups 1 and 2 at the time of PD induction
Group (n) |
|
Group 1 (18) |
Group 2 (12) |
P-value |
Age (mean±SD) |
|
60.3±14.2 |
56.1±15.6 |
0.454 |
Sex |
Male (n) |
12 |
8 |
1.000 |
|
Female (n) |
6 |
4 |
|
Smoking history |
Yes (n) |
1 |
0 |
1.000 |
|
No (n) |
17 |
12 |
|
Case of ESRD* |
Diabetic nephropathy (n) |
5 |
3 |
0.561 |
|
Chronic glomerulonephritis (n) |
4 |
2 |
|
|
Nephrosclerosis (n) |
2 |
4 |
|
|
Others (n) |
7 |
3 |
|
Catheter insertion method |
Embedding (n)
Non-embedding (n) |
10
8 |
10
2 |
0.235 |
Agents used before starting PD |
ARB** and/or ACE-I*** (%) |
7 |
9 |
0.07 |
|
Diuretics (%) |
9 |
8 |
0.465 |
Agents used during 1st year after starting PD |
ARB and/or ACE-I (%) |
11 |
5 |
0.457 |
|
Diuretics (%) |
13 |
11 |
1.000 |
Body mass index (mean±SD) |
|
22.1±2.5 |
21.7±3.2 |
0.697 |
Mean blood pressure (mmHg) |
|
96.2±11.6 |
99.1±10.6 |
0.492 |
4h D/P Cre****
(mean±SD) |
|
0.73±0.13 |
0.76±0.08 |
0.452 |
CTR***** (%) (mean±SD) |
|
48.3±5.6 |
47.4±6.1 |
0.669 |
Serum albumin level (g/dL) (mean±SD) |
|
3.3± 0.5 |
3.5±0.6 |
0.363 |
Serum total cholesterol level (mg/dL) (mean±SD) |
|
168.0±30.9 |
173.2±36.7 |
0.692 |
Blood hemoglobin level (g/dL) (mean±SD) |
|
10.53±1.20 |
10.63±0.86 |
0.782 |
Blood urea nitrogen level (mg/dL) (mean±SD) |
|
74.57±24.57 |
66.20±15.83 |
0.266 |
Serum creatinine level (mg/dL) (mean±SD) |
|
8.18±0.62 |
8.30±0.99 |
0.799 |
Serum sodium level (mEq/L) (mean±SD) |
|
137.28±2.89 |
138.83±2.08 |
0.098 |
Serum potassium level (mEq/L) (mean±SD) |
|
4.52±0.55 |
4.88±0.40 |
0.066 |
Serum calcium level (mEq/L) (mean±SD) |
|
4.51±0.44 |
4.58±0.34 |
0.643 |
Serum phosphate level (mg/dL) (mean±SD) |
|
5.29±1.30
|
5.31±0.88 |
0.610 |
Serum uric acid level (mg/dL) (mean±SD) |
|
7.47±1.68 |
7.08±1.56 |
0.519 |
Serum C-reactive protein (mg/dL) |
|
0.14±0.14 |
0.09±0.11 |
0.372 |
Proteinuria in daily urine collection (g/day) (mean±SD) |
|
2.23±2.06 |
3.31±2.55 |
0.207 |
nPNA****** (mean±SD) |
|
0.62±0.15 |
0.83±0.18 |
<0.001 |
*End-stage renal disease; **Angiotensin receptor antagonist; ***Angiotensin converting enzyme-inhibitor; ****Ratio of creatinine in dialysate to creatinine in plasma as peritoneal equivalent test; *****Cardiothoracic ratio; ******Normalized protein equivalent of nitrogen appearance.
Value of D/P Cre during the first year after starting PD between Groups 1 and 2
Salt intake restriction did not significantly influence D/P Cre values during the first year after starting PD in the present study (Table 2). Although the timing of PET to obtain D/P Cre values varied because of the observational nature of the study, timing of the performance of PET did not differ significantly between groups (Table 3).
Table 3. Residual renal function (RRF) before and after starting peritoneal dialysis (PD) and change of decline in RRF
|
|
Group 1 |
Group 2 |
P-value |
Examination timing of PET* (day) (mean+/-SD) |
152.67(±48.10) |
189.33(±157.86) |
0.949 |
Examination timing of 24-h collection tests of urine and peritoneal dialysate at time of starting PD (Day) (mean±SD) |
-3.5±7.56 |
-2.7±6.57 |
0.896 |
Examination timing of 24-h collection tests of urine and peritoneal dialysate around 1 year after starting PD (Day) (mean±SD) |
366.1±50.9 |
386.7±61.3 |
0.326 |
*Dialysate-to-plasma creatinine concentration ratio as peritoneal-equivalent test.
Comparison of nutritional statuses such as BMI, serum Alb, and T-cho levels, and nPNA between Groups 1 and 2 when starting PD therapy
When we compared nutritional status between groups during conservative therapy for ESRD, BMI, serum levels of Alb and T-cho did not differ significantly between Groups 1 and 2 (Table 2). Notably, values of nPNA, reflecting protein intake, were significantly more in Group 2 than in Group 1 (Table 2).
In both groups, no deaths occurred during 3 years after starting PD. Technical failures resulted in the withdrawal of one case from each group within 2 years, and both cases were transferred to hemodialysis (HD) because of social problems. Because of the small numbers, we did not perform statistical analyses. In terms of the occurrence of cardiovascular disease, significant differences between groups were not observed within 3 years (p=0.184).
In the present study, rates of decline in rKt/V, rCCre, and UV were lower in Group 1 than in Group 2 during the first year after starting PD. Our results suggested that a reduced-salt diet might be important in order to prevent early decreases in RRF among PD patients, at least during the first year. In contrast, when starting PD, RRF was less frequent in Group 1 than in Group 2. Restricting salt intake might also contribute to prolongation of the maintenance period of conservative therapy, preventing early induction of RRT during the conservative therapy period in ESRD patients. Values of nPNA were significantly lower in Group 1 than in Group 2 during the conservative therapy, suggesting that protein intake might be also well-performed in Group 1 and might help preserve conservative therapy in Group 1 with lower RRF than in Group 2 until starting PD. Although values of nPNA in Group 1 were also significantly lower than those in Group 2, serum Alb and T-cho levels and BMI were not significantly different between Groups 1 and 2, supporting the idea that diet in both groups did not significantly affect nutrition. This might suggest that the Group 1 population with restricted protein and salt in the diet showed better maintenance of conservative therapy than the Group 2 population.
Dialysis and ultrafiltration failure have been reported as important reasons for withdrawal, especially in cases with long-term PD therapy accompanied by RRF loss [2,3,8,9]. The CANUSA study of a large PD cohort indicated that preservation of RRF was related to survival in PD patients [25]. In particular, maintenance of RRF might have contributed to a decreased incidence of cardiovascular mortality, as loss of RRF was related to increased cardiovascular mortality [9]. In fact, survival was reportedly better in PD patients who maintained RRF than in those who lost RRF [18]. Maintenance of adequate body volume and dialysis in PD patients may be easier with preservation of RRF. In our results, the incidence of cardiovascular disease did not differ between Groups 1 and 2, though the observation period was within three years. Although excessive salt intake may possibly be related to body volume overload, salt intake might not have been sufficient to contribute to body volume control, or RRF may have been sufficient to adjust body volume with urinary sodium excretion, because CTR and MBP were not obviously different between Groups 1 and 2. In terms of the prognosis of both groups, all cases survived and one case in each group was withdrawn to hemodialysis under observation, although we could not statistically evaluate differences between Groups 1 and 2.
To prevent rapid declines in RRF among PD patients, reported factors include avoiding administration of nephrotoxic drugs, easy usage of radio-contrast agents, control of optimized blood pressure such as avoidance of hypotension, dehydration, and use of ACE-Is and/or ARBs [26]. Administration of ACE-Is and/or ARBs was reported to preserve RRF in a meta-analysis of dialysis patients [27]. However, in the present study, use of renin angiotensin-aldosterone system blockers such as ACE-Is and ARBs did not differ between groups for preservation of RRF.
Although a sodium-restricted diet has been suggested as important to preserve RRF, excessive hyponatremia was associated with mortality in PD patients [28]. Although excessive sodium restriction might not provide benefits [29,30], sodium restriction in the present study was limited within the lowest recommended amount by the Japanese Society of Nephrology [8] and serum sodium levels did not differ significantly between Groups 1 and 2.
Recent findings about salt and water balance suggest that sodium is stored in skin and muscle without comparative extracellular fluids in CKD patients [31]. Among in vivo and in vitro studies, high salt intake was reportedly associated with peritoneal fibrosis, peritoneal thickening, induction of epithelial-mesenchymal transition, and peritoneal inflammation [14,32], supporting the notion that restricting sodium intake benefits PD patients when restriction of sodium intake is not excessive.
As limitations to this study, the number of PD patients was small and multivariate analysis was not suitable. The observational period was also only one year. We therefore could not evaluate the prognosis of long-term PD. A future study may require analysis of a larger sample to validate our results and investigate the long-term prognosis of PD therapy and restricted salt intake.
In conclusion, our results suggested that a restricted sodium diet was important to prevent early declines in RRF among PD patients and to prevent early initiation of RRF.
Formal analysis, T.H.; S.N.; Y.S.; Y.S. and T.I.; Methodology, T.H.; Y.S.; and M.M.; Resources, T.I.; H.K.; T.K.; and T.K.; Supervision, M.M.; M.S.; S.N.; and Y.I.; Writing-original draft, T.H.; and M.M.; Writing-review & editing, Y.S.; M.M.; T.S.; T.N.; and Y.I. All authors have read the manuscript and provided constructive feedback.
We wish to thank the medical staff in the blood purification unit of Nagoya University Hospital for the collection of samples.
MM and YS currently work in the Department of Renal Replacement Therapy at Nagoya University Graduate School of Medicine in positions endowed by Baxter Japan. The funders played no role in the present study.
- Davenport A (2009) Peritonitis remains the major clinical complication of peritoneal dialysis: the London, UK, peritonitis audit 2002-2003.Perit Dial Int29: 297-302. [Crossref]
- Mizuno M, Ito Y, Tanaka A, Suzuki Y, Hiramatsu H, et al. (2011) Peritonitis is still an important factor for withdrawal from peritoneal dialysis therapy in the Tokai area of Japan. Clin Exp Nephrol 15: 727-737. [Crossref]
- Mizuno M, Ito Y, Suzuki Y, Skata F, Saka Y, et al. (2016) Recent analysis of status and outcome of peritoneal dialysis in the Tokai area of Japan: the second report of the Tokai peritoenal dialysis registry. Clin Exp Nephrol 20: 960-971. [Crossref]
- Kawaguchi Y, Ishizaki T, Imada A, Oohira S, Kuriyama S, et al. (2003) Study group for withdrawal from PD in Japan. Searching for the reasons for drop-out from peritoneal dialysis: A nationwide survey in Japan. Perit Dial Int 23: S175-S177. [Crossref]
- Blake PG (1997) What is the problem with high transporters?Perit Dial Int17: 317-320. [Crossref]
- Coles GA (1997) Have we underestimated the importance of fluid balance for the survival of PD patients?Perit Dial Int17: 321-326. [Crossref]
- Chung SH, Heimbürger O, Stenvinkel P, Wang T, Lindholm B (2003) Influence of peritoneal transport rate, inflammation, and fluid removal on nutritional status and clinical outcome in prevalent peritoneal dialysis patients. Perit Dial Int 23: 174-183. [Crossref]
- Iseki K, Yamagata K (2016) A practical approach of salt and protein restriction for CKD patients in Japan.BMC Nephrol17: 87. [Crossref]
- Marrón B, Remón C, Pérez-Fontán M, Quirós P, Ortíz A (2008) Benefits of preserving residual renal function in peritoneal dialysis. Kidney Int 73: S42-S51. [Crossref]
- Ok E, Levin NW, Asci G, Chazot C, Toz H, et al. (2017) Interplay of volume, blood pressure, organ ischemia, residual renal function, and diet: certainties and uncertainties with dialytic management. Semin Dial 30: 420-429. [Crossref]
- Hung SC, Lai YS, Kuo KL, Tarng DC (2015) Volume overload and adverse outcomes in chronic kidney disease: clinical observational and animal studies. J Am Heart Assoc 4: e001918. [Crossref]
- Hamrahian SM, Falkner B (2017) Hypertension in chronic kidney disease.Adv Exp Med Biol956: 307-325. [Crossref]
- Ritz E, Dikow R, Morath C, Schwenger V (2006) Salt--a potential 'uremic toxin'?Blood Purif24: 63-66. [Crossref]
- Sakata F, Ito Y, Mizuno M, Sawai A, Suzuki Y, et al. (2017) Sodium chloride promotes tissue inflammation via osmotic stimuli in sub-total-nephrectomized mice. Lab Invest 97: 432-446. [Crossref]
- Machnik A, Neuhofer W, Jantsch J, Dahlmann A, Tammela T, et al. (2009) Macrophages regulate salt-dependent volume and blood pressure by a vascular endothelial growth factor-C–dependent buffering mechanism. Nat Med 15: 545-552. [Crossref]
- Humalda J, Navis G (2014) Dietary sodium restriction: a neglected therapeutic opportunity in chronic kidney disease. Curr Opin Nephrol Hypertens 23: 533-540. [Crossref]
- Lopez-Vargas PA, Tong A, Sureshkumar P, Johnson DW, Craig JC (2013) Prevention, detection and management of early chronic kidney disease: a systematic review of clinical practice guidelines. Nephrology (Carlton) 18: 592-604. [Crossref]
- Lu YH, Hwang JC, Jiang MY, Wang CT (2015) Comparison of the impact of "fast decline" in residual renal function and "initial anuria" on long-term outcomes in CAPD patients. Perit Dial Int 35: 172-179. [Crossref]
- Panzetta G (1995) Protein intake does not depend on the dose of dialysis delivered - provided Kt/V is adequate. Nephrol Dial Transplant 10: 2286-2289. [Crossref]
- Randerson DH, Chapman GV, Farrell PC (1981) Amino acids and dietary status in CAPD patients. In Peritoneal dialysis. Atkins RC, Thomson, NM, Farrell PC, eds. Churchill Livingstone, Edinburgh, pp: 179-191.
- Kidney disease: Improving global outcomes (KDIGO) CKD work group (2013) KDIGO 2012 clinical practice guideline for the evaluation and management of chronic kidney disease. Kidney Int Suppl 3: 1-150.
- Watson PE, Watson ID, Batt RD (1980) Total body water volumes for adult males and females estimated from simple anthropometric measurements. Am J Clin Nutr 33: 27-39. [Crossref]
- Du Bois D, Du Bois EF (1989) A formula to estimate the approximate surface area if height and weight be known. 1916.Nutrition5: 303-311. [Crossref]
- Twardowski ZJ (1990) PET-a simpler approach for determining prescriptions for adequate dialysis therapy. Adv Perit Dial 6: 186-191. [Crossref]
- Bargman JM, Thorpe KE, Churchill DN, The CANUSA peritoneal dialysis study group (2001) Relative controbution of residual renal function and peritoneal clearance to adequacy of dialysis: a reanalysis of the CANUSA study. J Am Soc Nephrol 12: 2158-2162. [Crossref]
- Li PK, Cheng YL (2007) Therapeutic options for preservation of residual renal function in patients on peritoneal dialysis. Perit Dial Int 27: S158-S163. [Crossref]
- Liu Y, Ma X, Zheng J, Jia J, Yan T (2017) Effects of angiotensin-converting enzyme inhibitors and angiotensin receptor blockers on cardiovascular events and residual renal function in dialysis patients: a meta-analysis of randomised controlled trials. BMC Nephrol 18: 206. [Crossref]
- Ravel VA, Streja E, Mehrotra R, Sim JJ, Harley K, et al. (2017) Serum sodium and mortality in a national peritoneal dialysis cohort. Nephrol Dial Transplant 32: 1224-1233. [Crossref]
- Machado d'Almeida KS, Rabelo-Silva ER, Souza GC, Trojahn MM, Santin Barilli SL, et al. (2018) Aggressive fluid and sodium restriction in decompensated heart failure with preserved ejection fraction: Results from a randomized clinical trial. Nutrition 54: 111-117. [Crossref]
- Ko GJ, Kalantar-Zadeh K, Goldstein-Fuchs J, Rhee CM (2017) Dietary Approaches in the management of diabetic patients with kidney disease. Nutrients 9: E824. [Crossref]
- Dahlmann A, Dörfelt K, Eicher F, Linz P, Kopp C, et al. (2015) Magnetic resonance–determined sodium removal from tissue stores in hemodialysis patients. Kidney Int 87: 434-441. [Crossref]
- Pletinck A, Consoli C, Van Landschoot M, Steppan S, Toplay N, et al. (2010) Salt intake induces epithelial-to-mesenchymal transition of the peritoneal membrane in rats. Nephrol Dial Transplant 25: 1688-1696. [Crossref]