The present study aimed to investigate the effect of food size on chewing behavior (number of chewing cycles, cycle duration and displacement of chin movement) from food intake to the terminal swallow. Twenty healthy females were recruited. Food intake behavior was recorded using two digital video cameras and three-dimensional kinematic data were collected using three-dimensional image processing software. Multilevel model analysis was applied to describe the fit of the chin marker displacement curves during the chewing cycles. Our results showed that there was a significant tendency for the number of chewing cycles to increase with increasing rice ball weight. However, in contrast, the number of chews per rice weight decreased gradually with increasing weight. The displacement of the chin marker increased from the first to last chewing cycle as the rice ball weight increased. For time-dependent changes in displacement, the differences of displacement in the first cycle were greater than in the last cycle. There were significant differences in the vertical, lateral and anteroposterior displacement curves depending on rice ball weight. Vertical and lateral displacement generally decreased with time, and the curves showed steep slopes from the start to middle points of an intake. This study suggested that change in masticatory movement according to food size may be associated with appropriate eating behavior.
eating behavior, masticatory movement, mouthful food size, number of chews
Feeding behavior is one of the most essential stomatognathic functions and consists of several steps: food cognition, food ingestion, mastication and swallowing. During mastication, the texture, temperature and moisture of food change substantially in the oral cavity [1,2], and masticatory patterns will adjust to the altered food properties during bolus processing. Koyama, et al. [3] analyzed the masticatory parameters, and reported that there was a high correlation between many masticatory parameters in the early stage, yet not during the middle and late stages. They considered that these results were related to the mastication cycle and duration. It is important to clarify the kinematics of human mastication over time according to food changes. However, few investigations have viewed certain steps of feeding behavior as a sequence of movements.
Previous animal studies reported that masticatory jaw movement is adjusted subconsciously by the mechanosensitive receptors located in the tongue and oral mucosa [4], muscle spindles [5,6] and periodontal pressoreceptors [7,8]. Therefore, it can be assumed that each masticatory jaw movement is affected by the size and texture of the food bolus. Food texture, particularly hardness, influences mastication in humans. The number of chewing cycles and duration to prepare a food bolus for swallowing increases with the hardness of food. The duration for which the masticated food is aggregated on the pharyngeal surface of the tongue is also longer with increased food hardness [9]. The mouthful size of food also influences mastication [10-12]. However, in these studies, no attempt was made to assess the mastication kinematics according to food size over time.
The present study was designed to investigate the effect of food size on chewing behavior (number of chewing cycles, cycle duration and displacement of chin movement) from food intake to the terminal swallow using a motion capture system with digital video cameras.
Participants
The study participants were 20 healthy, adult female volunteers with a mean age of 27.3 years. None of the participants had any problems with mastication or swallowing; there were no abnormalities in the number or position of teeth (except for the third molars) or in occlusion; and there were no histories of eating disorders. We obtained informed consent from each participant after explaining the aim and methodology of the study. This study was approved by the Ethics Committee of the Faculty of Dentistry, Niigata University Faculty of Dentistry (25 - R21 - 10 - 2).
Measurement system and procedure
We used a motion capture system with two digital video cameras (FDR-AX100, Sony, Tokyo, Japan) to collect three-dimensional kinematic data at a frequency of 30 Hz. The two digital video cameras were placed parallel to the floor and 150 cm in front of each participant at approximately 30° laterally (Figure 1). We attached several light-reflective markers to each participant’s head and face to track the motion of the markers (Figure 2). Dipp-Motion V/3D image processing software (Ditect, Tokyo, Japan) identified the marker locations in each two-dimensional camera image to compute its three-dimensional location relative to a calibration square frame, which had reflective markers at its vertex. We defined the reference coordinate system using the three head points and extracted the chin marker point to determine the three-dimensional jaw movement.
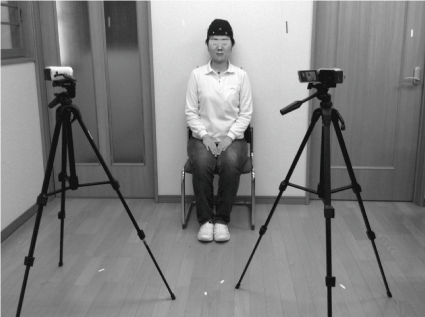
Figure 1. Camera setup Two digital video cameras were placed parallel to the floor and 150 cm in front of each participant at approximately 30° laterally to record their feeding behavior.
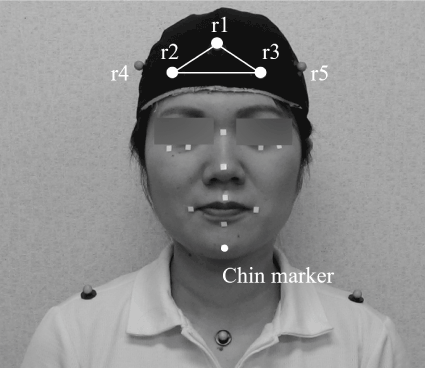
Figure 2. Anterior view of a participant showing the location of the reflective markers Three reference markers were used on the head cap: r1, r2 and r3. In this study, the chin marker coordinates were extracted to determine the three-dimensional jaw movements.
The test foods were three types of rice ball made using a retort production method (Sato no Gohan, Sato Foods, Niigata, Japan). The rice balls were 5 g, 10 g and 20 g in weight (Figure 3). The participants were requested to sit upright, with their back supported by a backrest while adopting a natural head position. They were given a rice ball on their tongue and requested to hold it at the intercuspal position until a command for intake was given. Each participant was asked to eat the rice ball freely and at their own pace after receiving a start signal. The recording session began from when the participant held the rice ball in the oral cavity before the start command was given, and ended when the participant completed the terminal swallow. The participants were asked to raise their hands when they had finished. The order of measurement for the three different rice weights was randomized. We performed the recordings after the participants had adapted to the measuring environment.
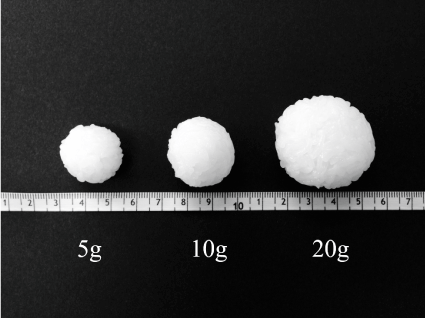
Figure 3. Test food Rice balls of 5 g, 10 g and 20 g weight were used as test food.
Data analysis
We measured the intake time, number of chewing cycles and chin marker movements. A representative chin marker movement during 5 g rice ball feeding appears in Figure 4. This represents the change over time of the vertical coordinate distance of the chin marker from start (the beginning of mouth opening in the first chewing cycle) to finish (the completion of terminal swallowing). The coordinate distance was a series of repeated cyclic movements. We defined a chewing cycle as the period from one maximum jaw opening to the next (Figure 5). We used a custom-written code in MATLAB (The MathWorks, Inc., Natick, MA, USA) to determine the maximum (peak) and minimum (negative peak) values of the chin marker movements in the vertical coordinate distance. The data point identified with this code was visually checked and verified. We investigated the duration of each feeding sequence, the number of chewing cycles, the duration of chewing cycles, and the vertical, lateral and anteroposterior displacement in each cycle. The differences in these parameters between intake food weight and the change over time during the feeding sequence were evaluated. It was difficult to normalize raw values to obtain time-dependent changes of each parameter; these values did not necessarily change constantly with time, and the intake time varied among individuals. To evaluate the time-dependent change of the chin marker displacements, we transformed the time scale to percentage values (start point = 0%, finish point = 100%); we then recalculated the intake time. With this time scale, each value was expressed as a statistically significant polynomial graph.
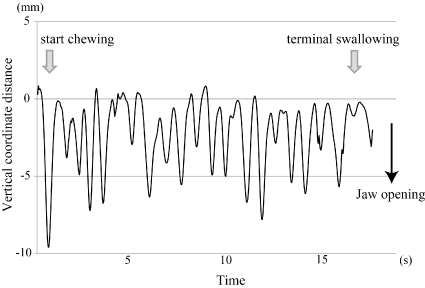
Figure 4. Representative chin marker movement during a complete feeding sequence Vertical chin marker movement during 5 g rice ball feeding from food intake until terminal swallow.
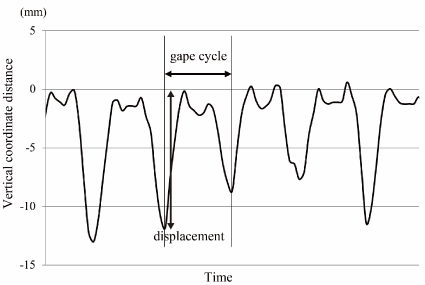
Figure 5. Expanded section of vertical chin marker movement during a feeding sequence Each chewing cycle was defined by consecutive maximum gapes. A displacement was calculated by the maximum (peak) and minimum values (negative peak) of the chin marker movements in the vertical coordinate direction.
Statistics
We performed descriptive statistics and one-way analysis of variance for comparison between food weights using SigmaPlot 12.5 (Systat Software, Inc., Chicago, IL, USA). Tukey’s test was used for multiple comparisons. These data were expressed as means ± standard deviation. A P value <0.05 was considered statistically significant. To evaluate the time-dependent change, we used multilevel model analysis (MLwiN, University of Bristol, UK) [13,14]. The multilevel approach estimates mathematical models consisting of fixed and random parts. The model’s fixed part estimated each parameter related to food intake; the random part estimated variation. We used iterative generalized least-squares procedures to estimate the model’s parameters. Plotting the polynomials calculated using the MLwiN software produced a graphic representation of each parameter’s best fit for the time-dependent change. Multilevel analysis indicated where each term of the best-fit curve could be considered statistically significant (P<0.05).
Temporal kinematic parameters
The upper part of Table 1 shows the temporal kinematic parameters during each rice ball feeding. The intake times from initiation of chewing to completion of final swallowing were significantly prolonged as the rice weight increased. Similarly, the number of chews significantly increased as the rice weight increased. Conversely, the number of chews per rice ball decreased significantly with increasing weight. There were no significant differences in cycle durations of the first and last cycle between each rice ball feeding.
Table 1. Comparison of kinematic parameters among intake food weight.
Temporal parameters
|
5 g |
10 g |
20 g |
Intake time (s)*** |
21.35 ± 5.33††† |
29.24 ± 6.29††† |
41.29 ± 9.80††† |
Number of chews (cycle)*** Number of chews per weight (cycle/g)*** |
22.3 ± 5.4††† 4.46 ± 1.08††† |
34.5 ± 8.8††† 3.45 ± 0.88††† |
49.1 ± 12.0††† 2.46 ± 0.60††† |
First cycle duration (s) |
0.90 ± 0.25 |
0.89 ± 0.27 |
0.91 ± 0.27 |
Last cycle duration (s) |
0.78 ± 0.21 |
0.91 ± 0.36 |
1.03 ± 0.56 |
Special parameters
Displacement of chin marker during first cycle |
5 g |
10 g |
20 g |
Vertical (mm)* |
8.44 ± 3.65 |
8.54 ± 3.06 |
12.06 ± 6.25† |
Lateral (mm)* |
4.29 ± 1.79 |
4.01 ± 2.05 |
5.53 ± 2.91‡ |
Anteroposterior (mm) |
4.65 ± 3.48 |
4.36 ± 2.63 |
6.27 ± 3.98 |
Displacement of chin marker during last cycle |
5 g |
10 g |
20 g |
Vertical (mm) |
4.59 ± 1.97 |
6.39 ± 3.63 |
5.99 ± 2.89 |
Lateral (mm) |
2.80 ± 2.31 |
2.75 ± 2.59 |
2.90 ± 2.37 |
Anteroposterior (mm)* |
2.78 ± 1.32 |
4.46 ± 2.93 |
4.58 ± 3.11§ |
Values are means ± SD (SD: standard deviation of the mean).
Differences were tested using one-way repeated analysis of variance followed by Tukey’s test.
Significance level: ***P <0.001, *P<0.05. Significance level as compared with other groups: †††P<0.001, †P<0.05 vs. values in the other rice ball weight groups, ‡P <0.05 vs. value in 10 g rice ball feeding, §P=0.053 vs. value in 5 g rice ball feeding.
Special kinematic parameters
The middle and lower part of Table 1 shows the displacement of the chin marker during the first and last cycles, respectively. For the first cycle, there were significant differences in the mean vertical and lateral displacement values among the different rice weights (P<0.05). When comparing between different rice weights, the vertical displacement during 20 g rice ball intake was significant greater than 10 g and 5 g, and the lateral displacement during 20 g rice ball intake was significantly greater than 5 g feeding. For the last cycle, there was a significant difference in the mean anteroposterior displacement values among the different rice weights (P<0.05), but not in the vertical and lateral displacement values. When comparing the displacement between the first and last cycles, there were significant differences in all three directions.
Time-dependent changes in displacement
Figures 4-6 show polynomial curves of the vertical, lateral and anteroposterior displacements, respectively, during each chewing cycle. All curves are described as statistically significant polynomial function curves (Table 2). There were significant differences in the curves depending on rice ball weight in the vertical, lateral and anteroposterior directions. The vertical and lateral displacements generally decreased with time, and the curves showed steep slopes from the start to middle points of an intake except for the lateral displacement curve of the 10 g feeding (Figures 4 & 5). The vertical displacement in 20 g feeding was larger than the other groups throughout the entire intake time. The differences in the vertical displacement between the 20 g and other rice ball weights became gradually smaller. For the lateral displacement, a similar tendency was shown. Although the anteroposterior displacement also decreased immediately after the first cycle, it then increased slightly from around the middle point of an intake, in each rice ball weight (Figure 6). The anteroposterior displacement in the 20 g feeding was also larger than in the other rice ball weights throughout the entire intake time.
Table 2. Estimates of displacement values in each chewing cycle as a percentage of the time-course.
Explanatory variables |
5 g |
10 g |
20 g |
Estimate |
SE |
Estimate |
SE |
Estimate |
SE |
Constant a b c |
8.51E+0 -1.95E-1 3.95E-3 -2.38E-5 |
6.18E-1 4.40E-2 9.73E-4 6.16E-6 |
8.31E+0 -6.40E-2 4.25E-4 |
5.25E-1 1.37E-2 1.31E-4 |
1.34E+1 -2.39E-1 3.82E-3 -2.07E-5 |
6.97E-1 4.15E-2 9.49E-4 6.16E-6 |
Vertical displacement
Explanatory variables |
5 g |
10 g |
20 g |
Estimate |
SE |
Estimate |
SE |
Estimate |
SE |
Constant a b c |
4.39E+0 -8.31E-2 1.47E-3 -8.15E-6 |
3.93E-1 2.84E-2 6.28E-4 3.97E-6 |
3.61E+0 -4.93E-3 |
2.67E-1 2.27E-3 |
6.10E+0 -1.05E-1 1.7E-3 -9.57E-6 |
3.79E-1 2.39E-2 5.46E-4 3.55E-6 |
Lateral displacement
Explanatory variables |
5 g |
10 g |
20 g |
Estimate |
SE |
Estimate |
SE |
Estimate |
SE |
Constant a b c |
5.04E+0 -1.24E-1 2.42E-3 -1.37E-5 |
4.91E-1 3.40E-2 7.51E-4 4.75E-6 |
4.54E+0 -3.75E-2 3.51E-4 |
5.25E-1 1.17E-2 1.12E-4 |
6.66E+0 -7.97E-2 6.62E-4 |
5.47E-1 1.40E-2 0.34E-4 |
Anteroposterior displacement
Time-dependent changes in displacement are described as first-, second-, or third-order polynomials (Y = constant + aX + bX2 cX3). SE: standard error of the mean.
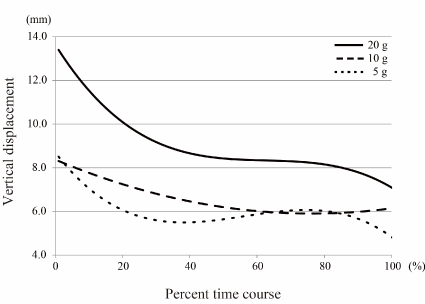
Figure 6. Polynomial curve of vertical displacements over time There were significant differences in the vertical displacement curves depending on rice ball weight (Table 2). The vertical displacement in 20 g feeding was larger than in other rice ball weights throughout the entire intake time. The curves decreased with time, and showed steep slopes from the start to middle points of an intake.
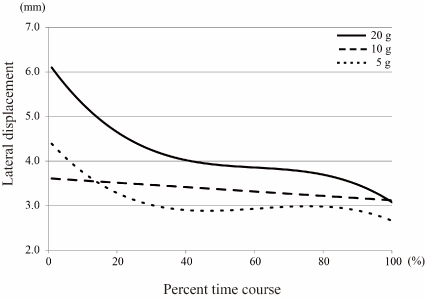
Figure 7. Polynomial curve of lateral displacements over time There were significant differences in the lateral displacement curves depending on rice ball weight (Table 2). The lateral displacement decreased with time, and the curves showed steep slopes from the start to middle points of an intake, except for the 10 g feeding curve. In 10 g feeding, the curve decreased linearly over time.
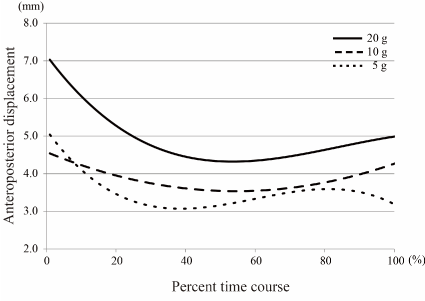
Figure 8. Polynomial curve of anteroposterior displacements over time There were significant differences in the anteroposterior displacement curves depending on rice ball weight, similar to the vertical and lateral displacements (Table 2). The anteroposterior displacement also decreased immediately after the first cycle, but then increased slightly from around the middle point of an intake, in each rice ball weight.
In present study, we examined chewing behavior (number of chewing cycles, cycle duration and displacement of chin movement) with different food sizes from food intake to the terminal swallow using a chin marker. Gerstner, et al. [15] reported that chin movements corresponded fairly well to jaw movements in their study for comparison of chin and jaw movement. They stated that tracking chin movements minimized the disadvantages of ethologic studies, such as the loss of data accuracy as a result of collecting data in naturalistic routine conditions where participants are unaware of their chewing. Inada, et al. [16] used chin movement tracking for measurement of mouth opening metric values. In this study, we defined a chewing cycle by tracking chin movements, and performed temporal and metric analyses. Our results showed that there was a significant tendency for the number of chewing cycles to increase with increasing rice weight. However, in contrast, the number of chews per rice weight decreased gradually with increasing weight. Our results are inconsistent with those of previous reports [10-12] and suggest that a smaller mouthful size could lead to increased chewing, extended oral processing time and decreased intake. Overweight people appear to be more susceptible to the effects of increases in mouthful size than their lean counterparts [17-20]. Overall, it is believed that the modification of behavior towards a smaller mouthful size may eventually lead to the prevention of overweight and obesity.
The displacement of the chin marker was greater in larger mouthful sizes from the first to last chewing cycles. For time-dependent changes in displacement, the differences of displacement in the first cycle were greater than in the last cycle. In the first cycle, there were differences in the vertical and lateral displacements, while in the last cycle, there was a difference in the anteroposterior displacement. Previous studies [16,21] reported that mouth opening range during ingestion changed depending on the food size, increasing with a larger mouthful size, and that accompanying head motion supported the mandible during mouth opening. In our study, there were greater differences in the three-dimensional displacement between the 20 g rice ball and the other weights, than between the 10 g and 5 g rice balls. Nakamichi, et al. [10] reported that the mouthful weight of boiled rice was 9.7 g and Murakami, et al. [22] reported that the mouthful weight when freely consuming curry with rice was 12.1 g; both participant groups were young Japanese non-overweight females. We believe that the 10 g rice ball represented one average mouthful size of boiled rice, 5 g was approximately half a mouthful size and 20 g was approximately double the mouthful size. The 20 g rice ball appeared to be too large for one mouthful size, and this altered the chewing cycle, especially in the early stage of mastication.
We found that there were differences in the chewing cycle among the different food weights not only in the first cycle but also in the last cycle just before the terminal swallow. The initiation of swallowing is thought to be related to the physical properties of the food bolus [23,24]. Goto, et al. [11] reported that the bolus properties just before swallowing varied with changes in mouthful size. In their study, in which boiled rice, fish sausage and peanuts were used as test foods, there was a trend for increased solidity of the bolus with increasing mouthful size, especially with more solid food. A small mouthful size might assist with the formation of appropriate bolus properties for swallowing. In the present study, we examined the last chewing cycle, which was the cycle just before the terminal swallow, and did not examine the interposed swallows, including the first swallow. The anteroposterior movement of the last chewing cycle varied with changes in mouthful size. The differences in the cycles between different food sizes might be caused by the bolus size and properties prior to the terminal swallow.
This study has certain limitations. First, we did not consider the interposed swallows, including the first swallow. Interposed swallows occur within a masticatory sequence and terminal swallows end the sequence [25]. Okada, et al. [26] reported that when ingesting food freely, humans may need at least two swallows, even with one bite of food. In addition, they reported that the estimated volume of bolus in each swallow varied, and the bolus swallowed during the interposed swallow was larger than in the terminal swallow. It is necessary to determine the number of swallows using several methods to maintain accuracy and objectivity, e.g. direct observation [27-29], button pressing by the participant [30] and surface electromyography [30,31]. Second, we did not examine the individual mouthful size of boiled rice when each participant freely took one bite of boiled rice. The mouthful size when freely taking one bite of food varies among individuals [10,11] and among eating methods [32]. The relationship between the three food weights used in this study and individual mouthful sizes should be clarified. Third, gender differences should be considered. One study found a significant gender difference in eating rate and mouthful size [33]. Despite these limitations, the present study produced new findings suggesting that the masticatory movement is variable depending upon the food size.
The present study demonstrated changes in masticatory movement according to food size in boiled rice eating. A larger rice ball size was associated with a greater intake time and number of chews. However, the larger rice ball had fewer chews per rice weight, and the number of chews did not increase linearly with increasing food weight. In addition, the larger rice ball size was associated with greater three-dimensional chewing cycle movement throughout the feeding sequence.
The authors declare that they have no competing interests.
This study was supported by KAKENHI from the Japan Society for the Promotion of Science (nos. 25463174 to H. Hayasaki, 16K11802 to H. Hayasaki).
- Hutchings JB, Lillford PJ (1988) The perception of food texture—the philosophy on the breakdown path. J Texture Stud 19: 103-115.
- Sakamoto H, Harada T, Matsukubo T, Takaesu Y, Tazaki, M (1989) Electromyographic measurement of textural changes of foodstuffs during chewing. Agr Biol Chem Tokyo 53: 2421-2433.
- Kohyama K, Sasaki T, Hayakawa F (2008) Characterization of food physical properties by the mastication parameters measured by electromyography of the jaw-closing muscles and mandibular kinematics in young adults. Biosci Biotechnol Biochem 72: 1690-1695. [Crossref]
- Appenteng K, Lund JP, Seguin JJ (1982) Intraoral mechanoreceptor activity during jaw movement in the anesthetized rabbit. J Neurophysiol 48: 27-37. [Crossref]
- Goodwin GM, Luschei ES (1974) Effects of destroying spindle afferents from jaw muscles on mastication in monkeys. J Neurophysiol 37: 967-981. [Crossref]
- Lund JP, Olsson KA (1983) The importance of reflexes and their control during jaw movement. Trends Neurosci 6: 458-463.
- Lavigne G, Kim JS, Valiquette C, Lund JP (1987) Evidence that periodontal pressoreceptors provide positive feedback to jaw closing muscles during mastication. J Neurophysiol 58: 342-358. [Crossref]
- Morimoto T, Inoue T, Masuda Y, Nagashima T (1989) Sensory components facilitating jaw-closing muscle activities in the rabbit. Exp Brain Res 76: 424-440. [Crossref]
- Hiiemae KM, Palmer JB (1999) Food transport and bolus formation during complete feeding sequences on foods of different initial consistency. Dysphagia 14: 31-42. [Crossref]
- Nakamichi A, Matsuyama M, Ichikawa T (2014) Relationship between mouthful volume and number of chews in young Japanese females. Appetite 83: 327-332. [Crossref]
- Goto T, Nakamich A, Watanabe M, Nagao K, Matsuyama M, et al. (2015) Influence of food volume per mouthful on chewing and bolus properties. Physiol Behav 141: 58-62. [Crossref]
- Shiozawa K, Ohnuki Y, Mototani Y, Umeki D, Ito A, et al. (2016) Effects of food diameter on bite size per mouthful and chewing behavior. J Physiol Sci 66: 93-98. [Crossref]
- Throckmorton GS, Ellis E 3rd, Hayasaki H (2003) Jaw kinematics during mastication after unilateral fractures of the mandibular condylar process. Am J Orthod Dentofac 124: 695-707.
- Buschang PH, Hayasaki H, Throckmorton GS (2000) Quantification of human chewing-cycle kinematics. Arch Oral Biol 45: 461-474. [Crossref]
- Gerstner GE, Fehrman J (1999) Comparison of chin and jaw movements during gum chewing. J Prosthet Dent 81: 179-185. [Crossref]
- Inada E, Saitoh I, Nakakura-Ohshima K, Maruyama T, Iwasaki T, et al. (2012) Association between mouth opening and upper body movement with intake of different-size food pieces during eating. Archives Oral Biol 57: 307-313. [Crossref]
- Burger KS, Fisher JO, Johnson SL (2011) Mechanisms behind the portion size effect: visibility and bite size. Obesity (Silver Spring) 19: 546-551. [Crossref]
- Forde CG, van Kuijk N, Thaler T, de Graaf C, Martin N (2013) Oral processing characteristics of solid savoury meal components, and relationship with food composition, sensory attributes and expected satiation. Appetite 60: 208-219. [Crossref]
- Spiegel TA (2000) Rate of intake, bites, and chews-the interpretation of lean-obese differences. Neurosci Biobehav Rev 24: 229-237. [Crossref]
- Spiegel TA, Kaplan JM, Tomassini A, Stellar E (1993) Bite size, ingestion rate, and meal size in lean and obese women. Appetite 21: 131-145. [Crossref]
- Daet DG, Watanabe M, Sasaki K (1995) Association between the interarch distance and food bolus size in the early phase of mastication. J Prosthet Dent 74: 367-372. [Crossref]
- Murakami N, Nakamura Y, Nakajima T, Sasakawa Y, Nakakura-Ohshima K, et al. (2017) Oral feeding behavior during a whole meal. Dent Oral Craniofac Res 4: 1-7.
- Hutchings J B, Lillford P J (1988) The perception of food texture — the philosophy of the breakdown path. J Texture Stud 19: 103-115.
- Liu D, Deng Y, Sha L, Abul Hashem M, Gai S (2017) Impact of oral processing on texture attributes and taste perception. J Food Sci Technol 54: 2585-2593. [Crossref]
- McFarland DH, Lund JP (1995) Modification of mastication and respiration during swallowing in the adult human. J Neurophysiol 74: 1509-1517. [Crossref]
- Okada A, Honma M, Nomura S, Yamada Y (2007) Oral behavior from food intake until terminal swallow. Physiol Behav 90: 172-179. [Crossref]
- Tohara H, Saitoh E, Mays KA, Kuhlemeier K, Palmer JB (2003) Three tests for predicting aspiration without videofluorography. Dysphagia 18: 126-134. [Crossref]
- Oguchi K, Saitoh E, Mizuno M, Baba M, Okui M, Suzuki M (2000) The repetitive saliva swallowing test (RSST) as a screening test of functional dysphagia (1) Normal values of RSST. Jpn J Rehabil Med 37: 375-382.
- Oguchi K, Saitoh E, Baba M, Kusudo S, Tanaka T, Onogi K (2000) The repetitive saliva swallowing test (RSST) as a screening test of functional dysphagia (2) Validity of RSST. Jpn J Rehabil Med 37: 383-388.
- Nakamura Y, Hatakeyama A, Kitada Y, Tsujimura T, Taniguchi H, et al. (2013) Effects of pharyngeal water stimulation on swallowing behaviors in healthy humans. Exp Brain Res 230: 197-205. [Crossref]
- Yahagi R, Okuda-Akabane K, Fukami H, Matsumoto N, Kitada Y (2008) Facilitation of voluntary swallowing by chemical stimulation of the posterior tongue and pharyngeal region in humans. Neurosci Lett 448: 139-142. [Crossref]
- Sun L, Ranawana DV, Tan WJ, Quek YC, Henry CJ (2015) The impact of eating methods on eating rate and glycemic response in healthy adults. Physiol Behav 139: 505-510. [Crossref]
- Hubel R, Laessle RG, Lehrke S, Jass J (2006) Laboratory measurement of cumulative food intake in humans: results on reliability. Appetite 46: 57-62. [Crossref]


