Materials about calcium-regulating hormones (calcitonin and parathyrin) effect on carbohydrate regulation are represented. It is showed calcitonin hyperglycemic effect, its contra-insulin effect to insulin. It is ascertained the impairment of glucose metabolism under calcitonin-hyperglycemia, insulin resistance and glucose intolerance. It is established the opposite to calcitonin action of parathyrin on glucose metabolism: decreasing the glucose level and increasing glucose tolerance. It is concluded that calcitonin and parathyrin are antagonists not only concerning to the regulation of calcium metabolism, but and glucose.
calcitonin, parathyrin, hyperglycemia, glucose tolerance, insulin resistance, gluco-regulating hormone, antagonists, calcium and glucose metabolism
Calcium-regulating hormones – calcitonin (calcium-decreasing, CT) and parathyrin (calcium-increasing, PTH) are well-known ones for its effects on calcium metabolism. However, there are a lot of facts about CT hyperglycemic, contra-insular effect and it participant in the development of insulin resistance [1-6] have studied now. More less facts are known about PTH effects on glucose metabolism [7,8]. We thought it appropriate to compare the effects of CT and PTH on glucose metabolism and its interaction to analyze possible mechanisms underlying of its effects on glucose metabolism. We’ll consider effect of CT and PTH on glucose and calcium level, the type of alimentary hyperglycemia and glucose consumption by muscle (diaphragm) and adipose (epididymal) tissues and insulin-stimulated glucose consumption in vivo and in vitro.
Experiments were performed on 250 male Wistar rats weighing 100-150 g. The rats were divided into 8 groups. Group 1 animals received a single intramuscular injection of porcine CT (calcitrin, Russia) in a dose of 1 U/100 g body weight. Rats of group 2 received an intramuscular injection of bull PTH («Parathyreoidin», Russia, 1 U/100 g of body weight). Animals of the 3-rd group received the calcium laktat load (9 mg) per os. Blood glucose levels and total plasma calcium content were determined at rest on an empty stomach (initial level) and every 30 minutes after administration of these drugs over 240 min. Blood samples were taken under light ether anesthesia from dissected femoral vein. A correlation coefficient between glucose level and total calcium content in blood was determined. Group 4 rats received glucose load: 30% glucose solution per os (1 ml/100 g body weight) and then blood samples were taken every 30 minutes (30-240 min) for measuring of glucose concentrations. Groups 5 and 6 rats received intramuscular injections of CT or PTH (1 U/100 g body weight), correspondently, and after 30 min glucose load was performed (as in the group 4). To estimate the glycemic curves, hyperglycemic index (blood glucose ratio of maximum to the initial level) and hypoglycemic index (blood glucose ratio of minimum to the initial level) were calculated. In animals of groups 4-6, blood samples were taken from the caudal vein. In in vivo experiments (group 7), CT and PT were administered intramuscularly in a dose of 1 U per 100 g of body weight, 60 min later the rats were decapitated. For stimulation of glucose consumption by the muscle and adipose tissues, insulin was injected intramuscularly in a dose of 1 U per 100 g of body weight, the animals were sacrificed 60 min later. For evaluation of the effect of CT and PT on insulin-stimulated glucose consumption by tissues, CT and PT were administered 30 min before insulin injection and the rats were decapitated 1 h after insulin administration. In in vitro experiments (group 8), 0.1 U/ml CT, 0.1 U/ml PT, 0.5 U/ml insulin were added to the Krebs—Ringer medium (1 ml). For evaluation of the combined effects of preparations, they were simultaneously added to the medium. Cooled muscle and adipose tissue fragments (100-120 mg) were placed in Krebs—Ringer solution containing 11.1 mmol/liter glucose and incubated in Warburg apparatus at 37.7℃ and 60-80 shakes per minute. Tissue glucose consumption was estimated by the difference between its content in the medium before and after incubation. Glucose consumption by the muscle and adipose tissue of intact rats was used as the control. Glucose concentration in the blood was measured by Frank– Kirberger method [9], the amount of total calcium was evaluated by complexometry [10]. The data were statistically processed by methods of variation statistics (Student—Fisher test).
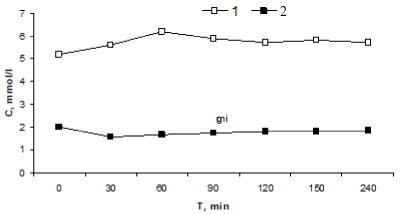
The maximum increase in blood glucose concentration was observed 60 min after CT injection (from 5.2±0.2 to 6.2±0.1 mmol/liter, p<0.001). Under these conditions, total calcium concentration decreased from 2.03±.01 to 1.68±0.03 mmol/liter (p<0.001). Glucose content practically returned to the initial level (5.7±0.3 mmol/liter) 240 min after the injection. Total calcium content at this term was 1.83±0.05 mmol/liter (p<0.01). The dynamics of hyperglycemia induced by CT injection and CT-induced decrease in blood calcium concentration coincided. Strong correlation was observed between the concentrations of glucose and total calcium (r=-0.834, p<0.02). Maximum increment in blood glucose level after CT administration was 19±2%, the concentration of total calcium decreased to 1.58±0.03% mmol/liter (83±2% of initial level). These data suggest that CT reduces total calcium content in the blood and produces a pronounced hyperglycemic effect (Figure 1).

Figure 1. Effects of single injection of CT on glucose and calcium levels. 1 – glucose, 2 – calcium (*p<0.05: in comparison with initial values)
Thus, CT administration reduced the content of total calcium in the blood plasma and in addition increased blood glucose levels with subsequent normalization of these parameters after 240 min.
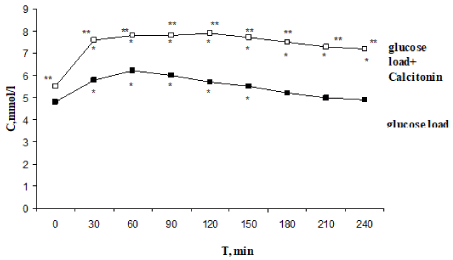
The initial glucose concentration in rats corresponded to normal (Figure 2). After glucose load, glucose concentration peaked after 60 min increasing to 6.2±0.3 mmol/liter (p1<0.001); in 240 min it returned to the initial level (4.8±0.2 mmol/liter). A significant increase in glucose concentration was observed 30 min after glucose load and preliminary CT injection. This level remained high at the end of experiment: glucose level (7.9±0.4 mmol/ liter, p2<0.001) peaked on the 120-th minute and remained high to the 240-th minute (7.2±0.4 mmol/liter, p2<0.01). Hyperglycemic and hypoglycemic indices were significant increased. Thus, CT administration induced impaired glucose tolerance.

Figure 2. Effect of one-time calcitonin injection on the type of alimentary hyperglycemia. *- The reliability of results differences under the initial level; ** - The reliability of results differences under the glucose load
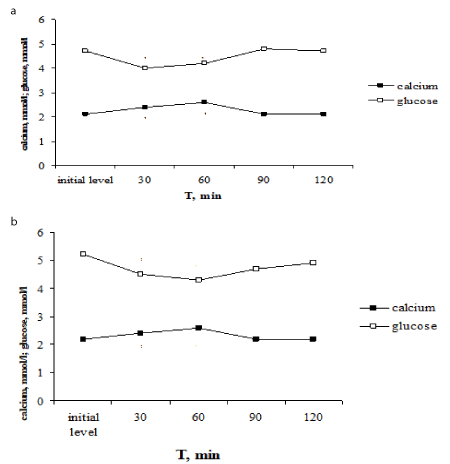
Another dynamics of glycemia level was observed under PTH administration. PTH injection increased the content of total calcium in blood plasma (from 2,1±0,2 to 2,6±0,03 mmol/l, P<0,001) and in addition decreased the blood glucose level from 4,7±0,02 to 4,0±0,1 mmol/l (P<0,001). The normalization of investigating parameters occurred to the 90-th min (Figure 3a). The decreasing of glycemia induced by PTH injection coincides with the increasing of the total calcium level induced by hormone. There is a close negative correlation was established between glucose levels and total calcium content (r=-0,813, P<0,02). Thus, PTH increased the content of total calcium in the blood plasma and besides induced the reliable decreasing of the blood glucose level.
For elucidation of hypercalcaemia role in decreasing of the blood glucose level under PTH administration we were carried out the tests with the calcium laktat load. The calcium laktat load provoked the similar alterations of glucose and calcium levels as PTH administration – the increasing of calcium level and decreasing of the blood glucose level (Figure 3b). Thus, the total calcium content in blood serum increased from 2,2±0,03 to 2,58±0,1 mmol/l, P<0,001, and glucose level decreased from 5,2±0,01 to 4,3±0,02 mmol/l, P<0,001. The total calcium content returned to the initial level in 90 min and glucose level – in 120 min after the calcium laktat load. There is a functional negative correlation was established between glucose levels and total calcium content (r =-0,997, P<0,01).

Figure 3. Effect of one-time parathyrin injection (a) and the calcium laktat load (b) on glucose level and total calcium content in blood serum in rats. * - The reliability of results differences under the initial level
The findings testify to the effect that the decreasing of glucose level after PTH injection caused by hypercalcaemia. In previous data under PTH administration the decreasing of glucose level in 30 and 60 min with gradually normalization in 90 min was established in addition the increasing of the total calcium content. It was logically supposed that in the increasing of glucose level to the initial values the endogenous CT takes part, as it is known that CT reveals hyperglycemic effect [4,8] and the increasing of the blood calcium content stimulates it secretion. There is a reciprocive interconnection between CT and PTH secretion.
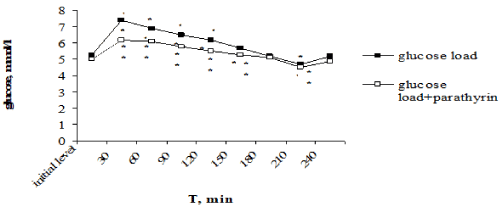
Of particular interest was to study PTH effect on the dynamics of hyperglycemia under glucose-tolerance test. Unlike CT, provoking glucose intolerance, PTH, on the contrary, decreasing the blood glucose level, reduced the degree of hyperglycemia. Maximal rise of glucose level after the glucose load reached on 30-th min and consisted 7,4±0,2 in comparison with 5,3±0,2 mmol/l, P<0,001 of the initial level. Glucose level was reliable higher the initial level over to 120 min, then the gradually decreasing with the normalization in 180 min occurred, in 210 min it was reliable below the initial level, and in 240 min returned to the initial value again (Figure 4).

Figure 4. Effect of one-time parathyrin injection on the type of alimentary hyperglycemia. *- The reliability of results differences under the initial level; ** - The reliability of results differences under the glucose load
Against the background of PTH injection the glucose load provoked the reliable hyperglycemia over to 150 min, then normalization of glucose level occurred in 180 min, in 210 min glucose level was below the initial value too and returned to norm in 240 min. However, the expression degree of hyperglycemia was essential lower than under only glucose load. Thus, maximal rise of glucose level also occurred in 30 min but it was reliable lower than under only glucose load –6,2±0,2 in comparison with 7,4±0,2 mmol/l, P2< 0,001, responsively. Normalization of glucose level also came in 180 min, it reduced lower the initial level in 210 min and returned to norm in 240 min. It should be noted that under PTH injection the expression of hyperglycemia was reliable less throughout all over intervals of the investigation (Figure 4). The improving of tolerance to hyperglycemia found its expression in values of hyperglycemic and hypoglycemic coefficients. Thus, hyperglycemic coefficient was reliable lower: 1,24±0,03 in comparison with 1,396±0,04 against the background of only glucose load (P<0,001).
Thus, PTH injection provoked the decreasing of hyperglycemia induced by the glucose load, i.e. PTH increased glucose tolerance.
For elucidation of Ca2+ role in biological effect of insulin on glucose consumption by muscle and adipose tissue we were carried out the investigation on the studying of CT and PTH effect on glucose consumption by muscle and adipose tissue in vivo and in vitro.
Injections of CT to rats (Table 1) had no effect on glucose consumption by diaphragmatic and adipose tissue compared to the control (p1>0.5). Insulin injection provoked a considerable increasing of glucose consumption by muscle and adipose tissue (P1<0,001). CT completely blocked the stimulating effect of insulin on glucose consumption by the muscle and adipose tissues (p2<0.001). PTH injection didn’t change glucose consumption by diaphragm and adipose tissue in comparison with control (P1>0,5). Against the background of PTH administration insulin-stimulated glucose consumption by diaphragm and epididymal didn’t change reliably (P2>0,5). Analogous data were also received in investigations in vitro (Table 2). Thus, CT and PTH did not alter glucose consumption, PTH did not affect, while CT completely abolished the stimulating effect of insulin in vivo and in vitro.
Table 1. In Vivo Glucose Consumption by Muscle and Adipose Tissues under the Effects of Insulin, PT, CT (M±m)
Experimental conditions |
Number of
experiments |
Glucose consumption by muscle and adipose tissues during 2-h incubation, μg/100 mg |
p1 |
p2 |
Muscle tissue |
Control |
6 |
140 ± 5 |
- |
˂0,001 |
Insulin |
6 |
203 ± 3 |
˂0,001 |
- |
CT |
7 |
148 ± 10 |
˃0,5 |
˂0,001 |
CT + insulin |
6 |
143 ± 7 |
˃0,5 |
˂0,001 |
PTH |
6 |
150 ± 7 |
˃0,5 |
˂0,001 |
PTH + insulin |
6 |
206 ± 4 |
˂0,01 |
˃0,5 |
Adipose tissue |
Control |
6 |
100 ± 4 |
- |
˂0,001 |
Insulin |
8 |
163 ± 8 |
˂0,001 |
CT |
8 |
101 ± 3 |
˃0,5 |
˂0,001 |
CT + insulin |
6 |
101 ± 9 |
˃0,5 |
˂0,001 |
PTH |
6 |
110 ± 8 |
˃0,5 |
˂0,05 |
PTH + insulin |
6 |
175 ± 6 |
˂0,001 |
˃0,5 |
Note. Here and in Table 2: p1 - compared to the control; p2 - compared to the effect observed against the background of insulin administration.
Table 2. In Vitro Glucose Consumption by Muscle and Adipose Tissues under the Effects of Insulin, PT, CT (M±m)
Experimental conditions |
Number of
experiments |
Glucose consumption by muscle and adipose tissues during 2-h incubation, μg/100 mg |
p1 |
p2 |
Muscle tissue |
Control |
6 |
140 ± 5 |
- |
˂0,001 |
Insulin |
6 |
272 ± 8 |
˂0,001 |
- |
CT |
6 |
135 ± 7 |
˃0,5 |
˂0,001 |
CT + insulin |
6 |
218 ± 20 |
˂0,05 |
˂0,05 |
PTH |
6 |
140 ± 3 |
- |
˂0,001 |
PTH + insulin |
6 |
266 ± 7 |
˂0,001 |
˃0,5 |
Adipose tissue |
Control |
6 |
100 ± 4 |
- |
˂0,001 |
Insulin |
6 |
208 ± 6 |
˂0,001 |
|
CT |
6 |
95 ± 12 |
˃0,5 |
˂0,001 |
CT + insulin |
6 |
100 ± 9 |
˃0,5 |
˂0,001 |
PTH |
6 |
103 ± 2 |
˃0,5 |
˂0,001 |
PTH + insulin |
6 |
206 ± 7 |
˂0,001 |
˃0,5 |
Thus, PTH didn’t effect on glucose consumption by muscle and adipose tissue, didn’t change insulin-stimulated effect on this process. CT completely inhibited insulin-stimulating glucose consumption by tissues, reduced tissue sensitivity to insulin, i.e. CT provoked insulin resistance.
Mechanism of hyperglycemic effect of the preparations of CT is studied not enough. The results of our previous investigations allow consider that it is mediated both due to the inhibitory effect of CT on insulin secretion [11,12], the decreasing of glucose consumption by peripheral tissues [13] and due to the intensification of glycogenolysis process [14,15]. These changes result in hyperglycemia, insulin resistance, and impaired glucose tolerance. Hence, CT can be considered as a contra-insular hormone [2,5]. It can be hypothesized that CT takes part in neuroendocrine regulation of glucose metabolism, especially during hypercalcitoninemia. We consider, that CT, inhibiting insulin secretion, inducing insulin resistance and glucose intolerance, and as a matter of fact, being, in our opinion, contra-insular hormone can promote to the development of the disturbances of carbohydrate metabolism [6].
Under the investigation of PTH effect on glucose homeostasis was established the decreasing of glucose level after hormone injection, the decreasing of hyperglycemic degree under the glucose load. Besides that it is exposed that PTH doesn’t change of tissue insulin resistance. Unlike CT, induced glucose intolerance, PTH, on the contrary, decreasing the blood glucose level, decreased the degree of hyperglycemia, i.e. it increased glucose tolerance. Thus, it is established the opposite to CT action of PTH on glucose metabolism. In this connection, it is acceptable to consider, that PTH is CT antagonist not only concerning to the regulation of calcium metabolism, but and glucose metabolism. Therefore, it can consider that PTH takes part in neuro-endocrine regulation of glucose metabolism being CT antagonist, i.e. PTH as CT [1] is a gluco-regulating hormone.
So, CT and PTH take part in the regulation of calcium and glucose metabolism, receiving data are an additional confirmation of the functional correlation of calcium and carbohydrate metabolism [16]. The establishment of a functional negative correlation between glucose level and the total calcium content after CT and PTH injections testifies about the close interconnection of calcium and glucose metabolism. With respect to interconnection of calcium-regulating hormones and its effect on glucose and calcium metabolism it can consider that under in vivo the effects of CT and PTH can be, in the known degree, the result of changing of circulating Ca2+, in vitro indeed they must consider as the result of direct hormone effect. In other words, in the different cells not having a specialized receptors of CT and PTH occur Ca2+-dependent processes subordinated its regulating effects. Concerning to inter-correlation of the effects of calcium-regulating hormones on glucose metabolism one can suppose that, under hypercalcitoninemia and, correspondently, hypocalcaemia, PTH secretion intensifies, which, in one’s turn, increases calcium level in blood serum, consequence of it there is the increasing of insulin secretion by pancreas β-cells. Apparently, PTH due to hypercalcaemia stimulates insulin secretion, which, in one’s turn, normalizes the blood glucose level and the same one doesn’t make worse glucose tolerance. Analogues data were received under acute hypercalcaemia [17].
It is established, that hypercalcemia [18] and the increasing of intercellular Ca2+ concentration take the important role in insulin secretion by pancreas β-cells [19]. CT, however, inhibits insulin secretion [11,12]. In addition, CT increases glucagon secretion, apparently, due to the decreasing of the total calcium content in blood serum [20]. Apparently, by this way a reciprocal interrelation between CT and PTH secretion and their effect on glucose and calcium metabolism occur, which reveals due to their modulating effect on insulin and glucagon secretion. Therefore, PTH acts as insulin agonist and CT– as antagonist. The interconnection between calcium-regulating hormones, islet apparatus of pancreas and homeostasis of calcium and glucose occurs by feedback mechanisms [21].
↑calcitonin level→Hypocalcemia→↓Insulin secretion→Hyperglycemia
↓
↑Parathormone secretion→Hypercalcemia→ ↑Insulin secretion ↓ Hypoglycemia
Beyond all doubt, neuro-endocrine mechanisms of their interconnection require the further investigation. However, findings on this stage enlarge the conceptions about physiological role of CT and PTH, testify about the involving of Ca2+-mechanisms and give the basis to consider them as the important modulators of secret and metabolic processes.
- Butakova SS, Nozdrachev AD (2010) Calcitonin – glucoregulating hormone. Vestnik of Russian Military Medical Academy 4: 188-196.
- Butakova SS, Nozdrachev AD (2010) Calcitonin--contra-insulin hormone. Adv Gerontol 23: 364-370. [Crossref]
- Moisa SS (2011) Mechanisms of calcium and carbohydrate metabolism regulation. Autoreferat diss. (Dr.Sci.). St.-Petersburg State University, Russia.
- Moisa SS, Nozdrachev AD (2011) Mechanisms of calcium and carbohydrate metabolism regulation (Monograph. LAP LAMBERT Academic Publishing GmbH &Co, pp: 319.
- Moisa SS (2013) Contra-insular effect of calcitonin on glucose metabolism. Bull Exp Biol Med 156: 217-219. [Crossref]
- Moisa SS (2017) Calcitonin Participant in the Development of Insulin Resistance. JBiSE 10: 343-354.
- Moisa SS, Nozdrachev AD (2013) One-time injection of parathyrin increases glucose tolerance. Open J Endocr Metab Dis 3: 293-300.
- Moisa SS, Nozdrachev AD (2014) Calcitonin and parathyrin are glucoregulating. J Mol Genet Med S1: 024.
- Selochnik LI, Briskin AI, Antonova EE (1978) Photoelectrocolorimetric determination of calcium concentration with EDTA and murexide. Chem Pharm J 12: 138-140.
- Frank H, Kirberger E (1950) Eine Kolorimetrische Methode zur Bestimmung der “Wahren Glucose” und Galactose in 0.005 rm3. Blut Biochem Ztschr 320: 359-367.
2021 Copyright OAT. All rights reserv
- Iaroshevskiĭ IuA, Darinskiĭ IuA, Butakova SS (1989) [Effect of calcitonin on insulin and glucagon secretion by the pancreas]. Probl Endokrinol (Mosk) 35: 58-61. [Crossref]
- Butakova SS (2008) Calcitonin, a modulater of pancreas secret process. Mechanisms of functioning of visceral systems: VI All-Russian Conf. with international participant devoted to the 50-th anniversary of discovery of membrane digestion by A.M. Ugolev. Thesis of addresses. Saint-Petersburg. Institute of Physiology named by I.P. Pavlov of The Russian Academy of Scienses, pp: 26-27.
- Butakova SS, Nozdrachev AD (2009) Effect of calcium-regulating hormones and calcium channel modulators on glucose consumption by muscle and adipose tissues in vivo and in vitro. Bull ExpBiol Med 148: 171-174.
- Butakova SS, Nozdrachev AD (2011) Mechanisms of hyperglycemic effect of calcitonin. Bull Exp Biol Med 150: 320-323. [Crossref]
- Yamaguchi M (1981) Calcitonin stimulates gluconeogenesis in fasted rats. Endocrinol Jpn 28: 51-57. [Crossref]
- Moisa SS (2018) Biological Significance of Hypercalcitoninemia and Hypocalcemia in Blood under Different State of Carbohydrate Metabolism in Ontogenesis of Rats. Int J Mol Biol OpAc 3: 00045.
- Gedik O, Akalin S, Koray Z (1980) Effect of acute hypercalcaemia on glucose tolerance and insulin release in human beings. Acta Endocrinol 94: 196-200.
- Parthemore JG, Deftos LJ (1978) Calcitonin secretion in normal human subjects. J Clin Endocrinol Metab 47: 184-188. [Crossref]
- Kim HS, Yumkham S, Lee HY, Cho JH, Kim MH, et al. (2005) C-terminal part of AgRP stimulates insulin secretion through calcium release in pancreatic beta Rin5mf cells. Neuropeptides 39: 385-393.
- Panzig E, Besch W, Rosenbaum KD, Tietz W, Kiene S, et al. (1985) The effect of potassium, calcium and magnesium concentration on insulin and glucagon secretion of the perfused dog pancreas. Exp Clin Endocrinol 86: 61-68.
- Zoloev GK, Slepushkin VD, Yakovleva RA (1984) Relationships between the two-valency cationes, the function of the insular apparatus of pancreas and calcium-regulating hormones under the alteration of blood glucose level. Human Physiol 10: 450-453.


