This paper illustrates a prototype for a Clinical Decision Support System (CDSS), using Supervised Machine Learning (SML) to derive rules from pre-constructed cases or to automatically generate rules. We propose an integrated architecture invoking two main components - Rule Pattern Matching Process (RPMP) and Auto Rule Generation Process (ARGP). The RPMP searches for and matches rules from a clinically derived reference set, successful discovery resulting in continued processing through the system. If no rule is found, the AGRP is automatically activated. The AGRP has been designed based on the SML approach. A Decision Tree Algorithm has been used and nested If-else statements applied to transform the decision tree algorithm to generate rules. For experimental purposes, we have developed a prototype and implemented a learning algorithm for generating auto rules for the diagnosis of Acute Rheumatic Fever (ARF). Based on results, the prototype can successfully generate the auto rules for ARF diagnosis. The prototype was designed to classify the ARF stages into “Detected”, “Suspected” and “Not detected”, in addition, it has classifiers capable of classifying the severity levels of detected stage into Severe, Moderate or Mild case. We simulated a set of 104 cases of ARF and observed the rules. The prototype successfully generated the new rule and classified it with the appropriate category (stage). In summary, the applied approach performed extremely well and the developed prototype provided reliable rules for ARF diagnosis. This prototype therefore reduces the task of manually creating ARF diagnosis rules. This approach could be applied in other clinical diagnosis processes.
machine learning, decision tree algorithm, rule-based system, rheumatic fever, decision support system
According to Arthur Samuel (1959) IBM Scientist, Machine Learning is a “Field of study that gives computer the ability to learn without being explicitly programmed”. Tom Mitchell (1997) argues that “A computer program is said to learn from experience E with respect to some task T and some performance measure P, if its performance on T, as measured by P, improved with experience E. [1]” According to Herbert Simon - “Machine Learning is concerned with computer programs that automatically improve their performance through experience.” Machine Learning (ML) is a sub-field of Artificial Intelligence and a popular method that can be applied to several complex problem domains for automating system performance. It has been used in disease diagnosis, drug-to-drug reaction, clinical information system, game play, pattern matching, prediction, natural language processing etc., and huge efforts have been directed towards the development of ML techniques. This has resulted in the publication of much research into applications in the last few years. ML can be roughly divided into Supervised, Unsupervised and Semi-supervised learning problems [2,3]. Unsupervised ML is where we provide a group of data and programs identify the patterns and the relationship therein. Unsupervised learning is a computer program that can learn to identify process, pattern and relationship without a human guidance, whereas in supervised learning approach we train the computer to map an input to an output (where the input and the output are known) based on given predefined “training example data”. The input variables (x) and an output variable (y) then use algorithms to learn the mapping function form both, therefore:
Y = f(x), when new input data (x) can predict the output variables (y) for the data.
Moreover, a supervised learning algorithm analyses the “training data example” and determines the class labels or reaches an appropriate conclusion when the new data is given. In summary we could say that in supervised techniques the instances are labelled instances and in unsupervised techniques the instances are not labelled instances and they can also be referred to as clustering techniques. In Reinforcement learning, system learns from mistakes [2,3]. The evaluation of classifier (algorithm) is based on the accuracy of prediction that shown below [1]
Accuracy = number of correct classification / total number of test cases.
After reviewing and studying various lecturer notes, workshops, conferences and journal papers, the diagram below illustrates the most useable algorithms in Machine learning [4-17] (Figure 1).
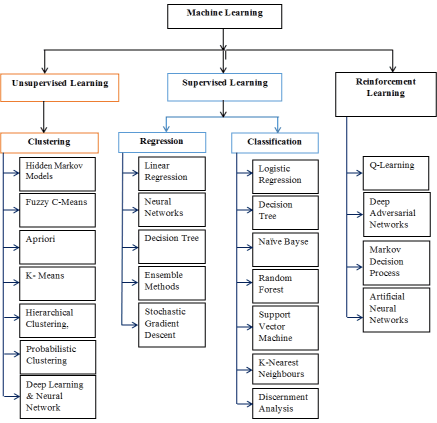
Figure 1. Useable algorithms in machine learning
Supervised ML techniques, which trains a model on pre known input and output data to make the future prediction. It is a learning task of inferring a function from the training dataset. There are three types of datasets in ML, they are (a) training data set (b) dev data set and (c) test data set. These three data sets will be used in various stages of ML application development phase. The training datasets will have of a set of observation with its outcome. Basically, of 80% training data and 20% testing data will be allocated for supervised machine learning approach. So, it can be said that supervised learning approach is to develop model based on pre-defined input and output data. In the supervised learning there are two techniques can be used for developing the model, [10] they are:
- Classification: This technique is used to predict categorical values or predict discrete response, for example – whether a particular tumour is cancerous or not. OR “is this X or Y” OR true or false, 0 or 1 etc. There are different types of classification (a) Multi Class Classification where two or more class will be appeared and must be assign to one and only one target label for example Animal can be tiger or dog but not both at the same time; disease or no disease, (b) Binary Classification that has two possible outcomes e.g. 1 or 0, Yes or No, Black or White etc (c) Multi Label Classification – each sample is mapped to a set of target label; it can be more than one class e.g. person can have high blood pressure, high sugar, high cholesterol or under/over active or normal thyroid etc.
- Regression: Then regression technique is used to predict the numerical values or continuous response for instance “how much?”, “hoy many?”, “doing certain types of exercise in two months how many weight can be reduced”.
There are many different algorithms available for both supervised and unsupervised learning and each have different approaches. There is not best method or algorithm that is suitable for all. These points should consideration before selection of any algorithms: types of study; trial and error, size and type of data; purpose of research; how to use outputs? So, in the linear regression: a) prediction will be based on the linear value; b) logistic regression – for categorical classification e.g. yes class or no class; 1- class or 0 –class; c) Polynomial regression for multiple input.
In this section, we discuss machine learning design and development process, our proposed technique and concept to generate the auto rule for clinical decision support system. In the next section - Experiment and Evaluation, we discuss how we applied our proposed technique and algorithm.
Supervised ML algorithm takes known datasets of input data or the training dataset and known response to the output data, and trains a model to generate predictions for the response to input data. It is suitable if we know the existing input and output data. The classification rule learning task can be defined as follows: Given a set of training examples (instances for which the classification is known), find a set of classification rules that can be used for predicting or classifying new instances, i.e., cases that have not been presented to the learner before.
Classification = {condition1, condition2, condition3……..condition …n }
Classification rules are of the form:
IF Condition(s) is TRUE THEN Class = X1.
IF Condition(s) is TRUE Then Class = X2.
Decision Tree (DT)
In the DT each node represents an attribute or feature and each branch represents a decision and each leaf represents outcomes that can be categorical or continues values. There are many algorithms that can be used to build a DT for instance CART (classification and Regression trees that is uses Gini Index classification as metric; ID3 (Iterative Dichotomiser 3 – mostly used and simple, using a Minimum Entropy Function and Maximum Information Gain as metric [11,12]. DT commonly used algorithms for predictive modelling. Classification and Regression trees are types of decision trees. This term CART was introduced by Leo Breiman, he was a distinguished statisticianat the University of California, Berkeley.
Classification Trees are suitable for use in analysing categorical traits or responses to such type of variables, to achieve datasets that will be separated into diverse classes based on the response variables. Regression Trees are used to model continuous or numerical behaviour; it can also be divided into binary variable or continuous variable. The CART methods basically break the data set into very smaller groups based on the predictor variables. Classification and Regression Trees are using to predict influenza in primary care patients. The CART model was used to develop models that showed the good sensitivity and high negative predictive value [13]. The DT algorithm was used in the prediction of mortality in patients with isolated traumatic subarachnoid haemorrhage. The DT classification, CART was used to separate the group 1 for died and 0 for survived and partitioned the data and predicated class or subgroup. The accuracy of using DT classifier has been noted as 97.9% [14]. The DT classifier was used in the identification of Pancreatic Injury in Patients with Elevated amylase, and the DT achieved an accuracy of about 98%.
Classification and Regression Trees (CART) [15] software is available to develop model that can classify response into various categories. We have used to DT algorithm to create a simple model that predicts by learning a simple decision rule from the training data and generate the auto rule. The proposed architecture for auto rule generation is given below:
Proposed Architecture for Auto Rule Generation
The following diagram (Figure 2) shows the entire process and required components to generate the auto rule for clinical decision support system.
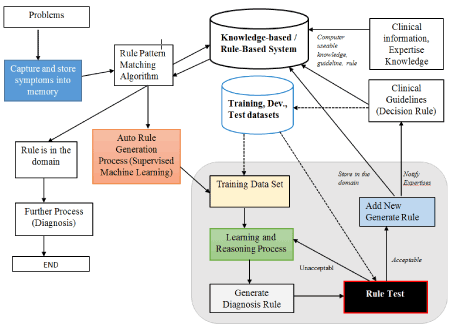
Figure 2. Proposed architecture for auto rule generation
The components and process are explained below:
- Knowledge-based / Rule – Based System: Capture and store the expertise knowledge and clinical information.
- Training, Dev and Test data sets preparation and setup.
- Rule Pattern Matching: this process reads the symptoms from computer memory and starts to match the rules in the rule-based system. If rule available then, display the rule and further process will be started. If rule is not available then auto rule generate algorithm will be activated.
- Learning Algorithm: There are various algorithms for supervised machine learning which have been presented in above (introduction). Selection of algorithm will be depend up on the various factors, the problems, availability of data, type, format and structure of data. The most used algorithm for supervised machine learning for classification problem is Decision Tree Algorithm, and in this work we have used DT Algorithm.
- Once the new rule is generated, the rule testing mechanism will evaluate the rule (doctors or expert can also either accept or reject the rule) and accepted rule will store on the database.
- Once the rule has been added, there is scope for experts to revise, delete or add new parameters in an added rule if necessary.
This is an extension a PhD work by the first author. In this research work, we have developed a tool capable of generating rules automatically in a clinical decision support system. The tools aid in the construction of a rule for the diagnosis of Acute Rheumatic Fever (ARF), we have applied the architecture proposed above (Figure 2) to auto generate the rules. The benefit of using an auto rule generating process (algorithm) is that it assists whenever adding a new rule requiring domain expertise, knowledge engineering and a programmer, which can be a time consuming process and dependent upon the availability of all experts. The auto rule generation process helps by performing all tasks such as those pertaining to expertise, knowledge engineer and programmer by adding a new Rule using the rule-based system.
A supervised learning technique automatically produces rules for ARF to classify outputs of Detected, Suspected or not Detected, based on patients screening symptoms (Table 1). A learning technique also generates the auto rule for identify various stages of ARF in the form of Severe, Moderate and Mild based on the screening symptoms (Table 1) and ARF knowledge-based.
Table 1. Signs and Symptoms of ARF
Coding |
Signs and Symptoms of ARF |
A. |
Major Manifestations |
Ar. |
Arthritis (large joints pain or tenderness/inflamed) |
ar1 |
Severe Pain (Ankles, Knees, Wrists, Elbows, Hips, Shoulders) |
ar2 |
Pain Associated with Swelling, Hotness, Redness, Movement Restriction (limitation of movements) |
ar3 |
Migratory / Shifting Severe Pain (shifting of arthritis between in the joints) |
Cr |
Carditis: Inflammation of the Heart Valves |
cr4 |
Currently Present Heart Murmur |
cr5 |
Chest Pain / Difficulty in Breathing/ Palpitation |
Ch |
Sydenham’s Chorea: (St. Vitus’s Dance) |
ch6 |
Muscle Weakness Hands and Feet |
ch7 |
Twitchy and Jerking Movements of Hands, Feet, Facial Muscles, Tongue |
Sn |
Subcutaneous Nodules |
sn8 |
Painless lumps on the outside surface of Wrists or Elbow or Ankles or Knees groups 3-4 (up to 12) |
sn9 |
Lumps round / firm and freely movable size from 0.5-2.0 cm |
Em |
Erythema Marginatum |
em10
em11 |
Painless, flat pink patches on the skin
Not itchy or painful and has well-defined borders |
B. |
Minor Manifestations |
fe12 |
Fever |
art13 |
Arthralgia (joints pain) |
ecg14 |
Prolonged P-R interval on ECG |
crp15 |
Raised or Positive CRP |
esr16 |
Raised ESR |
C. |
Mandatory/Essential |
prt17 |
Positive Rapid Strep Test |
ast18 |
Raised (Positive) Anti-Streptolysin O tire (ASOT) |
Gs19 |
Positive throat culture for GAS infection |
The following techniques were applied to collection and preparations of data (symptom collection and preparation) are:
- Binary classification of symptoms: Observed all the ARF symptoms; most of them are answered in the form of Yes or No, 1 or 0, True or False.
- Ranking: Ranking algorithm, which rank the symptoms in order, based on the knowledge based system. During the ranking process also captured tentative period or duration of symptoms present time; and to process it we applied temporal logic.
- Multiclass classification: the diagnosis of ARF has multiclass (this one was determined by NHF expertise and Nepal Heart Foundation (NHF) guidelines). Based on the presenting patient’s ARF symptoms, the system classified the output of ARF as either in Detected, Not Detected, or Suspected.
- Multi classification for detected case – Mild Case, Moderate Case and Severe Case
In the auto rule generation task, first we have to identify the related symptoms of ARF. The system are given below (Table 1). For more information about the selection of symptoms please refer paper [18] and PhD thesis, here we have just listed the symptoms. We have applied a decision table and decision tree algorithm to classify the label (category) and generate the auto rule. Decision trees are quite easy to understand and are a good choice as some of the best models in data science.
Classification of ARF stages and rules
The supervised ML approach informs the machine algorithm how to identify the stage and severity level of ARF automatically, based on the experience, so classifier does this task. The concept of classification is to use an appropriate model which predicts the output in this case of ARF Stage and Severity Level of ARF using a ARFs’ Symptoms (input variable). This classification process is peer formed on the set of rheumatic fever dataset. So, the ARF stage label (category), ARF severity label (category) and ARF datasets are given below:
ARF Stage Label (category) à SL = {S, D, N} where S=Suspected, D=Detected, N= non detected
ARF Severity Label (category) à SC = {S, M, D}, where S = Severe, M = Moderate and M = Mild
ARF symptoms

Decision Tree for ARF stages
Figure 3 shows decision tree for ARF stages.
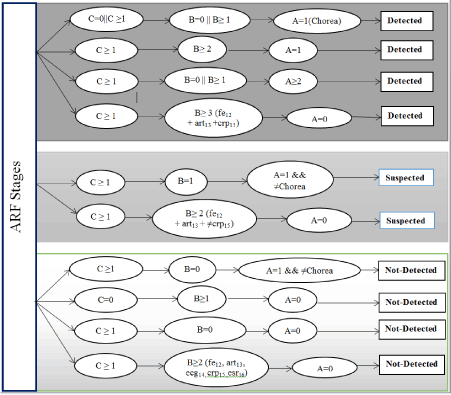
Figure 3. Decision tree for ARF stages
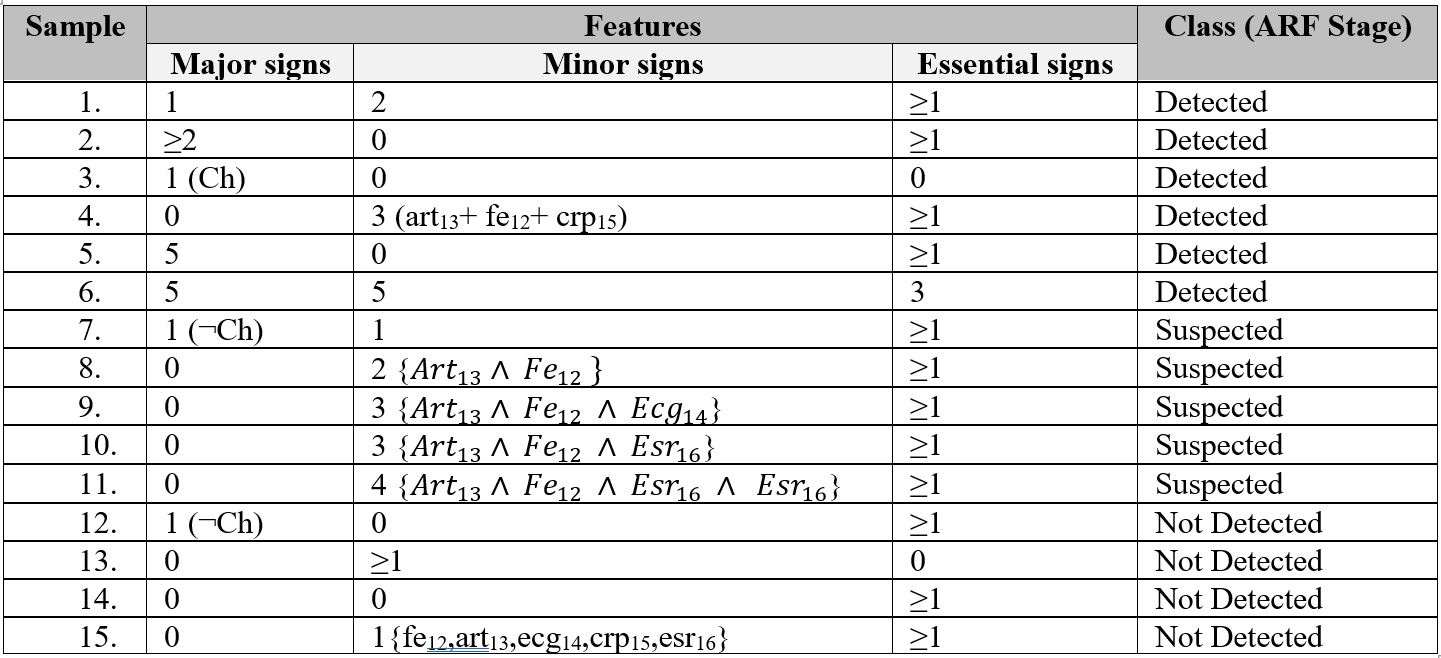
So we have number of observing symptoms and three categorical values (Suspected, Detected or Not Detected). Prepared the possible of training datasets; the total sample is 15; where 6 (40%) are detected, 5 (33.34%) are suspected and 4 (26.64%) are not-detected sample (Table 2).
Table 2. Training datasets for ARF Sages
Rules for identification ARF stages
The Nepal Heart Foundation (NHF) also follows the guidelines set by the WHO. The NHF overall diagnosis process for ARF detected case is given in Figure 4.
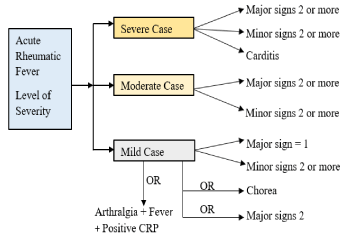
Figure 4. Signs and symptoms for different level of the severity
The signs and symptoms captured by the ARF diagnosis system represent observable traits in ARF patients and use rules developed from experts guidelines within NHF criteria. Depending upon observed traits in ARF patients, the system can diagnose an ARF case defined with ARF’s severity level index into three categories. This categorisation is shown in Figure 4. Rules were designed based on the signs and symptoms for detected and suspected cases. During the formation of rules, expert guidelines from NHF were used. The equations, Nos.1-11, are given below, which lists the rules. A New Rule Formation algorithm was later developed to produce a rule to be added if a particular rule is not already present in the rule-based system. This algorithm was designed and developed using the decision tree discussed in the New Rule Formation section.
Again, it is an appropriate choice to apply the Boolean logic to the design rules where observations consist of logical forms: present or absent; positive or negative. Therefore, in this model Knowledge base system consists of a set of Boolean rules for diagnosis and severity level of ARF. All ARF signs and laboratory results are facts. A set of rules is described by the respective expert’s knowledge of diagnosing ARF based on these facts. The model rule engine (condition-action-rules or premise-consequence-rule e.g. IF-THEN) inference combines the rules and facts for application in the reasoning process. In addition, the reasoning process will match the pattern (matching the condition part of rules against facts stored) and fire the satisfied one with justification. The justification of each rule provides the WHO, World Heart Federation or NHF’s information regarding diagnosis of ARF. The following equations Nos.1-11 (below), have been created based on expert guidelines used to identify the severity level of ARF in confirmed cases.

Training dataset for auto rule generation
The training dataset for auto rule generation (Severe, Moderate, and Mild) is given in Table 3.
Table 3. Training datasets for auto rule generation

A patient’s symptoms are captured in a Boolean expression such as “True” or “False”, “0” or “1” etc. We use “P=present” if verified signs are presented or observed and “A=absent” if signs are not presented or not observed. A set of rules have been created for all the severity levels of ARF. Each rule has symptoms in the condition part and corresponding severity levels of ARF with numbers of positive symptoms placed in the consequence part. The mixed reasoning methods (both backward and forward reasoning/chaining) have been applied. In the model, some of the rules were specially designed and used for forward reasoning and others used for backward reasoning. The purpose of applying the mixed reasoning process is to maximize the diagnosis efficiency of ARF. Based on the above equations (1-11), we formulated IF-THEN rules, which the inference engine uses to diagnose cases of ARF, for example:
IF
Arthritis =”P” AND Carditis=”P” AND Chorea=”A” AND SN=”A” AND EM=”A” AND Fever=”P” AND Arthralgia=”P” AND Throat Infection=”P” AND GAS=”P”
THEN
ARF Stage: “Detected ARF”
Diagnosis: “Acute Rheumatic Fever”
Level of Severity: “Severe Case”
Explanation
Severe pain in the large joints with swelling or redness, movement restriction, carditis heart murmur presented with pain, current high temperature, small joints pain, GAS infection in the throat is positive including all throat infection. Based on the NHF guideline including timeframe of symptom appearance and development (Temporal Template) if this case is Acute Rheumatic Fever the level of severity is SEVERE. Immediate treatment required, follow medication guidelines. Seek advice from specialist or refer patient to nearest hospital as soon as possible if medication option currently not available.
No. of positive symptoms: 6
Rule based system is being used and popular method for solve the complex problem. Rules are more interpretable than other modelling method compare to neural network, support vector machines etc.
Auto rule formation
During the process of Rule Pattern Matching, if a rule has not been found in the rule-base then the Auto Rule Generation Process (ARGP) is activated which has process for generating a new rule. ARGP is a self-developing algorithm based on the supervised machine learning approach that is applied in this system for construction of any new rule. The algorithm was developed based on the Decision Tree Algorithm and implemented using nested IF-ELSE decision. There is scope for experts to revise, delete or add new parameters in an added rule if necessary. The benefit of using this algorithm is that it assists whenever adding a new rule requires domain expertise, knowledge engineering and a programmer, which can be a time consuming process and dependent upon the availability of all experts. The ARGP helps by performing all tasks such as those pertaining to expertise, knowledge engineer and programmer by adding a new Rule using the rule-based system.
The Decision Tree was created based on the signs and symptoms for different severity levels of ARF and made use of NHF’s expert guidelines. The Decision Tree was applied in the ARF process of application, which is given below:
Decision tree for severe cases: The Decision Tree for a severe case of ARF is shown in Figure 5. The process and equations are shown in Figure 6.
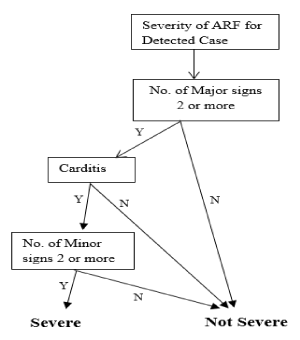
Figure 5. Decision tree for severe case
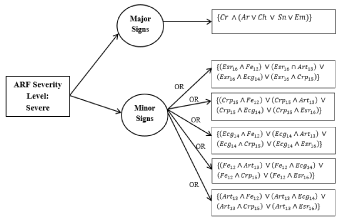
Figure 6. Auto rule formation learning for severe cases
Decision tree for moderate cases: The decision tree for a moderate case of ARF is illustrated in Figure 7 and the process and equations are shown in Figure 8.
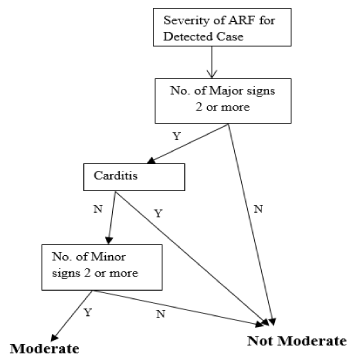
Figure 7. Decision tree for a moderate case
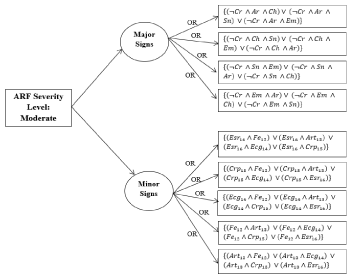
Figure 8. Auto rule formation learning for moderate cases
Decision tree for mild cases: The Decision Tree for a mild case of ARF is illustrated in Figure 9 and the process and equations are shown in Figure 10.
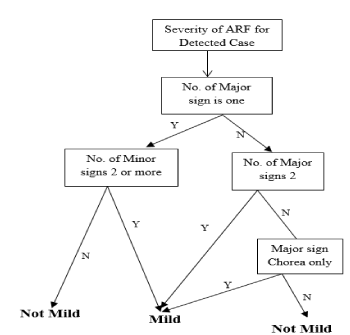
Figure 9. Decision tree for mild cases
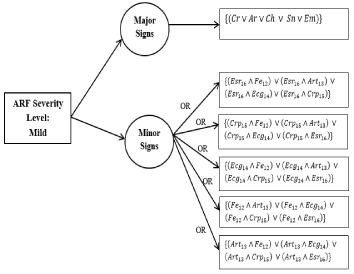
Figure 10. New rule formation process and equations for mild cases
Experiment of Prototype
The prototype was developed using C#.net front end and MS Access backend. The screenshots of prototype are given below:
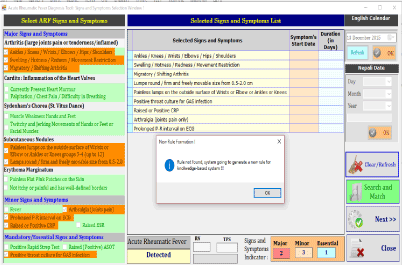
- Screening and Recording the patient’s symptoms; and search rule below:
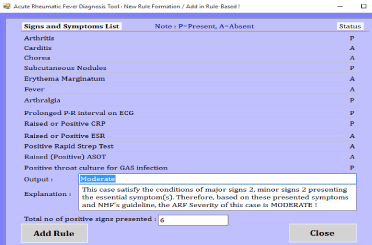
- The prototype generates a new rule based on the supervised machine learning below:

- Verify rule and added into system
This paper described a supervised learning approach for generating auto rules for Clinical Decision Support System (CDSS). As part of this research work, we created a CDSS prototype and the applied supervised learning approach to generate auto rule for ARF. The prototype was designed to classify the ARF stages into “Detected”, “Suspected” and “Not detected”, in addition, it has classifiers capable of classifying the severity levels of detected stage into Severe, Moderate or Mild case. We simulated a set of 104 cases of ARF and observed the rules. The prototype successfully generated the new rule and classified it with the appropriate category.
Our CDSS technique is based on an integrated architecture that has main two components - Rule Pattern Matching Process (RPMP) and Auto Rule Generation Process (ARGP). The success and effectiveness of our prototype in diagnosing ARF provides a promising foundation for future CDSS work. It is our view that our work can be expanded to create other CDSS tools for diagnosing several other diseases in future with reasonable potential for success.
- Mitchell T (1997) Machine learning. New York: McGraw Hill.
- Kotsiantis SB (2007) Supervised machine learning: A review of classification techniques. Informatica 31: 249-268.
- Jain AK, Murty MN, Flynn PJ (1999) Data clustering a review. ACM computing surveys. CSUR 31: 264.
- Dr. Stephen Weng (2018) Introducing machine learning for healthcare research. University of Nottingham Accessed on 27/12/2018. Available at: https://www.nottingham.ac.uk/research/groups/primarycarestratifiedmedicine/documents/s-weng-machine-learning-presentation-25.1.18.pdf
- Lemon SC, Roy J, Clark MA, Friedmann PD, Rakowski W (2003) Classification and regression tree analysis in public health: methodological review and comparison with logistic regression. Ann Behav Med 26: 172‐181. [Crossref]
- Loh (2011) Classification and regression trees, Wiley interdisciplinary reviews: Data mining and knowledge discovery, ©2011 John Wiley & sons, Inc. WIREs Data Mining Knowl Discov 1: 14‐23
- Loh (2014) Fifty years of classification and regression trees (with discussion). International statistical review.
- Gartner (2017) Preparing and architecting for machine learning. Access on 02/1/2019.
- Lewis RJ (2000) An introduction to classification and regression tree (CART) analysis. Accessed 21/12/2018. https://pdfs.semanticscholar.org/6d4a/347b99d056b7b1f28218728f1b73e64cbbac.pdf.
- Brodley CE (2019) Padhraic smyth, the process of applying machine learning algorithms. Accessed on 02/11/2019. http://citeseerx.ist.psu.edu/viewdoc/download?doi=10.1.1.52.8387&rep=rep1&type=pdf.
- Rokach L, Maimon O (2005) Top-down induction of decision trees classifiers—A survey. IEEE Trans Syst Man Cybern 35: 476-487.
- Witten IH, Frank E (2005) Data mining: Practical machine learning tools and techniques, 2nd ed.; Morgan Kaufmann: Burlington, MA, USA.
- Zimmerman RK, Balasubramani GK, Nowalk MP, Eng H, Urbanski L, et al. (2016) Classification and regression tree (CART) analysis to predict influenza in primary care patients. BMC Infect Dis 16: 503.
- Rau CS, Wu SC, Chien PC, Kuo PJ, Chen YC, et al. (2017) Prediction of mortality in patients with isolated traumatic subarachnoid hemorrhage using a decision tree classifier: A retrospective analysis based on a trauma registry system. Int J Environ Res Public Health 14: 1420.
- Breiman L, Friedman JH, Olshen RA, Stone CJ (1984) Classification and regression trees (Wadsworth statistics/probability). Boca Raton: Chapman & Hall.
- https://en.proft.me/2015/12/24/types-machine-learning-algorithms/
- Dr. Stephen Weng (2019) Introducing machine learning for healthcare research. University of Nottingham. Accessed on 27/12/2019. Available at: https://www.nottingham.ac.uk/research/groups/primarycarestratifiedmedicine/documents/s-weng-machine-learning-presentation-25.1.18.pdf.
- Sanjib P, Ma J, Chong L (2015) Development of temporal logic-based fuzzy decision support system for diagnosis of acute rheumatic fever/rheumatic heart disease.


