Cerium oxide polyaniline nanocomposites were synthesized in an effective manner to produce a uniform core-shell structure of the particles. This nanocomposite was then used in the photocatalytic synthesis of aniline. Synthesis conditions, heat treatment, and other factors that affect the structural properties of nanocomposite were studied extensively to optimize the synthesis process. Polyaniline nanospheres (PANI_NS) were prepared by the microemulsion method. Polyaniline nanoparticles (PANI_NP) were fabricated through polymerization (chemical oxidative process) of aniline. Specific surface area values of PANI_NS, CeO2@PANI_NS, PANI_NP, CeO2@PANI_NP, and CeO2_NS were 200, 260, 40, 110 and 130 m2/g respectively. The photo-catalytic effeciency of the nanocomposite was investigated through converting nitrobenzene to aniline via reduction reaction under visible light illumination. CeO2@PANI_NS outperforms CeO2@PANI_NP 1.4 times, PANI_NS 2.5 times, PANI_NP 6.6 times, CeO2_NS 14.3 times in terms of photocatalytic reduction of nitrobenzene to aniline.

CeO2, Polyaniline, Nanospheres, Nanoparticles, Photocatalytic preparation of aniline, Visible light
Polyaniline (PANI) is a conjugated polymer that attracted researchers attention as it possesses favorable properties towards photocatalysis and other applications. These properties include absorption of light in the visible range, environmental stability, high conductivity, and corrosion resistance [1]. Generally, inorganic nano oxides such as TiO2, ZnO, CeO2, WO-3, and many others; have been widely used in photocatalytic reactions. Researchers also try to combine inorganic nanomaterials with organic polymers in efforts to prepare catalytic composites with high efficiency. Ameen et al. synthesized a PANI ZnO composite and used it effectively in methylene blue dye degradation [2]. Sharma et al. synthesized PANI/CdS nanoflowers and nanorods nanocomposites and used them in photodegradation [3]. Ozbay et al. reported photo-catalytic efficiencies of polyaniline-modified ZnO and TiO2 beneath Vis light [1]. The photocatalytic efficiency of polyaniline sensitized nano-crystallite titania structures has been investigated by Min et al. [4]. Many researchers studied the various structure of PANI and TiO2 composites. These structures include nanotubes [5,6], bionic nanopapilla [7], and A core-shell structure [8]. Agarwal reported the fabrication of polyaniline/ZrO2 oxide conductive nano-composite required for many applications such as adsorption of dyes [9]. Patil et al. developed a sensor for the detection of NH3 utilizing copper nanoparticle intercalated polyaniline nanocomposite thin films [10]. Salvatierra et al. studied Carbon nanotube/polyaniline nanocomposites [11].
CeO2 is known to be a good catalyst for its special redox property and high oxygen storage capacity this catalyst has been studied by numerous researchers [12-14]. PANI and CeO2 combination also received some attention. Yongjun He reported the synthesis of polyaniline/nano CeO2 arrangement microspheres by means of a solid-stabilized emulsion regime. The synthesized Polyaniline/nano-CeO2 composite microspheres had an average diameter of 7 mm [15]. Chuang and Yang used CeO2 to oxidize aniline for the fabrication of (CeO2/PANI) core-shell nano structures. They reported a polygonal shape of the PANI/CeO2 nanocomposites [16]. Kumar et al. exploited in-situ polymerization to prepare the PANI/CeO2 nanocomposite and reported the structure of this composite [17]. Sasikumar et al. reported the use of aniline, HCl, CeO2 nanoparticles, ammonium persulfate, and water to synthesize PANI/CeO2 composite and used it as a corrosion inhibitor [18]. Da Silva et al. reported the fabrication of poly-aniline ES-PANI Cl-salt in the existence of CeO2. They concluded that CeO2 molecules designing a core-shell arrangement with non-homogeneous shape and size have been coated with a delicate layer of ES-PANI nano-tissues [19].
Here we report, a novel method for the preparation of a uniform core-shell spherical PANI CeO2 nanocomposite. In the preparation of PANI_NS, ammonium persulfate was used as an oxidant, ethanol and n-butyl alcohol was utilized as solvents, Na-salt of dodecyl benzene sulfonic acid was used as a surfactant. Poly vinyl pyrrolidine was used in the preparation of CeO2@PANI nanocomposites.
Chemicals
Monomers of aniline (purity of 99 %, Aldrich), cerium isopropoxide, poly vinyl pyrrolidine (PVP), ammonium persulfate (APS), sodium dodecylbenzene sulfonate (SDBS), ethanol (99.8%), n-butyl alcohol (BA), and hydrochloric acid (HCl, 37%) have been utilized without any further purification.
Fabrication of polyaniline nanospheres
The microemulsion method was employed to prepare polyaniline nanospheres (PANI_NS). In this procedure, 6.0 g of sodium dodecyl benzene sulfonate (SDBS) was dissolved in 100 mL of distilled water while maintaining the pH= 0.3 with the use of HCl solution. 1.3 mL of aniline monomer was added to the mixture. After stirring for 60 min 4 mL of n-butyl alcohol (BA) was drop-wisely introduced to the mixture. The system temperature was adjusted at 25 °C, and 33 mL of 10% ammonium persulfate (APS) solution was introduced to the reaction medium and the resultant system was agitated for additional 5 h to achieve polymerization of the aniline monomer. A change of color from brown-yellow to dark-green was observed during the stirring process. The mixture was cleaned several times via ethanol and distilled water and then left to dry for 12 h at 70 °C using a vacuum oven to collect PANI_NS.
Preparation of polyaniline nanoparticles
Polymerization of aniline was performed to fabricate poly-aniline nanoparticles (PANI_NP) adopting the chemical oxidation route. In this procedure, 1.3 mL of aniline monomer was added to 100 mL of HCl aqueous solution under vigorous stirring at 1°C. A 33 mL portion 10% APS solution was introduced to the system which was agitated for 5h. The mixture was cleaned many intervals with ethyl alcohol and distilled water under vacuum. The resultant yield was kept to dry for 30 h at 70 °C using a vacuum oven and PANI_NP for further use. Preparation of CeO2@PANI nanocomposites
A mixture of 0.3 g of PVP and 1.6 g of PANI_ NS or PANI_NP were dispersed in 30 mL of ethanol using Ultrasonic Cleaner for 60 min. Then, cerium isopropoxide solution (100 mL of 0.3 mol/L) was added to the mixture with further dispersion in the ultrasonic bath for 3 hrs. The mixture was cleaned many intervals with distilled water and ethanol under vacuum distillation. After drying overnight at 100 °C, the product material was calcined for 4 h at 350 °C. Both CeO2@PANI_NS and CeO2@PANI_NP were synthesized by this mannar. For comparison purposes, pure CeO2 nanospheres were prepared by the above-mentioned procedures without the use of PANI_NS or PANI_NP.
Characterization
JEOL-JEM-1230 transmission electron microscope was used to observe the morphology and sample dimensions of the prepared materials. To get the TEM images, samples were ultrasonicated for 30 m after suspension in ethanol. A small portion of the suspended sample was left to dry on the carbon covered Cu grid and introduced to the spectrometer.
The surface area was determined via N2-adsorption evaluations of the specimen adopting Chromatech instrument (Nova 2000 series) at 77 K. specimens were heated at 100 °C beneath vacuum for 2h to complete this measurement.
Bruker axis D8 XRD system was utilized to observe the crystallite points of the nanocomposites. XRD was observed employing Cu Kα radiation (λ = 1.540 Å) at ambient temperature.
A spectrometer (Thermo-Scientific K-ALPHA) has been utilized in order to attain x-ray photoelectron spectroscopy (XPS) measurements. Whereas, a spectrophotometer (Jasco, Japan) was adopted to attain UV-Vis-DRS spectra that were recognized at ambient temperature in the absorption space from 200 up to 800 nm. Band gap performance has been determined by applying the observed UV-Vis-DRS. In addition, a fluorescence spectrophotometer of Shimadzu type has been utilized to record photoluminescence emission spectra (PL). A transmittance mode FTIR spectrum was documented for a powdered sample and KBr applying a JASCO-type spectrometer keeping the spectral resolution of 2 cm-1 at ambient temperature.
Photo-catalytic tests
The efficiency of the prepared nanocomposites was tested on the reduction of nitrobenzene into aniline. For this purpose, a known weight of the photocatalyst was scattered by means of ultrasonic in a 10 mL nitrobenzene-CH3OH solution (1/99, v/v) with starting dose of nitrobenzene (NB) at 8.13 × 10⁻⁴ molL-1. The reaction mixture was illuminated under artificial visible light produced from Xenon lamp mounted on a photocatalytic reactor. A λ > 420 nm cutoff filter was used and a running water tube was exploited to prevent heating which allowed the reaction solution to be kept at about 30 °C. The fixed container, made of quartz, was placed at 11 cm from the origin of illumination. Before starting, dissolute O2 is flushed from the solution by nitrogen for 0.5h. Illumination time was set at 2.5 h for each experiment. After exposure specimens were removed from the reactor, centrifuged for 20 min (7000 rpm). Finally, the solution was filtered via a filter of 0.2-µm pore size in order to get rid of any remaining molecules. Agilent Gas Chromatograph (GC 7890A model) was applied to analyze the resulting aniline from the reduction process.
Characterizations of materials
Figure 1 shows XRD diffractograms of PANI_NP, PANI_NS, CeO2_NS, CeO2@PANI_NP, and CeO2@PANI_NS samples. The broad peak at ~ 15- 25° suggests polyaniline phase structure for PANI_NP, PANI_NS. On the other hand, CeO2_NS, CeO2@PANI_NP, and CeO2@PANI_NS are composed of CeO2 phase as characteristic peaks of polyaniline disappeared in the spectra of CeO2@PANI_NP and CeO2@PANI_NS. Also, the decrease in the intensity of the characteristic peaks of CeO2 phase in the spectra of CeO2@PANI_NP and CeO2@PANI_NS suggests that doping of polyaniline decrease crystallite sizes of both composites.
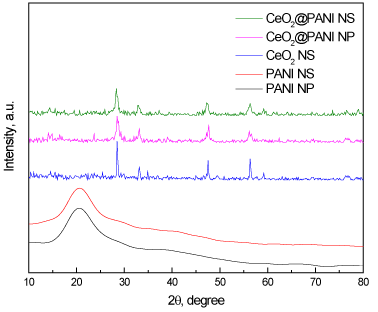
Figure 1. XRD patterns of PANI_NP, PANI_NS, CeO2_NS, CeO2@PANI_NP, and CeO2@PANI_NS.
Figure 2 exhibits TEM pictures of PANI_NP, PANI_NS, CeO2_NS, CeO2@PANI_NP, and CeO2@PANI_NS samples. PANI_NP and CeO2@PANI_NP are nanoparticle shape with sizes of 60 and 75 nm, respectively. However, CeO2_NS, PANI_NS, and CeO2@PANI_NS are nanospherical in shape with shell diameters of 20-40, 22-44 and 25-50 nm, respectively and core diameter of 150, 170 and 190 nm, respectively. It is obvious that the addition of polyaniline increases the size of CeO2@PANI_NS particles.
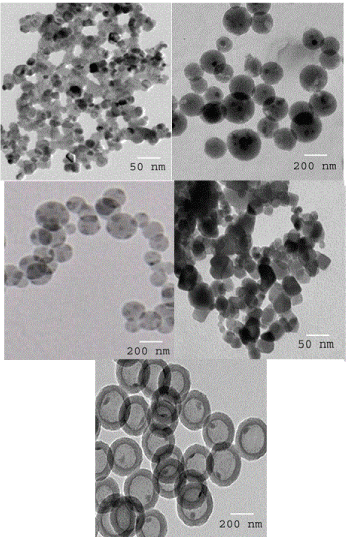
Figure 2. TEM images of PANI_NP (A), PANI_NS (B), CeO2_NS (C), CeO2@PANI_NP (D) and CeO2@PANI_NS (E).
XPS spectra of Ce3d (A), O1s(B), N 1s (C) and C 1s(D) for CeO2@PANI_NS sample is illustrated in Figure 3 The existence of double binding peaks for Ce3d5/2 and Ce3d5/2 at 882 and 916 eV indicate that the cerium ion is Ce(IV) (Figure 3A). The presence of one binding peak for O 1s at 531.6 eV (Figure 3B) indicates that oxygen ion was present as O2-. Therefore, The XPS results for O 1s and Ce3d confirm the presence of CeO2. XPS spectra for N 1s and C 1s assure the existence of aniline in CeO2@PANI_NS sample, due to the presence of the binding peaks for N 1s and C 1s at 400 and 284.7 eV (Figures 3C and D, respectively).
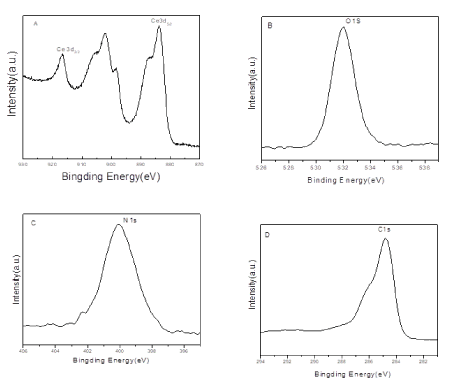
Figure 3. XPS spectra of Ce3d (A), O1s(B), N 1s (C) and C 1s(D) for CeO2@PANI_NS sample.
FT-IR spectral lines for PANI_NS and CeO2@PANI_NS samples are exhibited in Figure 4. The characteristic peaks at 1567, 1492, 1297, 1245, 1147 and 815 cm-1 for polyaniline are present in PANI_NS and CeO2@PANI_NS samples, which confirm the presence of polyaniline in CeO2@PANI_NS samples.
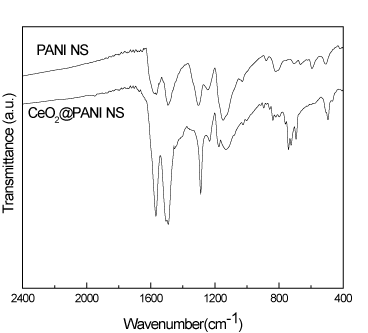
Figure 4. FT-IR spectra for PANI_NS and CeO2@PANI_NS.
Figure 5 exhibits adsorption-desorption isotherms of CeO2_NS, CeO2@PANI_NP, and CeO2@PANI_NS respectively. Type II isotherm is present for PANI_NP sample as shown in Figure 5B. While type IV isotherm was present for CeO2_NS and CeO2@PANI_NS samples as shown in Figure 5. Therefore, CeO2_NS and CeO2@PANI_NS samples are mesoporous materials.
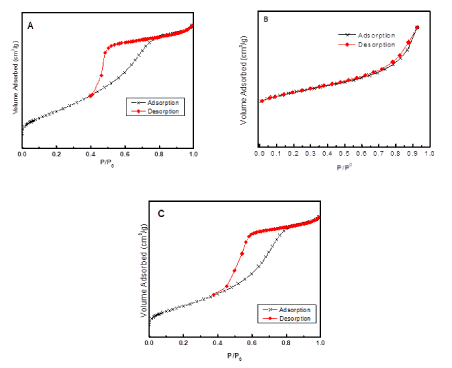
Figure 5. Adsorption-desorption isotherms of CeO2_NS (A), CeO2@PANI_NP (B) and CeO2@PANI_NS (C).
The pore size distribution of CeO2@PANI_NS specimen is illustrated in Figure 6. A narrow distribution of pore size around 3.5 is obvious. This explains that the core-shell structure has a large surface area. The values of the specific surface area of PANI_NS, CeO2@PANI_NS, PANI_NP, CeO2@PANI_NP and CeO2_NS as calculated from desorption measurements are 200, 260, 40, 110 and 130 m2/g, respectively.
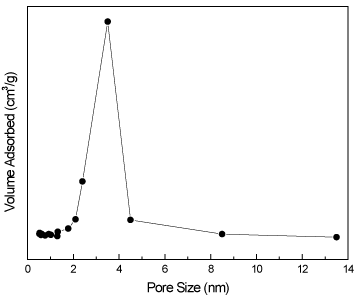
Figure 6. Pore size distribution of CeO2@PANI_NS sample.
Figure 7 shows UV-Vis spectra of CeO2_NS, CeO2@PANI_NP, and CeO2@PANI_NS samples. The curve shows that CeO2_NS absorbs in the UV zone, the existence of polyaniline within the nanoparticles and within the nanospheres results in a displacement of the absorption edge of cerium dioxide in the UV visible zone. Furthermore, the shift is greater in the case of polyaniline nanospheres. The values of band gap energies as calculated from UV-Vis spectra of CeO2_NS, CeO2@PANI_NP, and CeO2@PANI_NS, are 3.21, 2.38 and 1.91 eV, respectively.
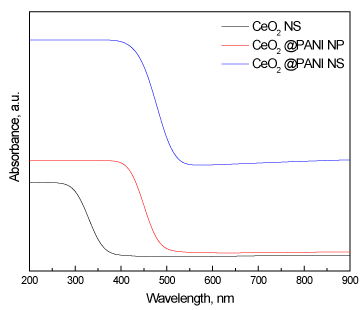
Figure 7. UV-Vis spectra of CeO2_NS, CeO2@PANI_NP, and CeO2@PANI_NS samples.
Figure 8 show Pl spectra of CeO2_ NS, CeO2@PANI_NP and CeO2@PANI_NS samples. CeO2_NS shows high Pl peak intensity, the addition of polyaniline to the nanoparticles and nanospheres decreases the Pl peak intensity. Furthermore, the decrease in the case of polyaniline nanospheres is greater than that of polyaniline nanoparticles. The values of band gap energies of CeO2_NS, CeO2@PANI_NP and CeO2@PANI_NS samples as determined from their Pl emission spectra are 3.20, 2.37and 1.90 eV, respectively. These values are very close to those obtained from UV-Vis spectra as discussed in the previous paragraph.
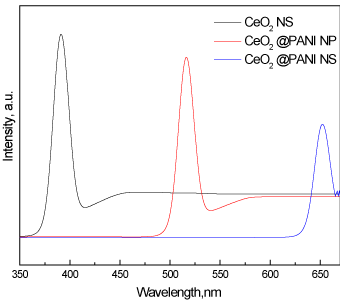
Figure 8. Pl spectra of CeO2_NS, CeO2@PANI_NP, and CeO2@PANI_NS samples.
Photocatalytic Performance
Conversion of nitrobenzene into aniline reaction was utilized to test the synthesized photocatalyst. A comparison between various prepared structures was performed. Figure 9 illustrates the photocatalyst type effect on the conversion of nitrobenzene to aniline. Photocatalytic nitrobenzene-aniline transformation with the use of CeO2_NS is very small (7%), this can be explained by the fact that CeO2_NS absorbs only in the UV region while the light source used is in the visible region. Nitrobenzene-aniline transformation, photocatalytically, with the use of PANI_NP and PANI_NS was at 15% and 40%, respectively. While the photocatalytic conversion with the use of CeO2@PANI_NP and CeO2@PANI_NS as photocatalysts was at 70 % and 100 % respectively. It is clear that the addition of polyaniline nanoparticles and nanospheres increases nitrobenzene-aniline photocatalytic transformation considerably. Polyaniline nanospheres in the form of CeO2@PANI_NS exhibit superior efficiency at about 100% conversion.
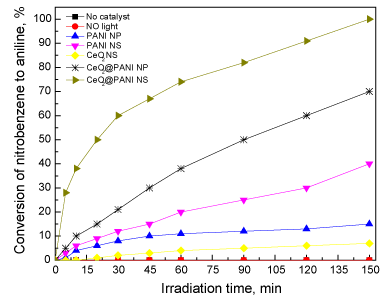
Figure 9. Effect of type of photocatalyst on the conversion of nitrobenzene to aniline.
The effect of the amount of added catalyst to the reaction was also studied. Figure 10 illustrates the consequence of the dose of CeO2@PANI_NS photocatalyst on the nitrobenzene aniline transformation. The photocatalytic transformation has been enhanced from 75 to 100% by increasing the catalyst amount from 0.3 to 0.6 g/L, respectively. The time needed for a complete nitrobenzene-aniline transformation has been reduced from 150 to 90 min by increasing the amount of CeO2@PANI_NS from 0.6 to 1.2 g/L, respectively. This may be attributed to the improved amount of accessible active sites by the increase in the dose of the photocatalyst. If the dose was raised above 1.2 g/L to a value of 1.5 g/L the nitrobenzene – aniline, photocatalytically, decreases from 100 to 98 % and reaction time increases from 90 to 150 min. the higher dose of photocatalyst beyond a certain point may result in hindering penetration of light to reach all active sites of the photocatalyst.
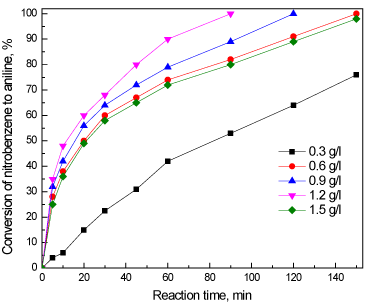
Figure 10. Effect of dose of CeO2@PANI_NS photocatalyst on the conversion of nitrobenzene to aniline.
A test on the possibility of the reuse of the catalyst was also performed. Figure 11 shows recycling and reuse of CeO2@PANI_NS photo-catalyst on nitrobenzene-aniline transformation. The figure shows that the transformation remains constant even if the catalyst was reused for five times showing great stability of the CeO2@PANI_NS photocatalyst.
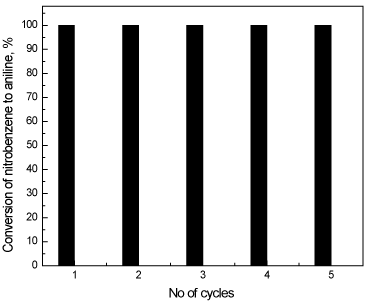
Figure 11. Recycling and reuse of CeO2@PANI_NS photocatalyst on conversion of nitrobenzene to aniline.
Polyaniline nanospheres were fabricated by the microemulsion method. Polyaniline nanoparticles were fabricated through polymerization of aniline (chemical oxidation type). CeO2@PANI_NS was prepared by a method that ensures the production of a uniform spherical core-shell structure. The photocatalytic efficiency of the nanocomposites was investigated by the photocatalytic reduction of nitrobenzene to aniline beneath Vis light. The values of the specific surface area of PANI_NS, CeO2@PANI_NS, PANI_NP, CeO2@PANI_NP, and CeO2_NS are 200, 260, 40, 110 and 130 m2/g, respectively, which means the NS structure has a high specific surface area. The shapes of PANI_NS (nanospheres), CeO2@PANI_NS (core-shell nanospheres), PANI_NP (nanoparticles), CeO2@PANI_NP (nanoparticles), CeO2_NS (nanospheres); were determined by TEM. The photocatalytic performance of CeO2@PANI_NS for reduction of nitrobenzene to aniline under visible light is 1.4, 2.5, 6.6 and 14.3 times more than that of CeO2@PANI_NP, PANI_NS, PANI_NP, and CeO2_NS, respectively.
This Project was funded by the Deanship of Scientific Research (DSR) at King Abdulaziz University, Jeddah, under grant no. P-05-130-436. The authors, therefore, acknowledge with thanks DSR for technical and financial support.
- A cerium oxide polyaniline nanocomposite was prepared.
- The photocatalytic properties were studied upon visible irradiation.
- A new cerium oxide polyaniline nanocomposite showed superior photocatalytic activity.
- A new cerium oxide polyaniline nanocomposite remains effective and active after five cycles
- Deyo RA (2002) Cascade effects of medical technology. Annu Rev Public Health 23: 23-44. [Crossref]
- Young WF Jr (2007) Clinical practice. The incidentally discovered adrenal mass. N Engl J Med 356: 601-610. [Crossref]
- Beigelman-Aubry C, Hill C, Grenier PA (2007). Management of an incidentally discovered pulmonary nodule. Eur Radiol 17: 449-466. [Crossref]
- Mold JW, Stein HF (1986) The cascade effect in the clinical care of patients. N Engl J Med 314: 512-514. [Crossref]
- Badiger S, Akkasaligar PT (2014) Medical imaging techniques in clinical medicine. Int J Med Pharm Sci Eng 8: 812-817.
- Hiremath PS, Akkasaligar PT, Badiger S (2010) Speckle reducing contourlet transform for medical ultrasound images. Int J Comput Inform Eng 4: 284-291.
- Badiger S, Akkasaligar PT (2012) Electrocardiography-pericarditis, pericardial effusion and cardiac tamponade. Int J Intern Med 1: 37-41.
- Badiger S (2012) Echocardiography in pericardial effusion. Int J Curr Res 4: 100-102.
- Hiremath PS, Akkasaligar PT, Badiger S (2011) Performance comparison of wavelet transform and contourlet transform based methods for despeckling medical ultrasound images. Int J Comput Applic 26: 34-41.
- Barboza R, Fox JH, Shaffer LE, Opalek JM, Farooki S (2009) Incidental findings in the cervical spine at CT for trauma evaluation. AJR Am J Roentgenol 192: 725-729. [Crossref]
- Thompson RJ, Wojcik SM, Grant WD, Ko PY (2011) Incidental Findings on CT Scans in the Emergency Department. Emerg Med Int 2011: 624847. [Crossref]
- Green DE, Woodward PJ (2005) The management of indeterminate incidental findings detected at abdominal CT. Semin Ultrasound CT MR 26: 2-13. [Crossref]
- Paluska TR, Sise MJ, Sack DI, Sise CB, Egan MC, et al. (2007) Incidental CT findings in trauma patients: incidence and implications for care of the injured. J Trauma 62: 157-161. [Crossref]
- Ekeh AP, Walusimbi M, Brigham E, Woods RJ, McCarthy MC (2010) The prevalence of incidental findings on abdominal computed tomography scans of trauma patients. J Emerg Med 38: 484-489. [Crossref]
- Devine AS, Jackson CS, Lyons L, Mason JD (2010) Frequency of incidental findings on computed tomography of Trauma patients. West J Emerg Med 11: 24-27. [Crossref]
- Munk MD, Peitzman AB, Hostler DP, Wolfson AB (2010) Frequency and follow- up of incidental findings on Trauma computed tomography scans: Experience at level one Trauma center. J Emerg Med 38: 346-350. [Crossref]
- Bordignon KC, Arruda WO (2002) CT scan findings in mild head trauma: a series of 2,000 patients. Arq Neuropsiquiatr 60: 204-210. [Crossref]
- Eskandary H, Sabba M, Khajehpour F, Eskandari M (2005) Incidental findings in brain computed tomography scans of 3000 head trauma patients. Surg Neurol 63: 550-553. [Crossref]
- Morteza ST, Hemadi H, Sajadi NM, Jalali AH, Eftekharpour D (2010) Evaluation of Incidental Findings in Brain CT Scans of Mild Head Trauma Patients (GCS: Thirteen to Fifteen). Iran J Cancer Prev 3: 32-35.