Abstract
With clustering methods variable and individuals which have similar characteristics may be collected in a group. Although clustering methods have many applications, there are limited studies in health researches in our country. While the purpose of this study is to introduce Kernel K-means and DBSCANclustering algorithms and show how and which cases should be correctly used. At the same time, different clustering algorithms results which can be applied on a real data set were compared. According to the evaluations, the Kappa coefficients were statististically significant and it’s degree are low. In terms of data sets the most convenient and fastest algorithm is Kernel K-Meansn clustering algorithm. The results obtained by Kernel K-Meansgave the most accurate desicions in terms of the distribution of the groups among Framingham risk groups crosstables. As a result, with taking into account the criterion of clinical information it is thought that the examination of clustering of risk factors of the disease, will be played an important role for introduction of accurate disease diagnosis. In addition we believe that when considering data distribution and characteristics of data sets clustering algorithms can be used as a diagnostic tool for the plannings and diagnosis of diseases in the field of health.
Key Words
cluster analysis, data mining, algorithm, framingham risk score
Introduction
Today’s science accepts the information which is based on the evidences. The substance of data come along with some calculations which is used by statistic methods and principles. Information and technology improve and increase with avoidably fast and this is known by everybody.To get beneficial and useful results from the dense information clustering,using the advanced and wide statistic methods become almost necessary. The theory of technology’s developments after the internet cause that suggested statistic method is made practicality faster.Then using these methods help us to understand complex information better and to interpret the real world better [1-3].
When the informations of so many individuals with so many characteristics exists, methods which evaluate the situations better,are collected under the general title of‘Data Mining’.
Like in every area, in health area records are transferred to computers in other words to the data base.So,datas can be kept for a long time and it becomes useful.Also in the course of time a lot of information can be reached easily.When data base are made according to a plan,it helps that a lot of new hypothesis rise and are tested [1-3].
There are a lot of algorithms which take place under the title of data mining and are used for estimating,grouping,classifying and diagnosing which have a lot of application area in recent years.Also main objectives of a lot of hypothesis of health research are one of the algorithms or some this algorithms. Although diagnosing,classifying or estimating methods are used commonly in other areas like health areas the methods which are developed so as to grouping or clustering to variable and individuals are seen that they aren’t used commonly.This results gives us an impression that the researchers have limited information about how to and where to use and how to interpret the information which is taken by the help of the clustering methods [1-3].
Also except for some clustering algorithms which exists in commonly used statistic package programme, new clustering algorithms which is developed especially in recent years, are limited in use in literatüre [1-3].
Material and methods
Clustering
Clustering is the action of collecting similar characteristics. While the objects which is in the same cluster are similar to each other in terms of characteristics which are studied.Objects which take place in different clusters aren’t similar to each other in terms of such characteristics[1-3].
In other words homogeneous groups are obtained by the help of clustering.This forms the principle of clustering analysis.This analysis is unsupervised. Because a data set in which individuals exists in a complex way and nobody are known to in which group they will enter,by the help of clustering analysis homogenous groups are emerged. So, many objects are divided into realistic groups.By the help of these methods not only objects but also characteristics can be clustered.Result of this action is so similar to factor analysis.With one side it clusters many characteristics and it helps size reduction. As in practice to cluster characteristics,methods like factor analysis and structural equation modelling is used, clustering analysis is not needed [1-3].
Unconsciously we often cluster person or people according to definite criteria in area of everyday life.For example in childhood term, to distinguish cat and dog,plant and animals easily some characteristics are considered.
Accordingly, we develop clustering outline preogressively in our subconscious.Clustering analysis are used in various different disciplines with different form and objective.For example it can be used for objectives like to identify the geogrophic distribution of anillness, to cluster of a car accident, to govern of hospitals stuffs, to treat the conditions of a hospital, to time of an ambulance service,to diagnose of an illness,to identify the obese people groups,to examine similar illnesses [1-3].
Clustering analysis is sometimes used as a space analysis. It is seen that lojistic regression is used with combiningmany statistic methods like discrimant analysis,one side variance analysis.In a situation like this firstly by the help of the clustering analysis, homogenous groups are made then with the other methods groups can be analyzed in a best way in terms of which groups may be decomposed or in each homogeneous groups might be made seperate action [1-3].
There are some basic characteristics of an effective and accurate clustering algorithms.A suitable clustering algorithms should explore clustering configurations which have different shapes and sizes with scanning in one go and also it should be practicable for all kinds of data in terms of quality and quantity.An effective clustering method should be suitable for both big and small database without distinguishing the size of the database.This is also shows that whether clustering algorithms has a characteristics of scalability or not.
An effective algorithms should know what to do towards an effective, noise datas and shouldn’t be influenced.Besides of the referred criterias, an effective clustering algorithms should be easily practicable,interpretable,functional and obvious [1-3].
Table 1.The Distribution of Categorical Variables
|
n |
% |
Gender |
Female |
3998 |
83.5 |
Male |
790 |
16.5 |
Smoking Status |
No Smoking |
3287 |
68.7 |
Smoking |
1501 |
31.3 |
Using Blood Pressure Drug Status |
No |
4209 |
87.9 |
Yes |
579 |
12.1 |
Framingham Risk Score |
Low Risk |
4017 |
83.9 |
Intermediate Risk |
568 |
11.9 |
High Risk |
203 |
4.2 |
|
Mean |
Standard Deviation |
Minimum |
Maximum |
Age (year) |
37.343 |
12.1024 |
18 |
80 |
Systolic Blood Pressure (mm-Hg) |
124.849 |
17.5585 |
80 |
250 |
Total Cholesterol (mg/dl) |
192.692 |
39.9267 |
52 |
396 |
HDL (mg/dl) |
51.102 |
12.4480 |
21 |
108 |
Table 2. Descriptive Statistics For Numerical Variables
Cluster Methods |
Clusters |
n |
% |
Kernel K-ortalama |
Cluster 1 (Low risk) |
1569 |
32,8 |
Cluster 2 (Intermediate risk) |
2279 |
47,6 |
Cluster 3 (High risk) |
940 |
19,6 |
DBSCAN |
Cluster 1 (Low risk) |
2907 |
65,9 |
Cluster 2 (Intermediate risk) |
1091 |
24,8 |
Cluster 3 (High risk) |
410 |
9,3 |
Table 3. Distribution of Individuals Per Cluster
Kernel K-Means Clustering Algorithm
Kernel K-means clustering algorithm is an extension of the classical K-Means non-linear method. Firstly it developed by Girolami in 2002 iteratively. In this model entry point in multidimensional space is mapping to 𝛟(.)by using nonlinear transformation and thus cluster error is minimized. The distance between the cluster center and a data point is calculated using a kernel function in space. The𝛟(X). 𝛟(Y)point is produced between X and Y’s image. This point can be calculates using K(X.Y)formula(55,91).
The K(X.Y)function is a kernel function that providesK:DXD R.In below there is a list of some of the standard kernel functions [4-6].
pdegrees of polynomial kernel: , p: positive integer and
Gaussian (RBF) kernel: is a Gaussian kernel parameter.
Sigmoidal kernel: , a ve
Lineer kernel:
In iterative process, for and points it is required to calculate .Thus the matris which is called kernel matris, is obtained.
n is the size of the data set. Kernel matrix is calculated and recorded previously. The time and space complexity isO(n2). This is the disadvantages of Kernel K-Means clustering method. This complexity shows that for very large databases this clustering algorithms does not give proper results. And another disadvantages of this method is the need of determine the number of clusters initially and the core points, kernel functions are affects clustering results a lot.
In order to looking operation stages of method, it is assumed that a data like .Kis the number of clusters that required andM(0)is starting core point, П(0)shows starting partitionresults. are the points in the entry space [4-6].
Kernel K-Means clustering method takes D, K ve П(0) parametres as input parameter and it givesПD parametes as the output parameter [4-6].
In order to minimize criter function, following function is used[4-6].
In the above formula is shows the average of cluster and it is calculated using the following formula
In a moved space the distances between and data points is
=
is calculated using the following formula by knowledge of 𝛟(.)[4-6].
=
In the above formula and equations are calculated as follows.
This iterative method operations is summarized in the following algorithms [4-6].
- For every cluster find ve .
- For every and cluster calculate .
- Calculate equality andassigned point to the nearest center.
- Forj=1 toKupdate using formula.
- Repeat Step 1 and Step 4 until the results of clusters are close to each other.
And the results are given as
DBSCAN Clustering Algorithm
DBSCAN clustering algorithm is density based algorithm. It first developed by Martin Ester and colleagues (33). DBSCAN algorithm is used to find the clusters with arbitrary shape and noisy data. With other clustering methods, it is very difficult and laborious to examine arbitrary shapes.Also the cost of calculation is the highest[4,7-9].
In following figures it is seen that DBSCAN gives very accurate decisions about clustering[4,7-9] (Figures 1 and 2).
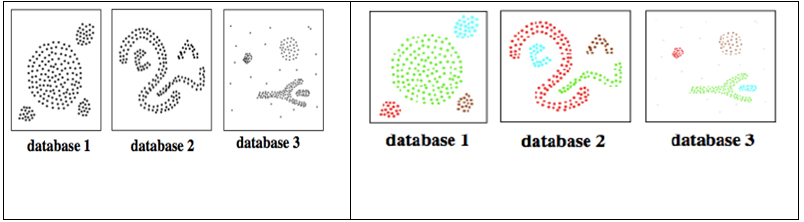
Figure 1. Clustering Results of Three Different Databases with DBSCAN
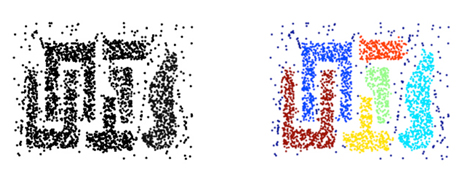
Figure 2. The Clustering Results Obtained Using The Method DBSCAN
DBSCAN clustering algorithm is only used one input parameter and with this parameter is identifies the clusters that have large spatial data sets by looking local density in the database[4,7-9]. In addition this method is decide what information is outlier or noise data.
For example suppose there are databases like in Figure 3, is the points really create a cluster or of the set or is it small size cluster that consists a lot of outliers. At this point DBSCAN clustering algorithm is given decisions correctly in those consequences[4,7-9].
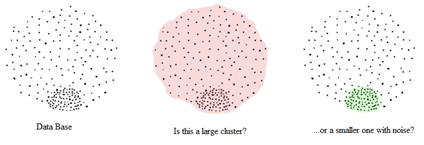
Figure 3. Database and Cluster Decision
Before proceeding working method of DBSCAN clustering method, several concepts is required to define in the following[4,7-9].
ε(Eps) Neighborhood
It is a neighborhood of a object within ε radius.
Epsis a proximity distance to determined the neighboring of a object. In other words, it is the maximum distance between any two points in a cluster.
NEps(q) is expressed as q D|dist(p,q) Eps(52,54,55)
MinPts
If a point is intensive, then it should be have minimum number of points in the neighborhood ε .
Core point
If a object includes at least MinPts observation in the neighborhood ε, then this a core point.
Density reachable
When there is a chain likep1,p2,…pn,the equalitys arep1=q and pn=p.Under the conditions about Epsand MinPts, the density reachable is provided viapi+1, pipoints[4,7-9].
This is summarized as follows. Suppose there is p and qpoints. In this cases, the ppoint is directly density reachable to qpoint. But q point is not directly reachable top point. Because qpoint ise a core point (we assumed that MinPtsise three) [4,7-9].
Directly density reachable
Where the following conditions are provided the p point is directly density reachable from q point [4,7-9].
Density connected
Under the conditionsEps andMinPts,a p point is density connected with the help of o point and this o point is density reachable both p and qpoints. This situation is illustrated as follows[4,7-9] (Figures 4 and 5).
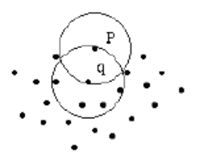
Figure 4. The reachability p Point from q Point
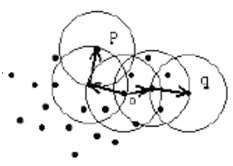
Figure 5. Density Connected
Noise
A set of points that not belong to any cluster in the database.
To summarize above descriped concepts, the following example is given. Assuming MinPtsis three, in Figure 6 the points m,p,o,rare core point. Because they have three and more than three points in the ε neighborhood.qpoint is directly reachable tom' andmis directly reachable toq' point. The opposite is also true of these provisions. The point a does not belong to any cluster. So this a point is a noise point[4,7-9].
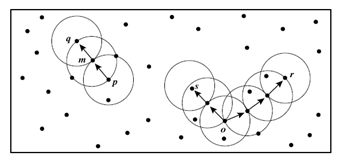
Figure 6. Sample Data Set Used In The DBSCAN Algorithm Implementation
In DBSCAN clustering algorithm there is two condition that in order to include qpoint in K cluster. The first condition is, if p point is belonging to K cluster, it density reachable by ppoint. The second condition is ppoint is density connected with q point. In these two cases p and q points are elements of Kcluster[4,7-9].
DBSCAN algorithm randomly selects a ppoint and under specified conditions about MinPtsand Epsit determines all density points may be accessed. If the point of p is a border point or if there is no reachable point, the process is countinued with another randomly selected point. This process continues until all points in the cluster are fixed[4,7-9].
DBSCAN clustering algorithm is quite effective for arbitrary according to apporiate parameters and MinPts which are set by user. If a spatial index is used, algorithms computational complexity is O(nlogn).In this formulation n is the observation number in data set. In other cases the computational complexity is O(n2)[4,7-9].
Data
In our country cardiovascular diseases are the most common ailments in recent years.Cardiovascular term is used as a generic name for the heart and vascular disorders.It leads significant deterioration of the person’s quality of life and causes of death. Therefore, to prevent the increase of cardiovascular problems and to reduce deaths, it is necessary to determinate of risk factors and reduce the risk of death from cardiovascular disease by making the necessary interventions. In this study, for determining cardiovascular risk groups Framingham risk score was used. This score was frequently used in recent years. Framingham risk score was calculated on people living in the town of Framingham which is a state of Massachusetts in the United States. The American Heart Association has created the Framingham risk scale using this data.The purpose of creating this table is decreasing death rates by taking the necessary measures to identify individuals at risk of cardiovascular events.
The data used in our study was covered in a 3 year period between 2012-2014 and datas were collected over people who wanted to lose weight and had periodic inspection in Duzce University Family Medicine Polyclinic. 4788 individual measurements were collected. Also Framingham risk scores were calculated by using a written macro and the individuals were categorized as low, intermediate and high risk group. For Framingham score, individuals which have less than 10% risk is found low risk, with the risk between 10% and 20%intermediate risk, higher than 20% ise found high risk groups. Evaluation of the first stage, descriptive statistics were given as mean and standard deviation for numerical variables, for categorical variables statistics were given as frequence and percentage. The variables age, gender, smoking, systolic blood pressure, total cholesterol, HDL and using blood pressure medication were used for calculating the risk groups with Framingham risk score.Kernel K-means and DBSCAN clustering algorithms were used as clustering algorithms. For determining which variables are significant distinctions between the generated clusters one way ANOVA was used for numerical variables and Tukey was used for post-hoc test. Similarly,the relationships between categorical variables and clusters were investigated with Pearson Chi-Square test. Finally, adaptions of clustering algorithms were evaluated with Kappa statistics. The statistical significance level was 0,05 and WEKA (ver. 3.4.11), RapidMiner (ver. 6.4), SPSS (ver.20) was utilized forthe analysis.
Results
Considering Table 1 results, 83.5% of people who participated in the study sample (n=3998) were female, 31.3% (n=1501) were consumed cigarettes, 12.1% (n=579 persons) used blood pressure medication. As a result of Framingham risk score 4,2% (n=203) were identified at high risk group.
All numerical variables descriptive values were given as mean, standard deviation, minimum and maximum in Table 2.
Considering age, gender, smoking status, systolics blood pressure, total cholesterol, HDL and using blood pressure medication status in the data set, in the implementation of Kernel K-Means and DBSCAN have been identified in 5 steps. For Kernel K-means, the ratio of higher risk group was 19,6% in Table 3.The proportion of individuals classified as high-risk method of DBSCAN found quite a lot. As a result of DBSCAN clustering algorithm the proportion of low risk individuals were very large. When evaluating clusters, DBSCAN clustering method did not used 380 people that extreme point.
Table 4shows the results of comprasion of the average age, systolic blood pressure, total cholesterol and HDL between Kernel K-Means and DBSCAN clustering groups and p value is shown. Among the clusters, which are obtained with the application two mtehods, there were significant differences in terms of the numerical values.For Kernel K-Means and DBSCAN methods, high risk’s group age, total cholesterol was significantly higher than other clustering groups. But in DBSCAN method intermediate groups Systolic Blood Pressure was significantly smaller than low and high risk groups. When results were examined by HDL, Kernel K-Means and DBSCAN results were very different. In Kernel K-Means algorithm group with high risk’s HDL average was significantly higher than other clustering groups. But in DBSCAN clustering method group with low risk had significantly higher average HDL. It showed us that two methods results were not same.
Variables |
Clusters |
Kernel K-Means |
p |
DBSCAN |
p |
n |
Mean |
Standard Deviation |
n |
Mean |
Standard Deviation |
Age |
Cluster 1 (Low risk) |
1569 |
31.1428a |
10.02949 |
<0,001 |
2907 |
37.0602a |
12.55664 |
<0,001 |
Cluster 2 (Intermediate risk) |
2279 |
38.2769b |
11.51889 |
1091 |
37.5820a |
10.73071 |
Cluster 3 (High risk) |
940 |
45.4319c |
11.17966 |
410 |
39.9512b |
12.33983 |
Systolic Blood Pressure |
Cluster 1 (Low risk) |
1569 |
118.5641a |
14.59613 |
<0,001 |
2907 |
124.8070a |
18.22597 |
<0,001 |
Cluster 2 (Intermediate risk) |
2279 |
126.7990b |
17.84390 |
1091 |
123.3492b |
16.48207 |
Cluster 3 (High risk) |
940 |
130.6128c |
18.30376 |
410 |
128.4268c |
17.83573 |
Total Cholesterol |
Cluster 1 (Low risk) |
1569 |
151.6811a |
18.47103 |
<0,001 |
2907 |
190.4830a |
39.43385 |
<0,001 |
Cluster 2 (Intermediate risk) |
2279 |
196.3353b |
13.85578 |
1091 |
195.5186b |
41.24597 |
Cluster 3 (High risk) |
940 |
252.3128c |
26.27701 |
410 |
199.1854b |
40.17462 |
HDL |
Cluster 1 (Low risk) |
1569 |
49.4989a |
11.72261 |
<0,001 |
2907 |
52.9461a |
12.09382 |
<0,001 |
Cluster 2 (Intermediate risk) |
2279 |
51.3510b |
12.44777 |
1091 |
51.3844b |
12.90315 |
Cluster 3 (High risk) |
940 |
53.1755c |
13.26032 |
410 |
43.5927c |
10.70874 |
Table 4. Comprasion of Numerical Variables
Categorical variables, which were used to calculating Framingham risk score, and cluster results that obtained Kernel K-Means and DBSCAN relationships comprasion results were given in Table5. Considering Table 5about Kernel K-Means method there were significant differences in terms of gender, smoking status, Using Blood Pressure Drug Status. But in DBSCAN clustering method Using Blood Pressure Drug Status is not a risk factor for cardiovascular disease.
|
Kernel K-means |
p |
Low Risk |
Intermediate Risk |
High Risk |
Gender |
Female |
Count |
1348 |
1896 |
754 |
0,001 |
Row% |
33.7 |
47.4 |
18.9 |
Column% |
85.9 |
83.2 |
80.2 |
Male |
Count |
221 |
383 |
186 |
Row% |
28.0 |
48.5 |
23.5 |
Column% |
14.1 |
16.8 |
19.8 |
Smoking Status |
Non Smoking |
Count |
1143 |
1531 |
613 |
<0,001 |
Row% |
34.8 |
46.6 |
18.6 |
Column% |
72.8 |
67.2 |
65.2 |
Smoking |
Count |
426 |
748 |
327 |
Row% |
28.4 |
49.8 |
21.8 |
Column% |
27.2 |
32.8 |
34.8 |
Using Blood Pressure Drug Status |
No |
Count |
1488 |
1995 |
726 |
<0,001 |
Row% |
35.4 |
47.4 |
17.2 |
Column% |
94.8 |
87.5 |
77.2 |
Yes |
Count |
81 |
284 |
214 |
Row% |
14.0 |
49.1 |
37.0 |
Column% |
5.2 |
12.5 |
22.8 |
DBSCAN |
Gender |
Female |
Count |
2907 |
1091 |
0 |
<0,001 |
Row% |
72.7 |
27.3 |
.0 |
Column% |
100.0 |
100.0 |
.0 |
Male |
Count |
0 |
0 |
410 |
Row% |
.0 |
.0 |
100.0 |
Column% |
.0 |
.0 |
100.0 |
Smoking Status |
Non Smoking |
Count |
2907 |
0 |
0 |
<0,001 |
Row% |
100.0 |
.0 |
.0 |
Column% |
100.0 |
.0 |
.0 |
Smoking |
Count |
0 |
1091 |
410 |
Row% |
.0 |
72.7 |
27.3 |
Column% |
.0 |
100.0 |
100.0 |
Using Blood Pressure Drug Status |
No |
Count |
2533 |
962 |
357 |
0,663 |
Row% |
65.8 |
25.0 |
9.3 |
Column% |
87.1 |
88.2 |
87.1 |
Yes |
Count |
374 |
129 |
53 |
Row% |
67.3 |
23.2 |
9.5 |
Column% |
12.9 |
11.8 |
12.9 |
Table 5. Comprasion of Categorical Variables
The adaptation of clustering DBSCAN and Kernel K-Means clustering methods calculating Framingham risk score.
Adaptions of each of the clustering results were investigated with Kappa statistics by the risk factors about Framingham risk score andthe results were shown collectively in Table 6. According to Table 6, there was significant harmony among Kernel K-Means and DBSCAN clustering algorithms. But the value of Kappa statistics were quite small.
Kappa=0,039 |
Kernel K-Means |
p |
Low Risk |
Intermediate Risk |
High Risk |
DBSCAN |
Low Risk |
Count |
1023 |
1355 |
529 |
<0,001 |
Row% |
35.2 |
46.6 |
18.2 |
Column% |
70.6 |
64.4 |
61.8 |
Intermediate Risk |
Count |
325 |
541 |
225 |
Row% |
29.8 |
49.6 |
20.6 |
Column% |
22.4 |
25.7 |
26.3 |
High Risk |
Count |
101 |
207 |
102 |
Row% |
24.6 |
50.5 |
24.9 |
Column% |
7.0 |
9.8 |
11.9 |
Table 6.The Relationships Between DBSCAN and Kernel K-Means Results
Framingham risk score groups and clusters that obtained from the two clustering algorithm relationships were given in Table 7. When considering Table 7, it was seen that DBCSAN clustering algorithm’s results were not significantly agreement with Framingham risk score. But Kernel K-Means clustering algoritm results were significantly agreement with Framingham score.
Discussion and conclusion
Clustering algorithms are used in a variety of workspace. For example making text clustering on social networks like Facebook and Twitter, grouping the students according to social skills at school, the classification of a variety of diseases or symptoms of disease, developing disease groups by combined laboratory and clinical findings, identificating of epidemics, regional analysis, identificating the different morphology of the heart sound and classification of physiological status. At the same time, clustering algorithms were preferred to used for the detection of homogeneous groups before many statistics test as a pre-analysis [10-14].
|
DBSCAN |
Kernel K-Means |
Framingham Risk Score |
KAPPA |
-0,001 |
0,06 |
p |
0,964 |
<0,001 |
Table 7. Framingham Risk Score's Kappa Statistic About DBSCAN and Kernel K-Means
Based on types of variables and presence or absence of outlier/noise observations in the data set, a variety of clustering algorithms have been developed.In particular, the number of clustering algorithms has been increased in the last 10 years.This result is an indication of increased need for clustering[10-22].
Framingham risk score, which we used in our study, has been used many international and national studies for predicting cardiovascular risk score. This score was used above 1200 articles for determining the turning point of cardiovascular disease. However, when calculating the risk score, limited number of risk factors is located in the model. This factors includes age, gender, total cholesterol, systolic blood pressure, smoking status and drug using status. Framingham risk score is a mathematical model that predicts the risk of cardiovascular disease over 10 years.However there are disadvantages of this method. It only predicts the cardiovascular disase risk not the other heart illness. And this model is only applied for individuals that have no heart disease before. Another disadvantage of this score is, in cohort study the young people are less represented. Therefore, it intensively emphasis on age. Framingham risk score informations have been developed from people who are living in Framigham area. However this region contains more white race and homogeneous groups. Because of this Framingham risk score may not be accurate for different ethnic and cultural structures. Framingham risk score is only able to develop a 10 year period predictive model. The model included 10 year period risk factors effects may be stronger depending on the time. But this score is neglect this effect. For this reasons Framingham risk score should not be used as a gold standard test for the estimating risk score of cardiovascular disease in our country. However, it will be benefited for a preliminary assessment for studies[23].
In this direction, we investigated the risk factors of cardiovascular disease that caused the most of deaths among all disease. By using the risk factors we clustered people into three groups including low risk, intermediate risk and high risk. Then we compared the clusters that obtained from Framingham risk score and DBSCAN, Kernel K-means results.
Kernel K-Means clustering algorithm has been observed more consistent results compare with DBSCAN method due to the small amount of categorical variables and large size of own data set. However, Kernel K-means method gives correct results when applied clustering process with accurate parameters, despite the lack of a convenient method of clustering large data sets. At the same time, Kernel K-Means method produce faster results used for data set. DBSCAN clustering algorithm is more successful to find low-risk individuals findings while Kernel K-Means clustering method has a tendency who are at high risk.
In this research, high risk of cardiovascular disease has more valuable to find clinically so upscale ratio is desired in cross table. Although, for some studies, they can be approved success such as finding a low-risk individuals. In this case, the results should be analyzed this assessment extent. In these data sets, researchers make mistake while thinking of this algorithm gives definitive results. For these reasons, clustering algorithms should be reviewed whole clinical informations evaluated with criteria, assumptions, algorithm conditions, disadvantages and advantages. Statistical methods should be supported that the clinical findings therefore the application stage continues easily and correctly in backstage [10-14].
As a result we propose to increase the clustering algorithms applications in the health field.If the correct method is used in the development of health policies, it is necessary to taking the necessary precautions for determined the risk of disease. Thus it will lead to improved quality of life for our people and the average life expectancy will increase. Therefore, even a simple clustering algorithm perhaps will cause a lot of different developments in the field of health and medicine [10-14].
References
- Köktürk F, Ankarali H, Sümbüloglu V (2009) Veri madenciligi yöntemlerine genel bakis. Türkiye Klinikleri Journal of Biostatistics 1: 20-5.
- Fraley C, Raftery AE (2005) How many clusters? Which clustering method? Answers via model-based cluster analysis. The Computer Journal 41: 578-588.
- Ferligoj A, Batagelj V (1983) Some types of clustering with relational constraint. Psychometrika 48: 541-552.
- AL-Zand Har (2013) Bölümleyici Kümeleme Algoritmalarinin Farkli Veri Yogunluklarinda Karsilastirilmasi.2013, Gazi üniversitesi, Bilisim Enstitüsü, Master thesis,107 Page, Ankara.
- Sarma TH, Viswanath P, Reddy BE (2013) Single pass kernel K-means clustering method. S dhan 38:407-419.
- Zhang R, Rudnicky A (2012) A large scale clustering scheme for kernel k-means. ICPR 289–292.
- Bäcklund H, Hedblom A, Neijman N (2015) DBSCAN: A density-based spatial clustering of application with noise. Linköpings Universitet.
- Ester M, Kriegel HP, Sander J, Xu X (1996) A density-based algorithm for discovering clusters in large spatial databases with noise. Proceedings 2nd International Conference on Knowledge Discovery and Data Mining. Oregeon 226-231
- Han J, Kamber M (2006) Data Mining: Concepts and Techniques. Morgan Kaufmann Publishers Inc. USA; 418-419.
- Fraley C, Raftery AE (2005) How many clusters? Which clustering method? Answers via model-based cluster analysis. The Computer Journal 41: 578-588.
- Syed AA (2004) Performance Analysis of K-means Algorithm and Kohonen Networks, Florida Atlantic University, Master of Science, Master thesis,127 Page, America, (Prof. Dr. Abhijit Pandya).
- Han J, Kamber M (2006) Data Mining: Concepts and Techniques. Morgan Kaufmann Publishers Inc. USA;5-10.
- Koh HC, Tan G (2005) Data mining applications in healthcare. J Healthc Inf Manag 19: 64-72.[Crossref]
- Ferligoj A, Batagelj V (1983) Some types of clustering with relational constraint. Psychometrika 48: 541-552.
- Godara S, Yadav R (2013) Performance analysis of clustering algorithms for character recognition using Weka tool. International Journal of Advanced Computer and Mathematical Sciences 4:119-123.
- Singh B, Dubey G (2013) A comparative analysis of different data mining using WEKA. International Journal of Innovative Research & Studies 2: 380-391.
- Revathi S, Nalini T (2013) Performance comparison of various clustering algoritm. International Journal of Advanced Research in Computer Science and Software Engineering 3: 66-72.
- Balabantaray RC, Sarma C, Jha M (2015) Document clustering using K-means and K-medoids. International Journal of Knowledge Based Computer Systems 1.
- Kakkar P, Parashar A (2014) Comparison of different clustering algrithms using WEKA tool. International Journal of Advanced Research in Technology, Engineering and Science 1: 20-2.
- Jung YG, Kang MS1, Heo J2 (2014) Clustering performance comparison using K-means and expectation maximization algorithms. Biotechnol Biotechnol Equip 28: S44-44S48. [Crossref]
- Goyal VK (2014) An experimental analysis of clustering algorithms in data mining using Weka tool. International Journal of Innovative Research in Science & Engineering 2: 171-6.
- Ramya D, Rao D (2014) Performans evaluation of learning by example techniques over different datasets. International Journal of Innovative Research in Science, Engineering and Technology 3: 15960-5.
- Hemann BA, Bimson WF, Taylor AJ (2007) The Framingham Risk Score: an appraisal of its benefits and limitations. Am Heart Hosp J 5: 91-96.[Crossref]