SiO2/SnO2 nanofibers were synthesized using templates of TEMPO-oxidized cellulose nanofibers (TOCN). SiO2 and SnO2 were sequentially deposited onto the TOCN via sol-gel reactions. Acetylacetone (acac) and NH3 were used to stabilize the precursor of SnO2 through the formation of tin acetylacetonate. After the combustion of TOCN templates, SiO2/SnO2 nanofibers which were composed of amorphous SiO2 and rutile phase SnO2 nanocrystals were obtained. Especially with the acac/Sn molar ratio of 500 under the use of NH3, the SiO2/SnO2 nanofibers with the fine structure derived from TOCN templates were formed. They showed a very small diameter of around 8 nm and a high specific surface area of 322 m2/g. The SnO2 crystallite size was kept to be 3.2 nm by suppressing the coarsening. We have also evaluated the gas-sensitivity to 1000 ppm ethanol of the synthesized SiO2/SnO2 nanofibers. By adding acac under the use of NH3 leading to the suppression of the growth of the SnO2 crystallite size, this sensitivity was enhanced 10 times larger.
nanofibers, sol-gel, SiO2, SnO2, cellulose nanofibers, gas sensor
Nanofibers have remarkable properties of high mechanical strength, high specific surface area, hydrodynamic characteristics, and electrical conductivities [1-4]. Especially, semiconducting metal oxide nanofibers, such as SnO2 nanofibers, are expected to be one of key materials for gas sensing devices due to their unique electrical features [5]. Although nanofibers are conventionally produced by several ways, such as electrospinning, it is difficult to synthesize nanofibers with a diameter of ten nanometers or less [6-8]. According to the various reports on the fabricating inorganic nanofibers using the templates of cellulose nanofibers [9-12], the advantages of these procedures are basically to obtain inorganic nanofibers maintaining the fine structure corresponding to the original cellulose. More recently, we developed the method to synthesize very thin SiO2/TiO2 core-shell nanofibers with a diameter below ten nanometers [13] using the special cellulose nanofibers which are called (2,2,6,6-tetramethyl-piperidin-1-yl)oxyl (TEMPO) oxidized cellulose nanofibers (TOCN) [14]. In this synthesis method, initially deposited SiO2 helps TiO2 to attach onto the cellulose nanofiber via a covalent bonding. Here, we report the synthesis of SiO2/SnO2 composite nanofibers by using TOCN. In the synthesis procedure, SiO2 and SnO2 were sequentially deposited onto the surface of TOCN. And then, the templates TOCN were combusted to obtain SiO2/SnO2 nanofibers. Firstly, the deposition of SiO2 was performed via the series treatment of 3-aminopropyltrimethoxysilane (APTMS) and tetramethoxysilane (TMOS). Subsequently, SnO2 was deposited using tin (IV) tetraisopropoxide with acac as stabilizing agent [15,16]. It is well-known that the smaller crystallite size of SnO2 enhances its gas sensitivity [17]. In order to obtain the SiO2/SnO2 nanofibers with the enhanced sensitivity, the optimization of the acac/Sn molar ratio for the suppression of SnO2 crystallites size was investigated.
Preparation of TEMPO-oxidized cellulose nanofibers (TOCN)
TOCN were prepared by the conventional method [18]. 4.00 g of fibrous cellulose (KY-100G, Daicel Fine Chem) was suspended in 400 mL of distilled water. 400 mg of NaBr (Kishida Chemicals), 64.0 mg of (2,2,6,6-tetramethylpiperidin-1-yl)oxyl (TEMPO, Sigma-Aldrich), and 12.4 mL of NaClO solution (Wako Pure Chemicals), were added and stirred for 2.5 hours at room temperature maintaing pH value of 10. The obtained TOCN were repeatedly washed with distilled water and stored as an aqueous dispersion for further experiments.
SiO2 deposition on TOCN
The series treatments of two types of silicon alkoxide were used [13]. Firstly, 0.98 mL of 3-aminopropyltrimethoxysilane (APTMS, Sigma-Aldrich) was added to 100 mL of 1.0wt% aqueous suspension of TOCN and stirred for 45 min at room temperature. After the stirring, the TOCN treated with APTMS were repeatedly washed with distilled water using centrifugation and were prepared to be 1.0wt% aqueous suspension. Subsequently, 0.10 mL of tetramethoxysilane (TMOS, Sigma-Aldrich) was added to the suspension and stirred for 45 min at room temperature. The TOCN sequentially treated with APTMS and TMOS (in the following, TOCN/SiO2) were repeatedly washed with distilled water. After that, the solvent was substituted with ethanol (Kishida Chemicals).
Synthesis of SiO2/ SnO2 nanofibers
To deposit SnO2 onto the TOCN/SiO2 surface, the hydrolysis and condensation reactions of tin alkoxide were employed. Certain amount of acetylacetone (acac, Kishida Chemicals), 3.06 mL of 28% NH3 aqueous solution (Kishida Chemicals) were added to ethanol dispersion containing 0.128 g of TOCN/SiO2. After the further dilution with ethanol and addition of 0.928 mL of 10w/v% tin (IV) isopropoxide in isopropanol (Alfa Aesar), the mixture was stirred for 12 h at room temperature under an argon atmosphere. In the exceptional cases, distilled water was used instead of NH3 aqueous solution with maintaining the total amount of water. The amount of ethanol for the dilution was modified to make the total weight of the mixture 128 g. Acac/Sn molar ratios were changed from 0 to 1000. After washing repeatedly by isopropanol (Kishida Chemicals) using centrifugation at 4000 rpm, TOCN/SiO2 covered with SnO2 were dried with a super critical dryer (SCRD 4, Rexxam) using CO2. SiO2/SnO2 nanofibers were obtained after the calcination of the dried sample at 500°C for 4 h in air via the combustion of the templates TOCN.
Characterization
Measurements of X-Ray diffraction (XRD) patterns were carried out by an X-Ray diffractometer (RINT-2500HFK, Rigaku). The crystallite size of SnO2 was calculated by Scherrer’s equation with rutile SnO2 (101) peak. Observations of microscopic structures were conducted by a field-emission scanning electron microscope (FE-SEM; JSM-6700F, JEOL) and a transmission electron microscope (TEM; JEM-2200FS, JEOL). FT-IR spectra were measured by an FT-IR spectrometer equipped with an ATR accessory (Spectrum Two, Perkin Elmer). Specific surface areas were determined by using an N2 adsorption-desorption apparatus (Tristar 3000, Shimadzu) after degassing at 150°C.
Evaluation of gas sensitivity
The gas sensitivity of the synthesized SiO2/SnO2 nanofibers was evaluated by monitoring changes of an electrical resistance of the nanofibers during repeated exposure to the analyte gas containing ethanol. SiO2/SnO2 nanofibers were formed to be a sheet with a size and a thickness of about 8 mm ×13 mm and 1 mm, respectively. The gold electrode was deposited on the sheet by sputtering. The nanofibers sheet was placed on a ceramic heater inside a silica glass tube and the measurements were conducted at 400°C. The analyte gas containing 1000 ppm ethanol with the flow rate of 300 sccm was prepared by using the mass flow controllers (SEC-E40, Horiba Stec).
Figure 1 shows the synthesis procedure of the SiO2/SnO2 nanofibers schematically.
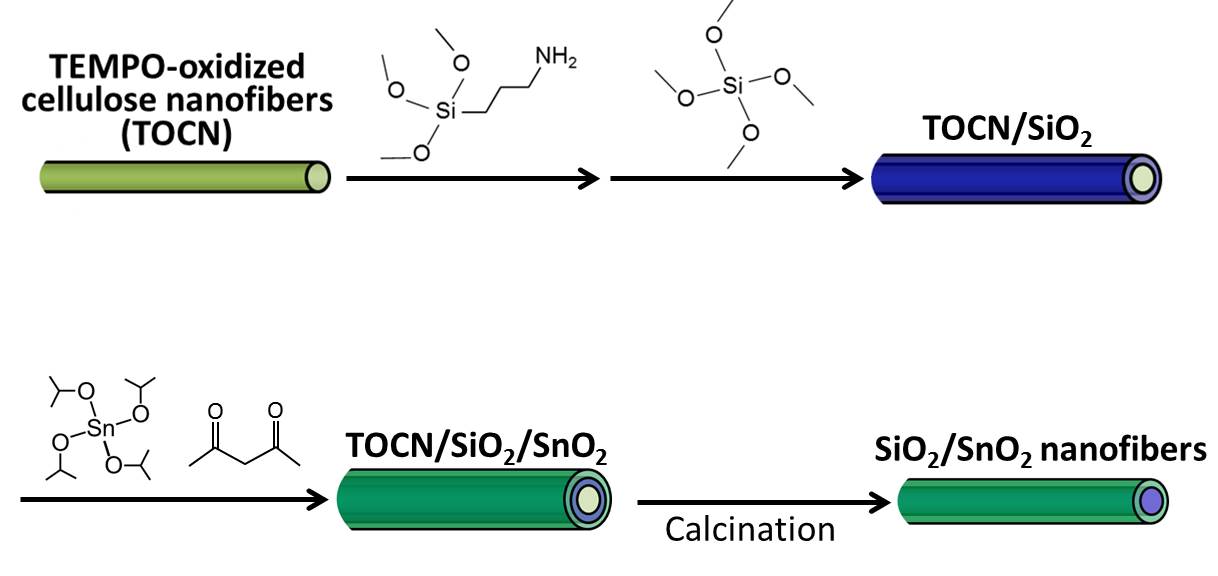
Figure 1. Schematic procedure for synthesis of SiO2/SnO2 nanofibers.
Figure 2 shows XRD patterns of SiO2 and SiO2/SnO2 nanofibers synthesized with various acac/Sn molar ratios. All SiO2/SnO2 nanofibers had rutile phase SnO2 (JCPDS card no. 41-1445), in contrast to no crystalline peaks in SiO2. Inset denotes the relationship between acac/Sn ratios and crystallite sizes. It should be noted that SiO2/SnO2 nanofibers obtained by the acac/Sn ratio of 500 showed the smallest crystallite size of 3.2 nm. In the exceptional cases without NH3, the crystallite sizes remained still high. Therefore, in the following, we focused on the results with the use of NH3.
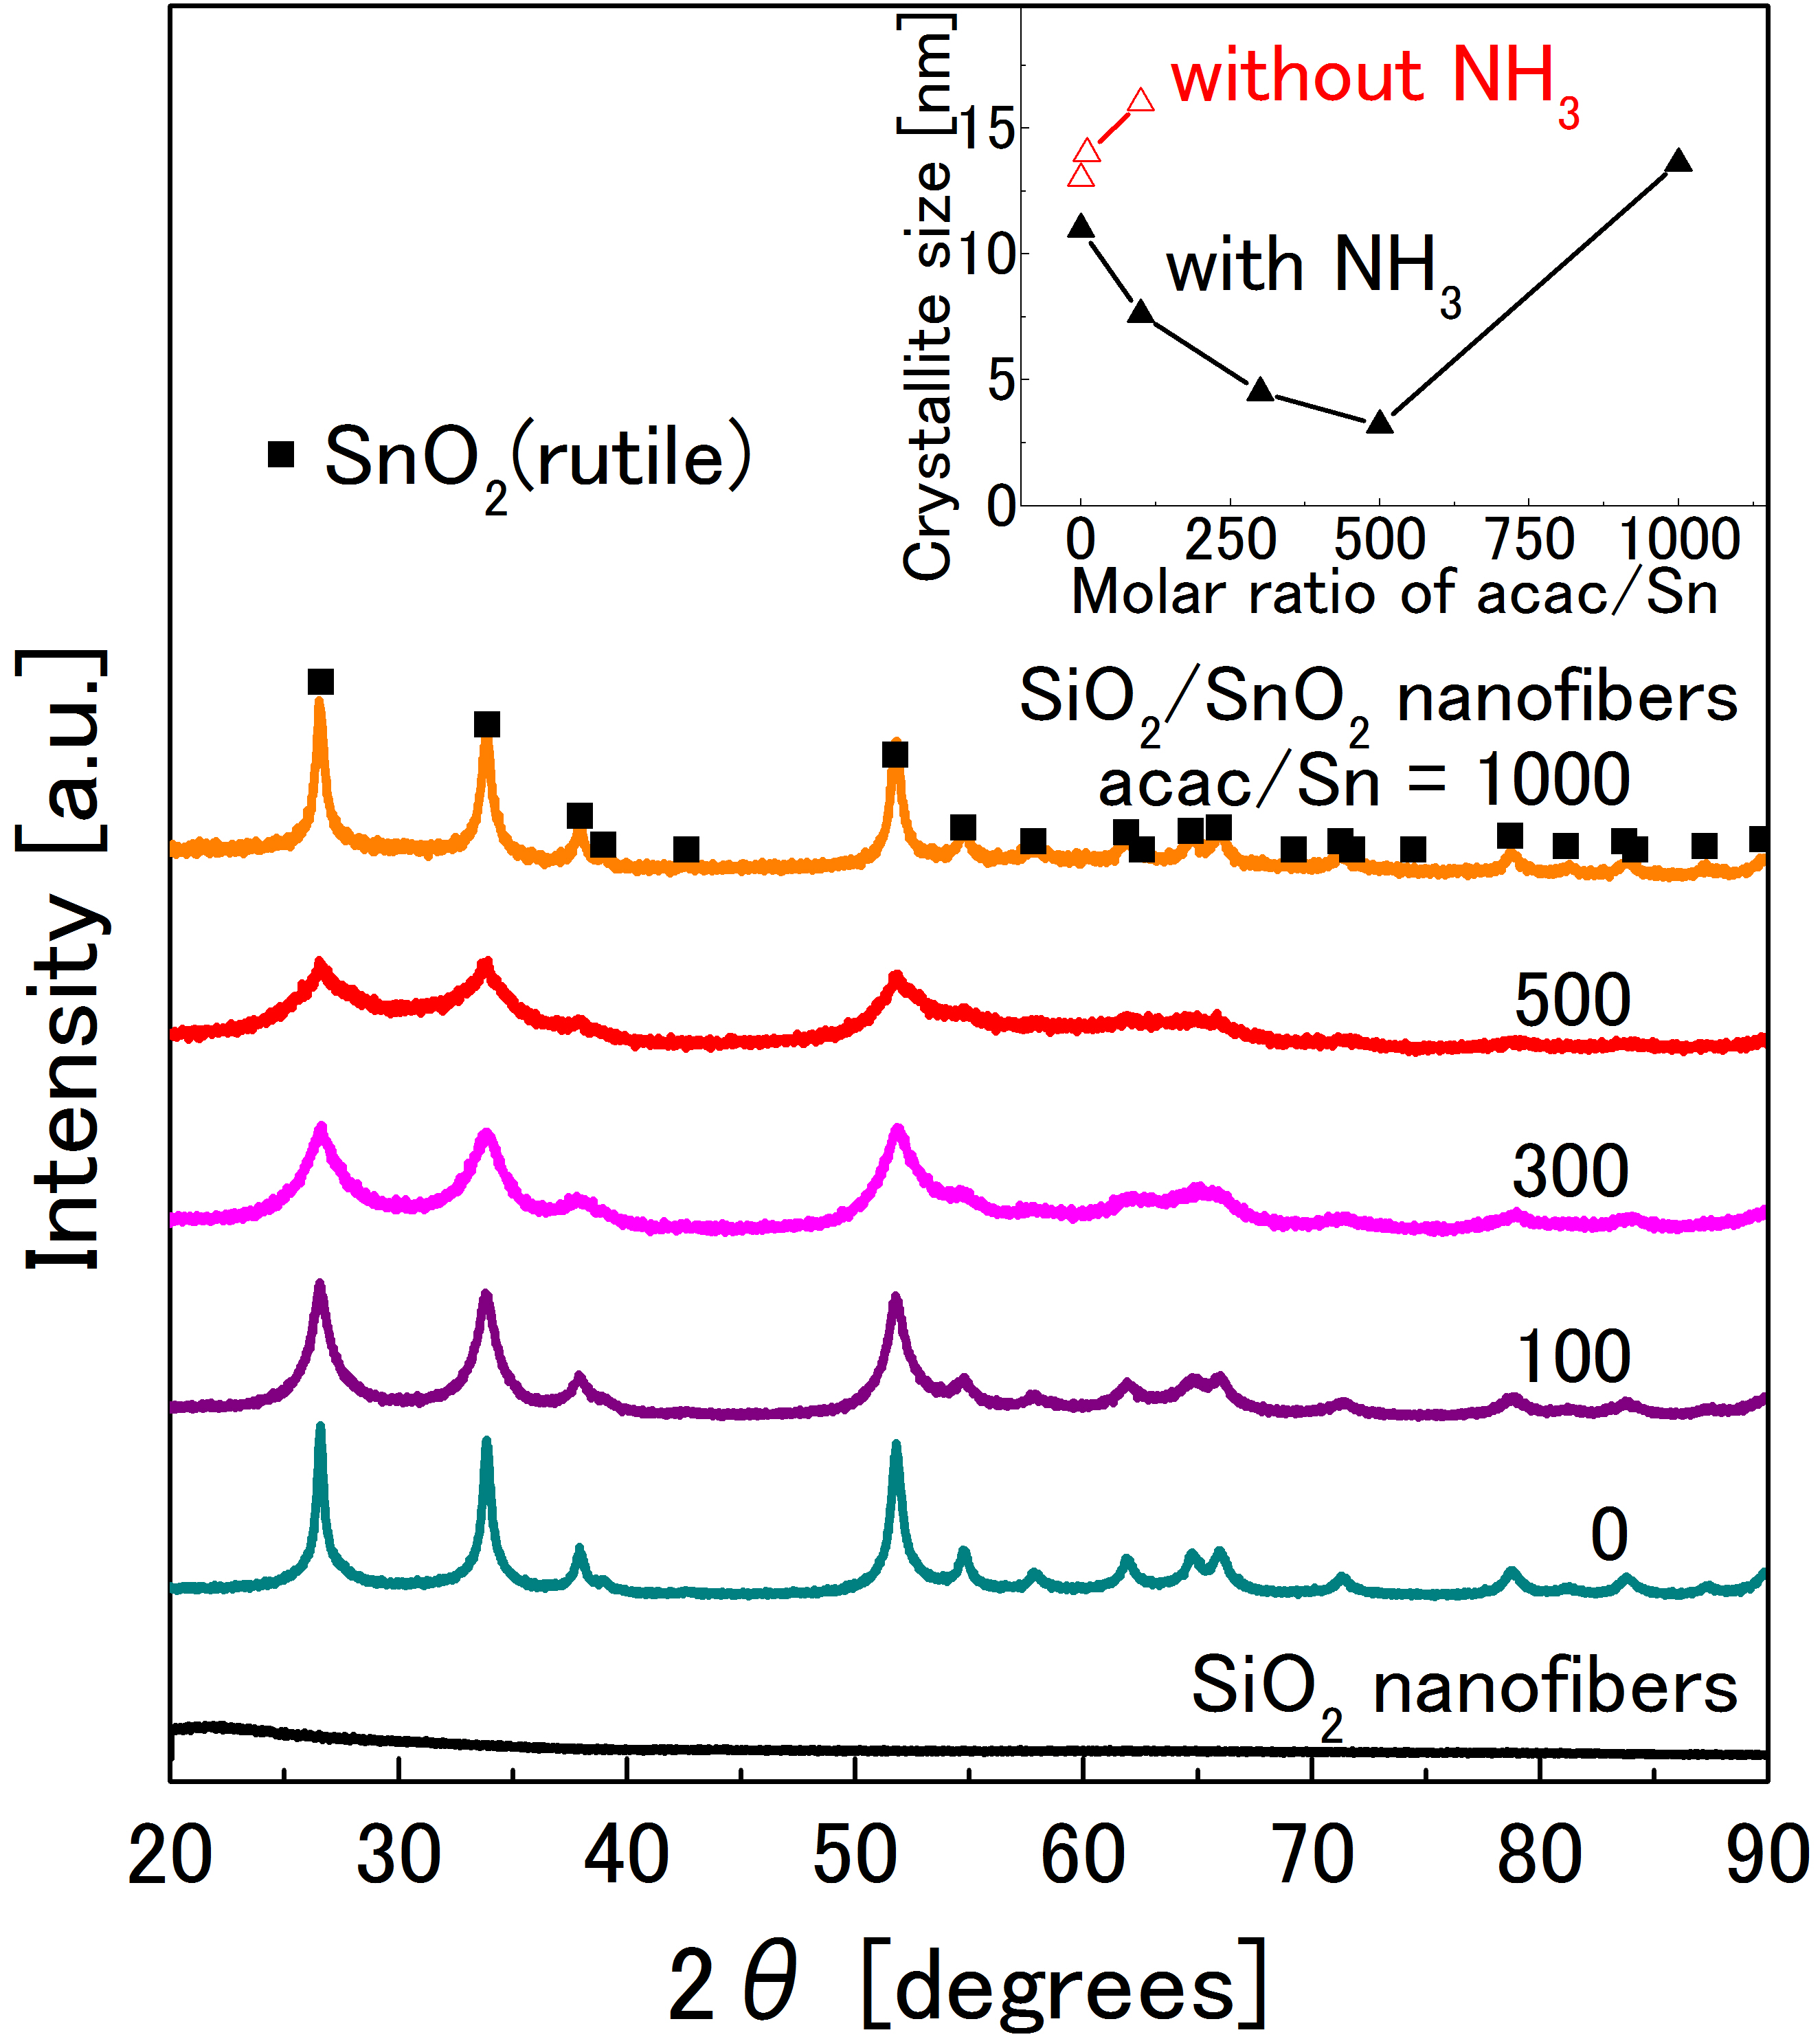
Figure 2. XRD patterns of SiO2 and SiO2/SnO2 nanofibers synthesized with various acac/Sn molar ratios. Inset plot indicate relationship between acac/Sn molar ratios and crystallite size of SnO2. Red-colored plots indicate results of SiO2/SnO2 nanofibers without use of NH3 as exceptional cases.
Figure 3 shows FE-SEM images of TOCN, SiO2 nanofibers, and SiO2/SnO2 nanofibers with various acac/Sn ratios. The SiO2/SnO2 nanofibers with the acac/Sn ratio of 500 maintained the fine structure derived from TOCN, however, the others possessed considerably coarse grains. These coarsening are corresponding to the large crystallite sizes in the inset of Figure 2. From these results, it was revealed that the use of NH3 and appropriate amount of acac can suppress the undesirable large grains. The generation of such coarse grains would be interpreted as follows; since a homogeneous nucleation via a self-condensation of tin isopropoxide occurred, these nuclei grew and then attached onto the surface of the nanofibers. Here the effect of acac can be explained by the formation of tin acetylacetonate. Such tin acetylacetonate, which is less reactive than tin alkoxide [15,16], suppressed self-condensation and finally caused the selective deposition on the nanofibers surface. In this study, since the formation of acetylacetonate occurred at the same time as the hydrolysis of tin isopropoxide, much more amount of acac compared to the stoichiometric acac/Sn molar ratio, which is up to 2, was required. It is assumed that the basicity of NH3 helped the formation of tin acetylacetonate through the deprotonation of acac [19]. On the other hand, it is expected that NH3 also acted as base for the dissolution of small nuclei derived from the self-condensation. Since acac is weak acid, the too much amount as acac/Sn ratio of 1000 caused the insufficiency of basicity for the dissolution of nuclei derived from the self-condensation, leading to the coarsening of SnO2 crystallites. It should be emphasized that a smaller crystallite size is desirable for a more sensitive gas sensor [17]. By TEM observation (Figure 3F-H), SiO2/SnO2 nanofibers with the acac/Sn ratio of 500 had the diameter of around 8 nm. They were covered with rutile SnO2 nanocrystals (Figure 3G, H). It can be interpreted that SiO2/SnO2 nanofibers have the core/shell structure reflecting the sequential deposition of SiO2 and SnO2 [13].

Figure 3. FE-SEM images of (A) TOCN, (B) SiO2 nanofibers, (C)-(E) SiO2/SnO2 nanofibers synthesized with acac/Sn molar ratio of 0, 500, 1000, respectively. TEM image of (F) SiO2/SnO2 nanofibers synthesized with acac/Sn molar ratio of 500, (G) high magnified image of selected area in (F). FFT image of (F) is shown in (H).
Furthermore, they exhibited an enormously high specific surface area of 322 m2/g (Table 1). The IR spectrum of SiO2/SnO2 nanofibers with the acac/Sn ratio of 500 was compared to that of the SiO2 nanofibers (Figure 4). Typical amorphous SiO2 peaks, such as Si-O-Si asymmetric stretching modes peaks around 1250 cm-1 and 1080 cm-1 [20], were observed in both samples. In the case of the SiO2/SnO2 nanofibers, the peak at around 970 cm-1 and the broad peak between 700 and 400 cm-1 are assigned to Si-O-Sn stretching mode and typical SnO2 absorption, respectively [21,22]. Due to the presence of Si-O-Sn peak, this result can be interpreted by the existence of the covalent bonding between SnO2 and SiO2.
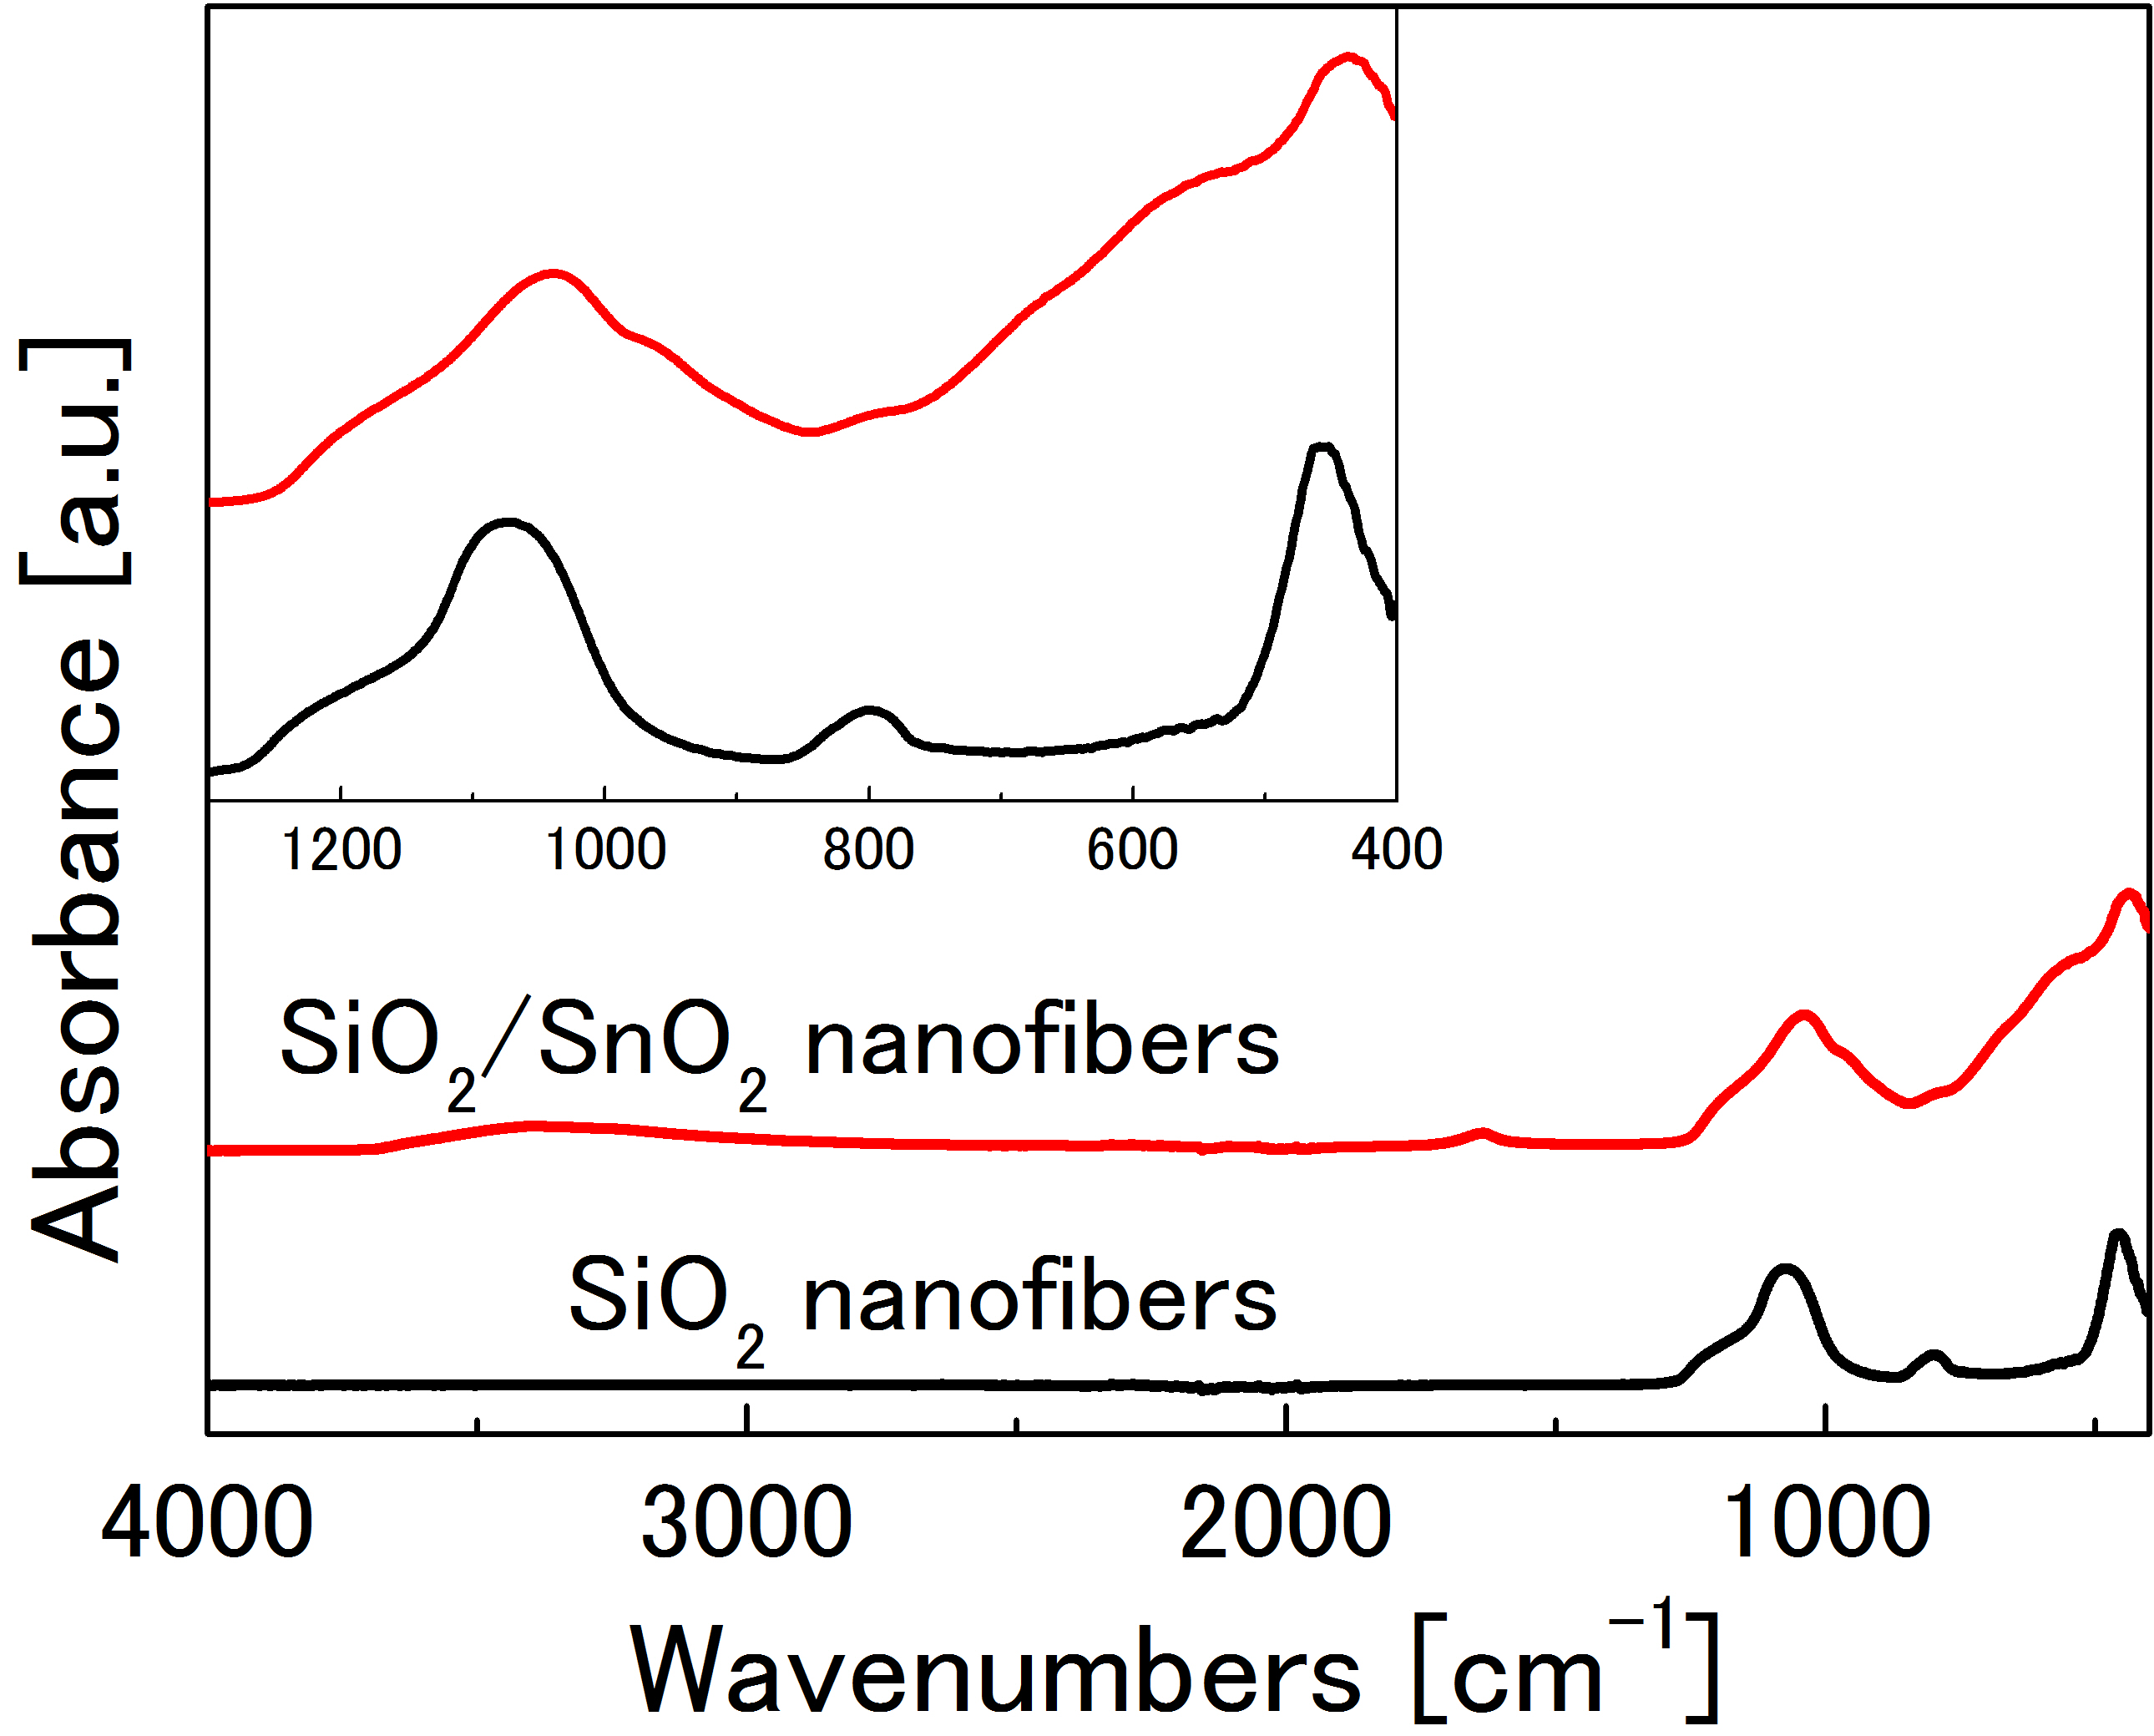
Figure 4. FT-IR spectra of SiO2 nanofibers and SiO2/SnO2 nanofibers synthesized with acac/Sn molar ratio of 500.
Figure 5 shows the resistance changes of the SiO2/SnO2 nanofibers with the different synthesis conditions under the cyclic exposure to the analyte gas containing 1000 ppm ethanol. The gas sensitivity is defined as the ratio of the resistance before and after the exposure to an analyte gas [17]. The relationships between the crystallite sizes and sensitivities for the synthesized SiO2/SnO2 nanofibers were shown in Table 1. The SiO2/SnO2 nanofibers with the acac/Sn ratio of 500 exhibited the simply high sensitivity value of 228 which is about 10 times as high as that with the acac/Sn of 0. It can be interpreted in terms of their smaller crystallite size [17].
Figure 5. Repetitive responses to 1000 ppm ethanol gas at 400°C.
We successfully synthesized SiO2/SnO2 nanofibers using TEMPO-oxidized cellulose nanofibers (TOCN) as templates. To obtain SiO2/SnO2 nanofibers, the templates of TOCN were combusted after the sequential deposition of SiO2 and SnO2 onto the surface of TOCN. SiO2/SnO2 were composed of amorphous SiO2 and rutile phase SnO2 nanocrystals. The detailed crystalline and microscopic structures were investigated in relation to the deposition condition of SnO2. The key factor was the molar ratio of acac/Sn and the presence of NH3. The optimal molar ratio of acac/Sn was 500 under the use of NH3. Since such optimized SiO2/SnO2 nanofibers keep the fine structure derived from TOCN, it can be expected that the crystallite size is controllable. Indeed, the synthesized nanofibers had a very thin diameter of around 8 nm and the smallest crystallite size of rutile SnO2 of 3.2 nm. We have also demonstrated that these nanofibers exhibited the high gas sensitivity of 228 to 1000 ppm ethanol, which is derived from the small crystallite size of SnO2. The synthesized SiO2/SnO2 nanofibers are also expected to exhibit high gas sensitivity to other volatile organic compounds (VOC). More detailed investigations are required.
This work was partially supported by JSPS KAKENHI Grant Number 16K13929, The Thermal & Electric Energy Technology Foundation, Tokuyama Science Foundation, Cross-Ministerial Strategic Innovation Promotion (SIP) Program, and Nanotechnology Platform Program of MEXT, JAPAN.
- Chen F, Peng X, Li T, Chen S, Wu XF, Reneker HR, Houl H (2008) Mechanical characterization of single high-strength electrospun polyimide nanofibers. Journal of Physics D: Applied Physics 41: 025308.
- Thavasi V, Singh G, Ramakrishna S (2008) Electrospun nanofibers in energy and environmental applications. Energy & Environmental Science 1: 205.
- Aronggaowa B, Toda Y, Ito N, Shikinaka K, Shimomura T (2013) Transparent conductive films fabricated from polythiophene nanofibers composited with conventional polymers. Polymers 5: 1325.
- Shen S, Henry A, Tong J, Zheng R, Chen G (2010) Polyethylene nanofibres with very high thermal conductivities. Nat Nanotechnol 5: 251-255. [crossref]
- Arafat MM, Dinan B, Akbar SA, Haseeb AS (2012) Gas sensors based on one dimensional nanostructured metal-oxides: a review. Sensors (Basel) 12: 7207-7258. [crossref]
- Kim I-D, Rothschild A (2011) Nanostructured metal oxide gas sensors prepared by electrospinning. Polymers for Advanced Technologies 22: 318.
- Li D, Xia Y (2004) Electrospinning of nanofibers: reinventing the wheel? Advanced Materials 16: 1151.
- Holmström SC, King PJS, Ryadnov MG, Butler MF, Mann S, Woolfson DN (2008) Templating silica nanostructures on rationally designed self-assembled peptide fibers. Langmuir 24: 11778.
- Gu Y, Huang J (2013) Precise size control over ultrafine rutile titania nanocrystallites in hierarchical nanotubular silica/titania hybrids with efficient photocatalytic activity. Chemistry - A European Journal 19: 10971.
- Zhang Y, Liu X, Huang J (2011) Hierarchical mesoporous silica nanotubes derived from natural cellulose substance. ACS Applied Materials & Interfaces 3: 3272.
- Korhonen JT, Hiekkataipale P, Malm J, Karppinen M, Ikkala O, et al. (2011) Inorganic hollow nanotube aerogels by atomic layer deposition onto native nanocellulose templates. ACS Nano 5: 1967-1974. [crossref]
- Huang J, Matsunaga N, Shimanoe K, Yamazoe N, Kunitake T (2005) Nanotubular SnO2 templated by cellulose fibers: synthesis and gas sensing. Chemistry of Materials 17: 3513.
- Gunji S, Shimotsuma Y, Miura K (2016) Synthesis and photocatalytic properties of SiO2/TiO2 nanofibers using templates of TEMPO-oxidized cellulose nanofibers. Journal of Sol-Gel Science and Technology 79: 151.
- Isogai A, Saito T, Fukuzumi H (2011) TEMPO-oxidized cellulose nanofibers. Nanoscale 3: 71-85. [crossref]
- Hampden-Smith MJ, W2021 Copyright OAT. All rights reservtate and solution structures of tin(IV) alkoxide compounds and their use as precursors to form tin oxide ceramics via sol-gel-type hydrolysis and condensation. Coordination Chemistry Reviews 112: 81.
- Briois V, Belin S, Chalaça MZ, Santos RHA, Santilli CV, Pulcinelli S (2004) Solid-state and solution structural study of acetylacetone-modified Tin(IV) chloride used as a precursor of SnO2 nanoparticles prepared by a sol-gel route. Chemistry of Materials 16: 3885.
- Xu C, Tamaki H, Miura N, Yamazoe N (1991) Grain size effects on gas sensitivity of porous SnO2-based elements. Sensors and Actuators B: Chemical 3: 147.
- Saito T, Kimura S Nishiyama Y, Isogai A (2007) Cellulose nanofibers prepared by TEMPO-mediated oxidation of native cellulose. Biomacromolecules 8: 2485.
- Seco M (1989) Acetylacetone: a versatile ligand. Journal of Chemical Education 66: 779.
- Wang J, Zou B, El-Sayed MA, (1999) Comparison between the polarized Fourier-transform infrared spectra of aged porous silicon and amorphous silicon dioxide films on Si (100) surface. Journal of Molecular Structure 508: 87.
- Shah P, Ramaswamy AV, Lazar K, Ramaswamy V (2004) Synthesis and characterization of tin oxide-modified mesoporous SBA-15 molecular sieves and catalytic activity in trans-esterification reaction. Applied Catalysis A: General 273: 239.
- Amalric-Popescu D, Bozon-Verduraz F (2001) Infrared studies on SnO2 and Pd/SnO2. Catalysis Today 70: 139.