Abstract
The nutritional status of children in slums of Dhaka is a sensitive indicator of health, economy and the sustainable development of Bangladesh. The research highlights the consequence of anthropometric measurements and nutritional status related other issues are taken of 102 children. The survey with a structured questionnaire was conducted by the researcher during 15th April 2015 to 6th June, 2015 among 102 children aged between 2 to 12 years from Mirpur, Kuril and Kamalapur slums (N=102) in Dhaka city. To determine hypothesis statistical data analysis QtiPlot and MS Excel software tools were used and hypothesis were tested. Bi-variant and analyses were used to determine the nutritional status of children and identify the relationship of common factors with the nutritional status of children. The research presents a number of results, 33.5% of the children age between 2 to 12 years are suffering from malnutrition. According to the BMI results, 32% of the children have undernourished problem. The socio-economical status of the children are pitiable. The children families mean monthly household incomes are affecting their health and nutritional status. The study reveals that 76.4% of the children are suffering from diseases for last one month because of their sanitation and hygiene status. The research also highlights the nutritional status of the children influenced by their parents awareness, socio-economical and demographic condition, nutrient intake, breastfeeding practice, good hygiene practice, sanitation system. Malnutrition along with high morbidity rates, this action may occur the children from their future unexpected problem during motherhood and hamper cognitive development. Nutritional education programs need to be implemented to improve the nutritional status. The present study generates information which indicates that the nutritional status of the children should not be overlooked and suitable approaches designed to improve their nutrition should be considered and studies elaborately in the future.
Key words
slums, malnutrition, nutritional status, food intake, hygiene and sanitation
Introduction
Bangladesh is the ninth most populous countries in the world [1] 1,203 persons per sq. km are living in Bangladesh [2] and Dhaka the capital of Bangladesh, one of the most densely populated cities in the world [3]. The population in slums of Dhaka city is increasing at an alarming rate due to migration by the rural poor. Slums are the spatial symptoms of urban poverty, social exclusion, and improper government policies [4]. Almost 28% people of Dhaka city are living in the slums under very miserable condition [5] and most of them are undernourished, illiterate and do not have knowledge about the nutritional value of foods [6]. Due to poor sanitation and congested living with 4 to 5 people, they often suffering from diseases like diarrhea, dysentery, typhoid, dengue and pneumonia [7]. Specially, children who are naturally innocent, vulnerable, and dependent often suffering from malnutrition [8]. The nutritional status of these children is a alert sign of the country’s health, sustainable nutrition and economy. Malnutrition of children is a serious problem in slums of Dhaka [9]. Malnutrition is one kind of situation in which long-lasting lack of one or more nutrients retards physical development or causes specific clinical disorders, e.g. low birth weight, wasting, stunting, underweight, vitamin A deficiency, iodine deficiency disorder, iron deficiency anemia, etc. [10]. Bangladesh is one of the countries with the highest rate of children malnutrition [2] and up to 40% of children under the age of 5 years are suffering from chronic malnutrition [11] and malnutrition rate of children in slums is even worse [12]. Protein-energy malnutrition, iron deficiency anemia, iodine deficiency disorders, and vitamin A deficiency are common for children in the slums of Dhaka city [13] and the main reasons for that their poor social, economic and demographic conditions, including family income, assets, morbidity, employment, total household expenditure, mother's education, social networks, hygiene and sanitation and consumption knowledge [6,7]. One of the ICDDR,B’s Centre for Nutrition & Food Security baseline survey in Bangladesh showed that undernutrition is high among young children, 41% of children were found stunted, 33% underweight and 11% wasting [14] .
Research aim and objectives
The research carried out to assess the nutritional status of under the age of 2 to 12 years children in slums of Dhaka city.
The associated major objectives include: 1) To find out the nutritional status of the children through anthropometric measurements and dietary assessment. 2) To find out the demographics and socio-economical characteristic of the study children. 3) To determine the health, and sanitation condition of the children.
Materials and methods
Research site
In this research, Mirpur slum of Mirpur Thana, Kamalapur slum of Motijheel Thana and Kuril slum of Badda Thana in Dhaka district have been chosen for the survey.
Research design
A survey was carried out among 102 children of Dhaka slums age between 2 to 12 years during April to June, 2015 with format permission from the local authority and by taking informal consent. It was a cross-sectional survey and divided into three clusters (Mirpur, Kuril and Kamalapur slums) in Dhaka city. Dietary data, socioeconomic, demographic, disease variables and anthropometric data - height, weight and BMI was collected by using a structural questionnaire and nutritional status assessed. The research has been conducted in two steps.
Firstly, the necessary data has been extracted from anthropometric cross-sectional health survey and each children gave a sample of food frequency.
Secondly, the extracted data has been assessed and compared with certain standards by analyzing specific contents.
Data collection
Data collection is the process of gathering information. The data collection process of this study was a primary research (field research). Total 102 children (respondents) have been selected of three different slums in Dhaka city and samples had been taken from these three clusters (slums) by using the questionnaire and made the interviews. Random sampling technique was used for data collection. Random Sampling is a probability sampling method, starting point is determined randomly and from then on the systematically each nth element is drawn [15]. The children's own mother language Bengali had been used during data collection.
Data analysis
For data analysis an important first step is summarize and display of the data [16]. In the current research, data were edited. Editing involves carefully checking survey data for completeness, legibility, consistency, and accuracy. The collected data were evaluated, categorized, grouped and interpreted aiming at the objectives of the study. Then, the relevant data processed and analyzed by using statistical software QtiPlot and Microsoft excel. In quantitative research, tables and graphs are used to display data and convey meaning in the analysis [17].
Results
Table 1 illustrates a total 102 children have studied. Of the participants 32.35% are aged 6 to 9 years, 48.04% are aged between 2 to 5 years and the remaining 19.61% are between 10 to 12 years old. Table 2 shows that total 31.8% children BMI are underweight (<14.5). On the other hand, 66.7% children's BMI normal (14.5-21.5) and 2% are overweight.
Table 1. Distribution of the children’s by their age group (N=102)
Source: (author's own construction and calculation according to own data source)
Age (year) |
Frequency (N) |
Percent (%) |
2 - 5 |
49 |
48.04 |
6 - 9 |
33 |
32.35 |
10 - 12 |
20 |
19.61 |
Total |
102 |
100 |
Table 2. Distribution of the children’s by age group with related to Body Mass Index (BMI) (aged 2 to 12 years) (N=102)
Source: (author's own construction and calculation according to own data source with compare to WHO children's BMI charts)
Age Group
(years) |
N (%) |
BMI |
Under nourished (< 14.5) n (%) |
Normal (14.5-21.5) n (%) |
Overweight (21.5+) n (%) |
2-5 |
49 (48.039) |
18 (36.72) |
29 (59.20) |
02 (4.08) |
6-9 |
33 (32.352) |
09 (27.27) |
24 (72.73) |
00 (00) |
10-12 |
20 (19.607) |
05 (25.00) |
15 (75.00) |
00 (00) |
Total 102(%) |
32 (31.8%) |
68 (66.7%) |
02 (1.97%) |
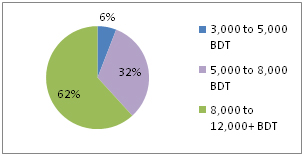
Figure 1. Distribution of the children’s by monthly household income (N=102)
Source: (author's own construction and calculation according to own data source)
Figure 1 shows that 62% of the children's family household income 8,000 to 12,000+ BDT (Bangladeshi Taka), 6% of the children's household income is 3,000 to 5,000 BDT and 32% is 5,000 to 8,000 BDT. But the incomes of these three groups are not enough for their living, accommodation, foods and others.
Table 3 shows that 6% of the children monthly household incomes are between Tk 3,000-5,000 and undernourished (<14.5) 83%. On the other hand, 32% of the children monthly household incomes are between Tk 5,000-8,000 and undernourished almost 40% and 62% of the children monthly household incomes are between Tk 8,000-12,000 and undernourished almost 22%.
Table 3. Distribution of the children’s by monthly household income with related to nutritional status/BMI (N=102)
Source: (author's own construction and calculation according to the own data source)
Per capita income (BDT) |
N (%) |
n (%) |
BMI |
3,000-5,000 |
6 (%) |
05 (83.33) |
Under nourished (< 14.5) |
01 (16.67) |
Normal ( 14.5-21.5) |
00 (00) |
Overweight (21.5+) |
5000-8,000 |
33 (32%) |
13 (39.4) |
Under nourished (< 14.5) |
20 (60.6) |
Normal ( 14.5-21.5) |
00 (00) |
Overweight (21.5+) |
8,000-12,000 |
63 (62%) |
14 (22.2) |
Under nourished (< 14.5) |
47 (74.6) |
Normal ( 14.5-21.5) |
02 (3.2) |
Overweight (21.5+) |
Total |
102 (100) |
102 |
BMI (14.5 to 21.5+ ) |
Table 4 shows that the relationship amongst the nutrient intake and per capita income of the children. The children are divided into three groups based upon the household per capita income. Children from lower income families calorie, protein and iron intake which are seen lower than the children from higher income families. Mean energy, protein and iron intake are highest 1102.4859 kcal, 16.55 g, 5.70 mg respectively, for the children who are from families of highest per capita income between Tk. 8,000-12,000/month.
Table 4. Relationship between per capita income and nutrient intake (N=102)
Source: (author's own construction; the data was calculated on the basis of WHO/FAO technical committee dietary guidelines for children's data)
Per capita income |
No. of children |
Mean calorie intake (kcal) |
Mean protein intake (g) |
Mean iron intake (mg) |
3,000-5,000 |
06 |
986.66 |
13.92 |
5.002 |
5,000-8,000 |
33 |
1029.75 |
16.87 |
6.106 |
8,000-12,000 |
63 |
1102.48 |
18.84 |
6.018 |
Total |
102 |
1039.40 |
16.55 |
5.70 |
Table 5 illustrates that the mean height of the children (cm) are 109.72 ± 5.6, weight (kg) was 15.83 ± 9.4 and Mean Body Mass Index (BMI) (kg/m2) are 15.74 ± 3.5. Mean BMI is 15.74 which is acceptable but not enough because 32% children are under nourished.
Table 5. Anthropometric characteristic of the children (N=102) (aged 2 to 12 years)
Source: (author's own construction; own primary data source)
|
Minimum |
Maximum |
Mean |
St. D. |
Height (cm) |
81.28 |
147.32 |
109.72 |
± 5.6 |
Weight (kg) |
11.0 |
30.0 |
15.83 |
± 9.4 |
BMI (kg/m2) |
11.44 |
18.16 |
15.74 |
± 3.5 |
| |
|
|
|
|
|
|
Table 6 shows that total children mean food intake 290.58 gm per day. The contribution from cereals are 131.31 gm which is 45.19% of total food intake per day almost half of the total food intake. Food consumption from animal sources such as meat, fish and egg are 60.68 gm which is 20.88% of total food intake and animal dairy & dairy products are 24.87 g per day which is 8.55% of total food intake per day per children and others food intake respectively.
Table 6. Mean per capita food intake per day (N=102)
Source: (author's own construction and calculation; according to own data)
Food sources |
Mean food intake
(g/d) |
Percentage (%) |
Cereals |
131.31 |
45.19 |
Pulses |
14.91 |
5.13 |
Green Leafy Vegetables |
22.10 |
7.61 |
Non Leafy Vegetables |
24.26 |
8.35 |
Fruits |
12.45 |
4.29 |
Meat, fish & egg |
60.68 |
20.88 |
Milk & milk products |
24.87 |
8.55 |
Total |
290.58 |
100 |
Table 7 shows that the mean calorie intake are 1039.40 kcal, protein intake are 16.55 g/d. The mean CHO, fat, vit-C, iron and calcium intake are found 139.53 g, 14.11 g, 22.72 mg, 5.70 mg and 407.75 mg respectively/day.
Table 7. Mean per capita nutrient intake by food sources (N=102)
Source: (author's own construction; data calculation on the basis of FAO-Infants, children, and adolescents energy, protein and micronutrients requirement data)
Nutrients |
Mean per capita intake |
Cal. intake (kcal) |
1039.40 |
Protein (g) |
16.55 |
Fat from foods (g) |
14.11 |
Carbohydrate (g) |
139.53 |
Vitamin C (mg) |
22.72 |
Iron (mg) |
5.70 |
Calcium (mg) |
407.75 |
Table 8 illustrates that the mean daily energy requirement on the basis of their age group of the studied children are 1316.66 kcal and most mean energy balance deference is -387.52 kcal of the age group 10 to 12 years of children but age group 2 to 5 years old children mean energy balance deference looking -191.74.
Table 8. Distribution of the children's by their mean energy intake per day (N=102)
Source: (author's own construction; the data was calculation on the basis of WHO/FAO data)
Age group
(years) |
No. of children N (%) |
Mean energy requirement/day (kcal) |
Mean energy intake/day (kcal) |
Mean energy balance/day (kcal) |
2-5 |
49 (48.039) |
1150.00 |
958.26 |
-191.74 |
6-9 |
33 (32.352) |
1300.00 |
1047.4 |
-252.55 |
10-12 |
20 (19.607) |
1500.00 |
1112.4 |
-387.52 |
Table 9 shows that per capita energy and nutrient intake and mean percentage fulfillment of the requirement. The table shows gross inadequacy in terms of % fulfillment of the recommended allowance for energy, protein, iron, fat, CHO, vitamin-C and calcium and different age group of children with different amount of nutrients requirement and intake. The percentage of nutrients fulfillment/day is lower than RDA and it came from seven individual nutrients of foods e.g. energy (kcal) 76%, protein 68%, fat 52%, iron 69%, calcium 43% and CHO 76% mean fulfillment per day. Vitamin-C intake is 82% and higher percentage than others nutrient groups.
Table 9. Per capita energy and nutrient intake and mean percentage fulfillment of the requirement (N=102)
Source: (author's own construction and calculation according to own data source with compared to WHO/FAO data) Here age group 2-5 years: n =49; 6-9 years: n=33 and 10-12 years: n=20
Nutrients |
Age group (years) |
Intake |
Requirement |
% of Fulfilment |
Mean % of Fulfilment |
|
Energy (kcal) |
2-5 |
958.26 |
1200 |
79% |
76% |
6-9 |
1047.4 |
1350 |
77% |
10-12 |
1112.4 |
1500 |
74% |
|
Protein (g) |
2-5 |
13.43 |
19 |
70% |
68% |
6-9 |
17.17 |
24 |
71% |
10-12 |
19.04 |
29 |
65% |
Fat from food (g) |
2-5 |
13.02 |
20 |
65% |
52% |
6-9 |
14.55 |
30 |
49% |
10-12 |
14.78 |
35 |
42% |
CHO (g) |
2-5 |
115.70 |
158.1 |
73% |
76% |
6-9 |
132.07 |
178.7 |
73% |
10-12 |
170.84 |
206.2 |
82% |
Vit-C (mg) |
2-5 |
13.55 |
15 |
90% |
82% |
6-9 |
21.40 |
25 |
85% |
10-12 |
33.21 |
45 |
73% |
Iron (mg) |
2-5 |
5.002 |
07 |
71% |
69% |
6-9 |
6.106 |
10 |
61% |
10-12 |
6.018 |
08 |
76% |
Calcium (mg) |
2-5 |
333.50 |
700 |
48% |
43% |
6-9 |
415.09 |
1000 |
42% |
10-12 |
474.41 |
1200 |
40% |
Table 10 shows that the relation between BMI and nutrient intake. 68 children has normal BMI and they consumed 1040 ± 319 kcal energy, 18 ± 10 g protein, 14 ± 8.5 g fat and 175 ± 46 g CHO. On the other hand, 32 children are undernourished and their BMI are below 14.5. They consumed 874 ± 325 kcal energy, 14.5 ± 9g protein, 12.5 ± 9 g fat and 113 ± 58 g CHO.
Table 10. Distribution of subjects by Body Mass Index and nutrient intake (N=102)
Source: (author's own construction and calculation according to own data source)
BMI |
Num. of children |
Energy
(kcal) |
Protein
(gm) |
Fat
(gm) |
CHO
(gm) |
< 14.5 |
32 |
874 ± 325 |
14.5 ± 9 |
12.5 ± 9 |
113 ± 58 |
14.5-21.5 |
68 |
1040 ± 319 |
18 ± 10 |
14 ± 8.5 |
175 ± 46 |
21.5+ |
02 |
1204 ± 41 |
17 ± 1 |
16 ± 1.5 |
131 ± 11 |
Table 11 reveals that current energy intake reduced by 60.60 kcal as compared with icddr'b-2010 national survey. But compared to the WHO-2000 and WFP-2008 survey with the current research, the energy intake is slightly increased. The energy intake ratio of the children is fluctuated but not big margin the table shown. On the other hand, the current study shows that protein intake decreased gradually and it is 16.6 g/day but 15 years before it was 26 g/day.
Table 11. Comparison of per capita energy and protein intake of the children’s with WFP-2008, WHO-2000 and icddr'b-2010
Source: (author's own construction; comparison with WHO, WFP, ICDDR'B and current study's data)
Nutrients |
WHO-2000 |
WFP-2008 |
ICDDR'B
2010 |
Current study |
Energy(kcal) |
1020 |
1007 |
1100 |
1039.4 |
Protein(g) |
26 |
22 |
19.5 |
16.60 |
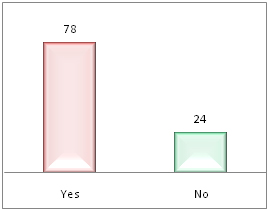
Figure 2. Distribution of morbidity pattern among the children of last one month (N=102)
Source: (author's own construction and calculation according to own data source
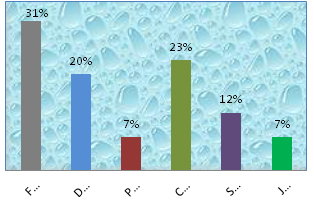
Figure 3. Distribution of the children’s by disease (N=78) (according to figure 1)
Source: (author's own construction and calculation according to own data source)
Figure 3 Indicates that 31% children suffering from fever, 20% diarrhea, 23% cold & cough and these diseases are a common issues for children in slums. The figure also shows that 7%, 12% and 7% of the children suffering from pneumonia, skin disease and jaundice respectively.
Table 12 indicates that there is a relationship between the morbidity patterns (last one month) of the children related with BMI. 91% of undernourished children suffering from any sort of diseases. On the other hand, the study found that, 72% of the normal children are also suffering from any sort of diseases. The underweight children morbidity rate is higher than the others BMI group children though. But there is no big margin between BMI and the morbidity pattern of the children.
Table 12. Relation between the morbidity patterns (last one month) of the children’s related with BMI (N=102)
Source: (author's own construction and calculation according to own data source)
BMI |
No. of children's (N) |
Suffered from disease |
Not suffered from disease |
% suffered from disease |
Undernourished |
32 |
29 |
03 |
91 |
Normal |
68 |
49 |
19 |
72 |
Overweight |
02 |
00 |
02 |
00 |
Total |
102 |
78 |
24 |
76 |
Table 13 reveals that the types of water children's and their family used for drinking and for household tasks. Here children's family, N=54; Total children's 102, so 102/54=1.88 this value are average children per house. Highest 41% family are using supply water for drinking and another major source is tube well water which are 28% but 31% family used supply & tube well water both for drinking. On the other hand, 30% family are using supply water for household works and 22% family are using tube well water. 37% family are using supply & tube well water both for household tasks. But one of the concerning issues is that 11% of family are using cannel/river water which is so much dirty and it is not permitted for using.
Table 13. Distribution of the source of water using the children’s family per day (total children's family 54 and number of children's 102) (N=54)
Source: (author's own construction and calculation according to own data source) Here children's family, N=54; Total children 102, so 102/54=1.88 this values are average children's per house.
Sources of water |
No. of children's family (N=54) |
Percentages (%) |
For drinking |
Supply water |
22 |
41 |
Tube well water |
15 |
28 |
Cannel/river water |
00 |
00 |
Supply & Tube well water both |
17 |
31
|
For household works |
Supply water |
16 |
30 |
Tube well water |
12 |
22 |
Cannel/river water |
06 |
11 |
Supply & Tube well water both |
20 |
37 |
Table 14 shows that the types of human and household waste disposal of the children. 50% family are disposing their human waste near outside the house, 35% of the children with family disposing human waste far away outside the house and 15% of the children and their family disposing human waste near outside the house & far away outside the house both. On the other hand, 59% of the family are disposing their household waste near outside the house, 26% are disposing household waste far away outside the house and 13% are disposing household waste near outside the house & far away outside the house both. Only 2% of the children's family found they put household waste inside the house.
Table 14. Distribution of the human waste and household waste disposal status of the children’s family (total children's family 54 and number of children's 102) (N=54)
Source: (author's own construction and calculation according to own data source)
Sources of water
|
No. of children's family (N=54) |
Percentages (%) |
For human waste disposal |
Inside the house |
00 |
00 |
Near outside the house |
27 |
50 |
Far away outside the house |
19 |
35 |
Near outside the house & far away outside the house both |
08 |
15
|
For household waste disposal |
Inside the house |
03 |
02 |
Near outside the house |
32 |
59 |
Far away outside the house |
14 |
26 |
Near outside the house & far away outside the house both |
07 |
13 |
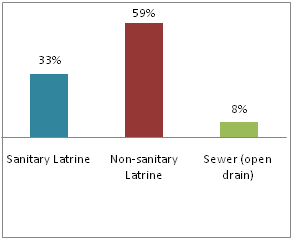
Figure 4. Distribution of the types of latrine children's have used for human waste disposal (N= 102)
Source: (author's own construction and calculation according to own data source)
Figure 4 illustrates that the types of latrine children using for human waste disposal. Here the figure shows that 59% of the children are using non-sanitary latrine and 33% are using sanitary latrine. On the other hand, 8% children use sewer (open drain).
Table 15 indicates that the relation of the health issues like morbidity pattern with using water, human waste disposal and household waste disposal status of the children. 75% of the children are suffering from disease and it is related with the types of drinking water. On the other hand, 79% of the children are suffering from disease with related to household used water. Similarly, 75% and 80% children's disease also related with human waste disposal and household waste disposal respectively.
Table 15. Relationship between morbidity patterns and using water, human waste disposal and household waste disposal status (N=102)
Source: (author's own construction and calculation according to own data source)
Sources |
Percentages N (%) |
Morbidity patterns |
Yes (n) |
(n%) |
No (n) |
(n%) |
For drinking water |
Supply water |
42 (41) |
31 |
73 |
11 |
27 |
Tube well water |
28 (28) |
16 |
57 |
12 |
43 |
Cannel/river water |
00 (00) |
00 |
00 |
00 |
00 |
Supply & Tube well water both |
32 (31) |
31 |
96 |
01 |
04 |
Total |
102 (100) |
78 |
75 |
24 |
25 |
For household works |
Supply water |
31 (30) |
25 |
81 |
06 |
19 |
Tube well water |
22 (22) |
17 |
77 |
05 |
23 |
Cannel/river water |
11 (11) |
10 |
91 |
01 |
09 |
Supply & Tube well water both |
38 (37) |
26 |
68 |
12 |
32 |
Total |
102 (100) |
78 |
79 |
24 |
21 |
For human waste disposal |
Inside the house |
00(00) |
00 |
00 |
00 |
00 |
Near outside the house |
51 (50) |
43 |
84 |
08 |
16 |
Far away outside the house |
36 (35) |
23 |
63 |
13 |
37 |
Near outside the house & far away outside the house both |
15 (15) |
12 |
80 |
03 |
20 |
Total |
102 (100) |
78 |
75 |
24 |
43 |
For household waste disposal |
Inside the house |
02 (02) |
02 |
100 |
00 |
00 |
Near outside the house |
61 (59) |
49 |
80 |
12 |
20 |
Far away outside the house |
26 (26) |
17 |
65 |
09 |
35 |
Near outside the house & far away outside the house both |
13 (13) |
10 |
76 |
03 |
24 |
2021 Copyright OAT. All rights reserv
Total |
102 (100) |
78 |
80 |
24 |
21 |
Discussion
The nutritional status of the slums children is a sensitive indicator of the country’s health, sustainable nutrition and economy. This present study reveals that children aged between 2-5 years are found 48% (Table 1), almost half of the total study children which is very sensitive age group of the children's whole life. Because, 2-5 years of children are suffering from malnutrition more (36.72%) than the other two groups of children in slums of Dhaka (Table 2). According to the WFP-2009, malnourished children are birth to 5 years old at high risk of morbidity and mortality rate. Current research reveals that cereal food groups, especially rice has eaten daily (20-21 times/week) by 96.07% of the children. Therefore, malnutrition is a serious problem of children in slums of Dhaka [9]. According to the Child Nutrition Survey of Bangladesh 1990- 2005, during 1990 to 2005, the prevalence of underweight was reduced by 25.2 percentage points which was from 70.9% to 45.7% and stunting by 29.1 percentage points from 68.3% to 39.2%. It was a significant reduction and the survey expected that Bangladesh achieves the target of reducing underweight prevalence to 32.9% in 2015. Another survey conducted by Bangladesh Bureau of Statistics (BBS) [18] and according the BBS survey and WHO 2005 growth reference standards, almost 33% of children aged in between birth to 6 years were undernourished in Bangladesh. The World Health Organization illustrated that the undernourished rate was "very high", and the prevalence of wasting point out a "critical problem" in Bangladesh [19]. In Dhaka division the nutritional status of children had the lowest prevalence of wasting which was 9.7% but when it made ratio with slums children it was more than 9.7% [19]. The current study indicates that the mean Body Mass Index (BMI) (kg/m2) of the children are 15.74 ± 3.5. Mean BMI are 15.74 which is acceptable but not enough because 32% of the children's BMI are undernourished (<14.5) (Table 2). The study also shows that 33.5% of the children under the age between 2 to 12 years are suffering from malnutrition because of the total percentages of nutrients fulfillment per day is lower than Recommended Dietary Allowances (RDA) set by the relevant national and international body including ICDDR'B, Bangladesh, National Nutrition Council (NNC), Bangladesh, WHO and FAO for children. This prevalence of percentage comes from seven individual essential nutrients of food such as energy 76%, protein 68%, fat 52%, iron 69%, calcium 43% and CHO 76% mean fulfillment per day (Table 9).
On the other hand, the present study illustrates that the socio-economical status of the slums children in Dhaka are lower than other groups of the Dhaka city and the families mean monthly household income 6833.33 BDT when the whole country's per capita mean monthly income was 8869.50 BDT (1314 US Dollars/year) [20] and these poor amount of monthly income are affecting their health, sanitation and nutritional status [13]. According to the Universal Salt Iodization Survey, 2005, millions of children are suffering from one or more types of malnutrition including underweight, Vitamin A deficiencies, iodine deficiency disorders (IDD) and anemia. According to FAO nutritional country profile-Bangladesh (1999), the children were suffering from higher rate of micronutrient deficiencies including vitamin-A, iron, iodine and zinc deficiency in Bangladesh [21]. The present study reveals that the children intake less energy than their requirement (Table 8). Overall their energy balance is negative, protein and iron intake is 16.55 gm and 5.70 mg daily which are too low and not fulfillment of RDA (Table 9). Table-11 shows that the protein intake of the children are gradually decreasing day by day compared to the WHO-2000 and WFP-2008 survey with the current research but the energy intake is slightly increased. The present study shows that the energy intake ratio of the children is fluctuated but not a big margin than the other study (Table 11). Protein intake is decreased because of poverty, high price of rice and other essential commodities, low purchasing power of the children's families especially in slums children's families of Bangladesh might limit the consumption of protein. Protein intake is decreased time after time and current study shows that children intake protein 16.6 g/day but 15 years before it was 26 g/day. The insufficient consumption of protein and micronutrients results in various long and short-term health problems e.g. stunting, underweight, wasting, osteoporosis and low bone-mass [22].
The report of Child Nutrition Survey 2005, published by Bangladesh Bureau of Statistics, the prevalence of underweight was reported to 39.7% whereas the present study says that it is 31.8% undernourished in Slums of Dhaka city. Malnourished children are at high risk of morbidity and mortality [23]. Morbidity such as diarrheal disease, upper respiratory infections, blindness, skin disease can significantly reduced if children uses safe water, proper sanitation and hygienic disposal of human waste (Health, Population and Nutrition Sector Development Program, 2011-16). The present study shows that 76.4% of the children are suffering from diseases of last one month including 20%, 31% and 12% of the children are suffering from diarrhea, fever and skin diseases respectively (Figure 2 and 3) and these are the common issues for children in slums of Bangladesh. The present study indicates that there are a big relationship between the morbidity patterns (last one month) of the children related with BMI and 91% of undernourished children are suffering from any sort of diseases whereas 72% of the BMI normal children are suffering from any sort of diseases last one month (Table 12). The research shows that the underweight children's morbidity rate higher than the other BMI group children. But there is no significant difference found between BMI and the morbidity pattern of the children. According to the Table 15, there are a co-relationship found between morbidity patterns and using water, human waste disposal and household waste disposal status of the children. The NHDSBD survey-2011 indicated that tube wall water and supply water are the most common sources of drinking water in Bangladesh and 94.4% of household use supply or tube well water as drinking water [24] The present study illustrates that 41% children's family are using supply water for drinking and 28% of the children's family are using tube wall water and 31% family are using supply & tube wall water both for drinking. On the other hand, 11% of the children's family are using cannel/river's water which is so much dirty and it is not permitted for using. The current study shows that almost two-third of the children are using non-sanitary latrine which is 59% whereas 33% are using sanitary latrine. But 8% children are using sewer (open drain) which is very harmful for environment as well as children's health (Figure 4). Table 15 indicates that the relationship between morbidity patterns and using water, human waste disposal and household waste disposal status of the children. According to table-15, 75% children suffered from disease with related to types of drinking water. On the other hand, 79% of the children suffered from disease with related to household used water. Similarly, 75% and 80% children's disease also related with human waste disposal and household waste disposal respectively.
Overall, in this study find out that one-third of the total children are suffering from malnutrition because of their lack of nutrients intake, BMI is poor than the standard references and their pitiable socio-economical, demographical condition as well as poor sanitation and lack of hygiene practice affecting nutritional status of the slum children in Dhaka, Bangladesh.
Recommendations
The nutritional status of the slum children are more than average in Bangladesh but they lack in nutrient intake food along with physical activities and morbidity rate, this action may occur these children from their future unexpected problem during motherhood and hamper the cognitive development. Nutrition education programs need to be implemented to improve the nutritional status. The present study has generated information which indicates that the nutritional status of this group should not be overlooked and suitable approaches designed to improve their nutrition should be considered. It should studies elaborately in future. Depending on the findings, however a set of recommendation has been made for the improvement of their nutritional status.
1. Primary focus on nutrition promotion, and the central role of the school: Health promoting schools may provide an appropriate framework for enhancing nutrition among children, at least for those who are in school. School-based programs may also encourage children to remain in school, e.g. school-feeding programs. This is particularly important for children. Community-based institutions e.g. youth groups, community clinic, local NGOs can also be involved, in addition to using media.
2. Prevention and management of nutritional problems and risks: Health care providers can deal most directly, and primarily with micronutrient deficiencies, malnutrition of the children's.
3. Nutritional assessment: Nutritional assessment should be an inherent part of preventive health care services to children. This includes anthropometry could even be regularly measured in schools or if possible in house by the Government body or NGOs.
4. Provide hygiene and health related knowledge: Hygiene and health related proper knowledge should be provided and developed by the Government body or national and international NGOs. Because the study children's morbidity rate is very high and hygienic practice is too poor. One of the important thing is that their using drinking and household water should be changed.
5. Control of Diarrheal diseases: Issues regarding implementation of micronutrient malnutrition as well as diarrheal diseases control programs are only partially addressed. Higher allocation of resources need to be made to improve the outreach of health care delivery.
6. Control of micronutrient deficiencies: Iron deficiency anemia need to be controlled and prevented in children. Iron deficiency is the predominant cause of anemia, and correcting it is an investment in adult productive and reproductive lives. Multiple mineral vitamin supplementations to correct the problem could be done for little cost. Providing free or price-subsidized micronutrient fortified food during school hours would be a further step towards improving their nutritional status. Young children's are ideal targets for food-based approaches to improving micronutrient status, in particular vitamin A and iron.
7. Improve socio-economical and environmental condition: High socioeconomic and good environmental conditions are the most important factors associated with lower prevalence of malnutrition. The Government and the associated stockholders should be taken the proper steps for improving their socio-economical and environmental status.
8. To start community Nutrition Program: Community nutrition is a branch of human nutrition focuses on serving all people, especially in children and to meet their food and nutrition. Also needs to improve or maintain in a healthy state, through all stages of life of the children.
9. Perceptions and knowledge: A concentrated approach to improve awareness among all regarding the importance of nutrition for children is likely to be very useful and breastfeeding practices should be encourage among the lactating mothers. Gender discriminations should be eliminated from the society through awareness rising to ensure intra-household food security.
References
- Central Intelligence Agency (CIA), US (2014) The World Fact Book.
- World Bank (2011) Rice Fortification: A key Part of the Solution to Micronutrient deficiencies. The Agriculture and Rural Development and Health and Nutrition and Population Team, World Bank.
- World Health Organization (WHO), (2015) Country Profile, Bangladesh.
- Sclar ED, Northridge ME (2003) Slums, slum dwellers, and health. Am J Public Health 93: 1381. [Crossref]
- World Urban Forum (2004) Dialogue on the urban poor: improving the lives of slum-dwellers.
- Pryer JA, Rogers S, Normand C, Rahman A (2002) Livelihoods, nutrition and health in Dhaka slums: Public Health Nutrition.
- Rahman MA (2012): Improvement of Health, Hygiene and Nutritional Status of Urban Slum Dwellers- A Program of RCE Greater Dhaka, Bangladesh.
- Haque MM, Bhuiyan MR, Naser MA, Arafat Y, Suman KR, et al. (2014): Nutritional Status of Women Dwelling in Urban Slum Area. J Nutr Health Food Eng 1: 00014.
- Arifeen SE1, Black RE, Caulfield LE, Antelman G, Baqui AH, et al. (2000) Infant growth patterns in the slums of Dhaka in relation to birth weight, intrauterine growth retardation, and prematurity. Am J Clin Nutr 72: 1010-1017. [Cross Ref]
- Blössner, M. and de Onis, M. (2005) Malnutrition: quantifying the health impact at national and local levels. Geneva, World Health Organization.
- UNICEF (2013) IMPROVING CHILD NUTRITION, The achievable imperative for global progress, © United Nations Children’s Fund (UNICEF) April 2013, United Nations Publications.
-
Faruque AS, Ahmed AM, Ahmed T, Islam MM, Hossain MI, et al. (2008) Nutrition: basis for healthy children and mothers in Bangladesh. J Health Popul Nutr 26: 325-339. [Cross Ref]
- UNICEF (2011): Child and Maternal Nutrition in Bangladesh.
- International Centre for Diarrhoeal Disease Research, Bangladesh (Icddr’b), (2012): Baseline survey reveals high under-nutrition amongst children in Bangladesh.
- Shao AT, Zhou KZ (2007): Marketing research. 240, 3rd edition, London et al. Thomson Learning.
- Kirkwood BR, Sterne JA (2003): Essential Medical Statistics, Chapter 3 - Displaying the data, page 15, 2nd edition, Black well Publication Ltd.
- Proctor T (2005): Essentials of Marketing Research, page no. 324, 4th edition, Prentice Hall, UK
- Bangladesh Bureau of Statistics (BBS), (2015): Multiple Indicator Cluster Survey 2012-2013, Statistics and Informatics Division, Ministry of Planning Government of the People’s Republic of Bangladesh Dhaka, Bangladesh ©Bangladesh Bureau of Statistics (BBS) and United Nations Children’s Fund (UNICEF) March, 2015
- World Health Organization (WHO), (2005): WHO growth reference standards, Bangladesh
- bdnews24.com (2015): Bangladesh’s per capita income rises to $1,314.
- FAO, (1999): Nutrition Country Profile - BANGLADESH, 25 March 1999, FAO, Rome
- Leslie J (1991) Women’s nutrition: the key to improving family health in developing countries? Health Policy and Planning 61: 1-19
- World Food Program (WFP), United Nations Children’s Fund (UNICEF), Institute of Public Health Nutrition (IPHN) (2009): Household Food Security and Nutrition Assessment in Bangladesh, November 2008-January 2009. WFP/UNICEF/IPHN, Ministry of Health and family Welfare, Bangladesh.
- Nutrition, health and demographic survey of Bangladesh, (NHDSBD) (2011): Health, Population and Nutrition Sector Development Program, Bangladesh.