Abstract
Nanoparticles are characterized by size (<50 nm) and high energy. Therefore, the aim of this investigation was to determine the effect of electrical conductivity of the Martian Regolith Simulant (MRS) under UV radiation in relation to production of nanoparticles. Results showed good correlation between MRS smaller particle size and higher energy parameter such as charge, as demonstrated by computational modeling. These experimental laboratory results allow us to understand the potential of the MRS as a good source of nanoparticles.
Key words
martian regolith simulant, nanoparticle, electro-conductivity, micronize, neuronal network computational modeling
Introduction
Man has long been observing the effect of electricity in nature [1]. However, it took millennia before we were able to systematically use electricity [2]. An electrolysis system is an effective way to systematically use electricity under controlled experimental conditions [3,4]. In general, the sizes of nanoparticles span the range between 1 and 100 nm. Metallic nanoparticles have different physical and chemical properties from bulk metals (i.e., lower melting points, higher specific surface areas, specific optical properties, mechanical strengths, and specific magnetizations) properties that might prove attractive in various industrial applications. However, how a nanoparticle is viewed and defined depends very much on the specific application [5] and on its electro-conductivity [6].
When nanoparticles are used in optical applications, simplification of the size distribution of the particles becomes important. Therefore, it is desirable to fabricate nanoparticles with a single target size in mind. Generally, in order to prepare mono-disperse or uniform nanoparticles, it is imperative that the nanoparticles grow very slowly after the rapid generation of the seed particles. If the size of nanoparticles decreases, surface area to volume ratio increases. The increase in the surface energy of such nanoparticles will facilitate their aggregation. Consequently, after the growth of nanoparticles to the desired size, it is necessary to stabilize the particulate surface by addition of a dispersing agent [5]. However, regardless of the application of nanoparticles, they all must exhibit high-energy capacity. Most nanoparticles are developed using a Faradaic approach or using electro-chemical processes [2]. The approach can vary according the application. However, despite the great expansion of nanotechnology, information on non-Faradaic approaches is scant.
Here we describe the use of electrolysis cells interfacing with galvanometers, which allow an accurate monitoring system for measuring energy flow in order to quantify voltage and charge within the electrolysis system (Pictures 2 and 3). Our system uses electro sensors linked to an intelligent computer system [4]. This provides an ideal simulation environment for studying electrochemical interactions and for detecting electrical effects in a matrix or substrate. Every physical particle including micro and nanoparticles contains some kind of energy, which is mediated by protons and electrons [7]. Charge (Coulomb or C) is the amount of energy carried or transmitted in one second by a current of one Ampere [6]. Physical material such soil is made of charged particles, which enable the soil to be a good electro-conductive medium. However, the electro-conductivity of soil depends on different factors including type of soil (i.e. organic or inorganic), concentration of mineral ions, types of mineral ions, rate of oxidation-reduction, types of surface, surface to volume ratio, surface area, and uniformity of the particles [8] as well as other factors such as paramagnetism [9].
Mars contains iron-rich minerals. Further, it has an atmosphere with abundant UV radiation;10 thus, its soil may be a good source of protons and electrons and, consequently, may be high in energy levels. Previous investigations by other researchers and NASA reports of space missions to Mars have confirmed the high amount of iron on the surface, a high influx of UV light, and the absence of oxygen in the atmosphere of Mars [10-13]. UV radiation can induce charges on the surface of the planet [14,15]. Therefore, electrolysis cells and electro sensors are ideal for studies of the kinetics of metal oxidation-reduction and can provide insight into the development of the proton circuit, [16] which is related to electrical charge (C).
UV radiation likely mediates oxidation-reduction cycles of metals such as iron on the surface of Mars [17] Photochemical reactions have been suggested to occur in the Martian environment, since CO2 is the primary constituent of the Martian atmosphere [18]. Thus, generation of protons and electrons may be constant over the surface of Mars. Many iron-rich minerals including magnetite and kamacite are ferromagnetic, while others such as troilite and hematite are antiferromagnetic [19]. Iron-rich minerals are common on Earth [9] and in Martian soils [20]. Based on the gas composition of Mars, some photochemical models of its atmosphere have been designed [21] Presence of UV photons and electric current contribute to the oxidation-reduction process of Fe2+ and Fe3+. The range depends on the valence state of iron. The oxidation process increases charge levels in the particles. In the presence of dissolved ferrous ions, UV light may lead to photo-reduction of iron more readily than photo-oxidation [15]. Iron is a good electrical conductor; its electrons generate transmembrane potentials in our electrolysis cell, which forces protons through charged membranes against their electrostatic and chemical potentials [7]. A change in pH results from the oxidation-reduction of the iron in the electrolysis cells. However, in the presence of UV light, the change of pH may cause shifting of the redox potential. UV light can play the role of an oxidizing agent in the electrochemical system used in our investigation. Therefore, it induces generation of protons and electrons in the electrolysis system where the MRS particles are the substrate.
Construction of nanoparticles from a heterogeneous substrate requires taking into consideration many different factors related to electro-conductivity, as well as the physical-chemical characteristics of the substrate. Therefore, in this type of study, the use of statistical analysis coupled with computational modeling can assist in the analysis of the experimental results. While conventional statistical analysis can predict the results of related variables, computational modeling can complement statistical results by even comparing non-related variables [22,23].
Materials and methods
The present research work was carried out by the Main Author at Prairie View A&M University, CARC, Prairie View, Texas USA.
Protocol:
1. Production of different sizes of MRS particles
-Different sizes of MRS (Picture 1) particles were used during the denoted investigation. These particles were micronized by Sturtevant Inc. Company (MA, USA), following a procedure developed at Sturtevant. The Sturtevant 4” Micronizer was used to pulverize powders to low and sub-micron sizes through particle-on-particle impact using centrifugal forces and retention time as classifying functions. The micronizer contains no moving parts and has replaceable liners to minimize wear, contamination, and stickiness. One compressed air inlet pneumatically conveys the feed material into the micronizer chamber through and educator and one compressed air inlet supplies the grinding energy through a series of tangential grinding jets.
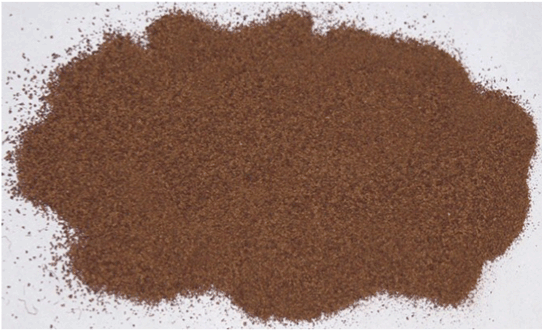
Picture 1. Martian simulant soil JSC-Mars-1. Type of Soil Matrix Used: Martian Regolith Simulant JSC-Mars-1 (MRS). This matrix is a composition of varied minerals and ions including iron, pyrites, silicates, and many other highly energetic minerals.24, 25 This matrix was micronized to produce samples of different sizes used during the present investigation.
-A volumetric screw feeder accurately meters the feed material into the micronizer funnel and a duct. The material feed rate also controls the fineness of the product by setting the resident time in the micronizer. Higher feed rates result in coarser product particle sizes, while lower feed rates result in fine product particle sizes.
-For batch operations, the micronized product and the air that carries it is converted into a loose air filter bag composed of two bags. The upper bag filters the air before it is exhausted into the room. The lower exhaust bag collects the micronized product. The upper bag is periodically shaken manually to loosen particles lodged in the pores of the fabric. For continuous production operations, the micronized product is collected in a self-cleaning process dust collector.
-The following equipment was used for analysis:
- Malvern Laser Analyzer (dry and wet) for ultrafine particle size
- Minox Air Jet Sieve for fine particle size
- RoTap Screener for coarse particle size
- Wet Wash Screening for particle size
- Scotts Volumetric Cube for bulk density
2. Ultraviolet irradiation of martian regolith simulant
-MRS was exposed to short wave (254-288 nm) UV radiation. UV irradiation was carried out before or after subjecting the MRS to electrical current, as described below. However, the UV radiation before the application of electrical current was preferable, and the results presented here reflect this sequence of steps. Single thin layers of MRS samples were exposed to UV irradiation for 4-7 days. The exposure of the MRS samples to UV radiation was done inside a tightly closed environmental chamber (Percival, USA), thus preventing penetration of any other source of light different from the UV light inside the closed environment. [24,25].
-Studies were carried out, at room temperature. Following irradiation, the UV-irradiated MRS samples were used in the electrolysis cell, as described below.
3. Electrical treatment and electro-conductivity of MRS in electrolysis cells
-The electrochemical experiments were performed using Plexiglas electrolysis cells (254 mm × 254 mm × 102 mm) (Picture 3) that allow transmission of either 280 nm or 360 nm UV light. This electrolysis cell system was operated by a measurement control interface (MCI), which was designed, constructed, and set-up by DANTECH Process Instrumentation, Johannesburg, SA, and it was used according procedures by Harvey and Crundwell, (1997) [26] and operated at 40mA and approximately 900 mV in order to overcome the difficulties encountered by previous researchers in which concentrations of ferric and ferrous ions varied markedly during the experiment due to inconsistent flow of electrolytic current [3]. Lack of such control causes difficulties in comparing results from different experiments. The electrolysis cell system used in the present investigation maintains constant concentrations of ferric and ferrous ions throughout the experiment by adjusting a variable resistor [3,4].
-Martian Regolith Simulant JSC-Mars-1[24] (Picture 1) was provided by the late Dr. David S. McKay, former NASA-JSC-Houston Scientist, and it was used throughout the investigation. Samples of the original MRS were subjected to a grinding process in order to produce different particle sizes ranging from 166 to 2.10 μm. In each experiment, 300 g of MRS was used in the electrolysis cells. Prior to each experiment, the regolith simulant was sterilized in an oven at 600°C for four days to eliminate organic material then autoclaved for two hours.
-The electrolysis cell was divided into anode and cathode by a cationic semi-permeable membrane (Sybrone Chemicals Inc., NJ, USA). Each cell was connected to an overhead stirrer. The total working volume of the cells on each side (cathode or anode) was 2000 mL. A three-to-one ratio of ferrous + ferric solution at 100 μg/L concentration was used and mixed with MRS (1700 mL ferrous + ferric solution and 300 g of Martian simulant soil); pH was adjusted to lie between 1.6 and 2.0. The adjacent compartments (also 2000 mL) were filled with only Fe2+ or Fe3+ solution at 1 ppm.
-The electrolysis cells were covered by a lid with ports through which different electro-sensors (measurement, reference, pH, oxygen, and temperature) were inserted to determine changes of redox potential, flow of fluid current, electron generation, pH, O2 concentration, and temperature. Picture 2 shows the schematic of the cells, sensors and MCI control system and Picture 3 shows the actual physical arrangement of the electrolysis cells.
-The soil slurries were kept for five days under micro-aerobic conditions at room temperature and under UV light (280 nm). The micro-aerobic conditions of the electrolysis cells were maintained by pumping mixed CO2 (97.3%) and nitrogen (2.7%) through the slurries, thus creating an anaerobic environment similar to the atmospheric composition of Mars [10].
-The MCI system was linked to a computer in order to record data and to control the redox potential26 voltage, Amperage, charge, and current. The MCI system was operated at 40 mA and approximately 900 mV. The redox potential was controlled within 0.1% of the set point for the period of each experiment. Redox potential measurements were determined using a platinum electrode and an Ag-AgCl reference electrode using a high-impedance galvanically isolated differential amplifier and an analog-to-digital control card. The computer recorded the values of the output signals from the PC card to the relay switch and to the variable resistor. The flow of current was regulated by adjusting the variable resistor, thus maintaining the redox potential in the working compartment at the set-point value. The current was measured by determining the potential difference across a precision resistor.
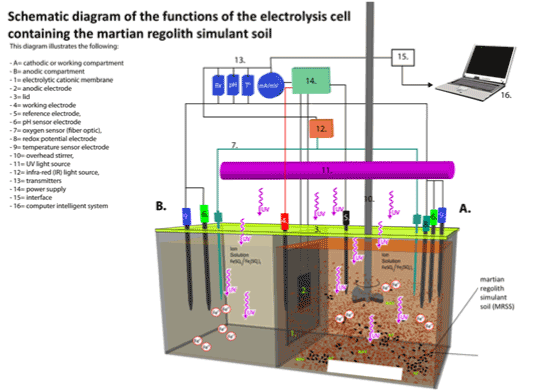
Picture 2. Schematic Diagram of Experimental Electrolysis To Study The MRS electro-conductivity, under UV radiation, connected to the Computer MCI System with software for system operation and/or functions, data processing and analysis. The electrolysis cell under UV radiation is placed inside of a canopy-like structure (120 X 100 X 100 Cm) made of plexiglass to prevent passage of light into or out of the electrolysis cell. The electrical system including power supply, and the MCI system, and the computer system are located outside the canopy-like structure.
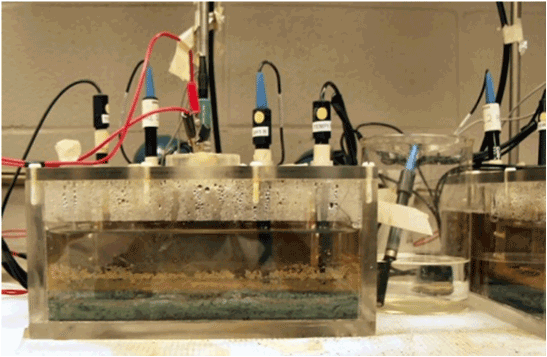
Picture 3. Actual physical arrangement of electrolysis cell with constant input voltage. Any observed voltage change must be caused by the electro-conductivity through the MRS. The photo also shows the electrosensor’s reference electrode and measurement electrode inserted through the lid of the electrolysis cell. The plexiglass electrolysis cell was designed (254 X 254 X 102 mm) to allow transmission of UV radiation 280 nm or 360 nm).
-Parameters were measured with electro-sensors (Metrohm, Brinkmann, NJ). Electro-conductivity, redox potential, and oxygen levels were monitored using a fiber-optic sensor with a FOXY probe connected to a fluorescent (200 – 850 nm) spectrophotometer (Ocean Optics, Dunedin, FL, USA). Iron concentration (Fe2+ and Fe3+) and pH were measured with a voltmeter with mercury and KCl electrodes (746 VA Trace Analyzer, Metrohm, Switzerland). Each electrolysis cell was subjected to a different treatment as shown in Cuero et al. (2003) [4].
-The electrolysis cells were soaked in hydrochloric acid, rinsed with sterile water, cleaned with an ammonia-based cleaning solution (pH 10), and finally rinsed with sterile distilled water [3] before each experiment.
4. Determination of ferromagnetism
-A Phil Callahan Soil Meter (PCSM) (Strong; ME, USA) [9] was used to measure ferromagnetism, based on a metric system unit, micron × centimeter × gram × second (µcgs) after an applied magnetic force, based on 106 units (µ). The PCSM is a hand-held meter, which functions as a paramagnetic count soil meter. The PCSM is designed around two coil chamber principle. The two chamber system is based on the fact that both chambers are filled with atmospheric air, therefore any soil sample or rock added to the sample chamber will unbalance the impedance match (XL × XC = 0), thus the unbalance side will read the mismatch as a figure converted on the meter to µCGS reading as described in the protocol provided by the meter manufacturer. The results are displayed on a digital display. Magnetic susceptibility is measured according to the physics handbook, in millionths of a CGS unit (centimeters grams second), micro CGS, or µCGS. Fifty grams of soil were analyzed in triplicate.
4.2) Five electrical parameters, voltage, amperage, charge, current, and paramagnetism were correlated to particle sizes, particle surface, and to particle surface-weighted/volume-weighted values. Additionally, these parameters were used to develop a statistical analysis and computational modeling using a neuronal network.
5. Sampling
5.1) In each experiment, slurry samples were taken at the beginning of the experiment and after 3-5 days of the experimental process. However, three additional 30 g quantities of slurry were removed in order to determine paramagnetism using the PCSM system as described above. Excess water from these slurry samples was squeezed out before determination of paramagnetism.
5.2) 30 g aliquots of the slurries containing Martian regolith simulant were removed at the beginning of the experiment and after the 3rd and 5th days of the experiment. Triplicate standard additions were performed automatically with a 700 Dosino to internally calibrate each analysis. The procedure provides a practical detection limit of 0.3 mg/L (ppm). Further, initial dried soil samples were analyzed for paramagnetism, charge, current, amperage, and voltage levels.
6. Statistical analysis and neuronal network computational modeling
6.1) Data from results of different types of particle size sample of Martian Regolith Simulant (MRS), previously treated under different levels of micro-current (mV/mA) and/or UV radiation as described above, were subjected to both statistical and to a neuronal network computational analysis. Different parameters including size of soil particles, types of soil surface-area, surface area-volume ratios, level of voltage (mV) and/or mili-Amperes (mA), charge (C), and ferromagnetism (μcgs). These parameters were measured for each of the different sizes of soil particles, which were used to determine the capacity of the different MRS particle sizes to conduct and/or retain energy and for potential use as nano and/or micro-particles.
7. Procedure for statistical and neuronal computational modeling
7.1) Results from laboratory experiments using different particle sizes under different regimes of electrical current and UV radiation were subjected to both statistical analysis and neuronal computational modeling. Data from three different MRS particle sizes were compared to a control MRS with the largest particle size. The effects of parameters including type of surface, weight, relationship between these two parameters, particle volume, relationship between particle surface and volume, surface-area, paramagnetism, resistance (Ohm), voltage, and charge were assessed. Table 1 shows the different experimental parameters used.
Treatment |
Sample
size |
Uniformity |
Surface weighted mean
D[3,2] (μm) |
Volume weighted Mean % |
Specific surface area m2/g |
Paramagnetism units? cgs |
Resistance 2000 Ω |
Voltage
(mV) |
Charge
( C ) |
|
Martian Soil |
144.20 |
0.833 |
8.242 |
165.214 |
0.728 |
595 |
350 |
-23.9 |
-14492 |
sample 1 |
1.98 |
0.674 |
1.182 |
2.347 |
5.08 |
39 |
260 |
-24.4 |
-19 |
sample 2 |
1.79 |
0.653 |
1.149 |
2.132 |
5.22 |
-76 |
288 |
-16.8 |
-35 |
sample 3 |
2.28 |
0.717 |
1.269 |
2.736 |
4.73 |
-29 |
397 |
-19.6 |
3240 |
Table 1. Experimentally-Determined Electro-conductivity Parameters. This table shows the different physical-morphological and electrical-conductivity parameters used to compare different MRS particle size (1.79-1.98 nm) as well as charge. The small MRS particle size (2.28 nm), which represents an intermediate particle size between the large and the very small particle size, had the highest charge (3,240). Voltage was also higher (between -16 and -19 mV) among small particles size compared to large particles (-231.9 mV). Resistance showed an inverse relationship with MRS particle size, where the smaller the MRS particle, the higher the resistance (Ω). However, the intermediate MRS particle size (2.28 nm) reversed the correlation by showing the highest resistance (321Ω) along with the large MRS particle size (144.20 nm), which was 350 Ω.
8. Determination of pearson correlation coefficient
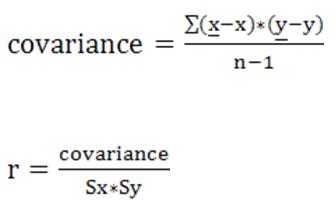
8.1) Relationships among the different variables used during the investigation were determined in order to establish the importance or effect of each variable, as well as how much each variable affects the electro-conductivity in each MRS sample in relation to the particle size of each MRS. Table 2 shows the degree of correlation of the different variables. The statistical correlation of the variables was done using the Pearson coefficient of correlation.22 The correlation coefficients were used in to assess the strengths of the relationships among different variables. The Pearson correlation coefficient was calculated, which is commonly used in linear regression [27]. Analysis of variance (ANOVA) was also performed. After calculation of the standard deviation, variance, and co-variance, the Pearson correlation coefficient was determined using the formula below:
Relationship between variables |
Pearson correlation coefficient |
Size Sample vs. Charge |
-0.980436613 |
Size Sample vs. Voltage |
-0.501577643 |
Size sample vs. Paramagnetism |
0.988611716 |
Size sample vs. specific surface area |
-0.995665833 |
Size sample vs. volume Weighted Mean % |
0.988611716 |
Size sample vs. Surface |
0.9999326 |
Uniformity vs. Surface weighted |
0.948144224 |
Table 2. Pearson correlation coefficients for different variables used during the investigation. The table shows the correlations among different particle sizes of the MRS and several different variables using Pearson correlation coefficients. The main electro-conductive parameter (charge) showed good correlation (r=-0.98) with particle size. The negative value indicates that smaller particle sizes result in higher charge (energy level). Although voltage is equivalent to energy transmission, it only showed approximately 50% correlation with particle size. Other parameters including paramagnetism, surface area, surface weighted, and volume weighted showed high correlations (r=0.94 - 0.99). Uniformity of the soil particles was not included, because it did not show even a minimum relationship with particle size; it only showed high correlation with surface weighted.
9. Neuronal network computational modeling
9.1) A neuronal network computational model was implemented in order to identify the MRS particle size, which exhibits the highest electro-conductivity or generates the most energy in the MR matrix. The neuronal computational model was developed according to an established procedure.22, 23
9.2) The computational modeling system was constructed based on experimental data (Table 1) and also using data generated by statistical analysis as described above. The following steps were implemented:
- Standardization of data.
- Definition of the amount of input and output layers.
- Definition of a vector that represents the hidden layers of the model.
- Definition of an activation function.
- Definition of the number of training cycles.
- Training of the model using back-propagation algorithm 2.
- Use of different variables as input for the model in order to obtain training error. The model is then evaluated based on each input variable or parameter.
9.3) Identification of the variables that yield the highest error. The variable yielding the highest error is the identified as the one with the strongest effect in the analysis or evaluation of results. Thus, the importance of variables was determined as follows:
- Determination of maximum and minimum values followed by normalization of values to be between zero and one.
- Selection of vectors: An 8 unit double type vector was used for the model. A 1 unit double type vector was used for output, which represented charge. For hidden layer, a vector size 10×3 unit of double type was selected.
- A sigmoidal activation function was selected.
9.4) Number of training cycles: 10,000 cycles were performed to obtain 0.0000000001 error in the training data lf the model.
9.5) Train the model by using the algorithm back-propagation.
9.6) The training err2021 Copyright OAT. All rights reserv: 0.0000987. Table 3 shows evaluation of level of error of the model using each variable.
Representative results
Different MRS particle size (144.209, 1.980, 1.792, and 2.28 μm) were produced and used during the present investigation. The combined treatment of UV radiation and electrical current, on the MRS showed differential effects according to the particle size of the MRS (Figure 2- 5, and Table 1). The MRS matrix exhibited different grain uniformity according the particle size. Thus, MRS with larger particle sizes (144.209 μm) showed the largest grain uniformity (0.83), followed by the second larger particle size (2.28 μm), which showed a grain uniformity of 0.717. The smaller particle size (1.98, and 1.79 um) exhibited the smallest grain uniformities (0.653-0.674) (Figures 2- 5, and Table 2).
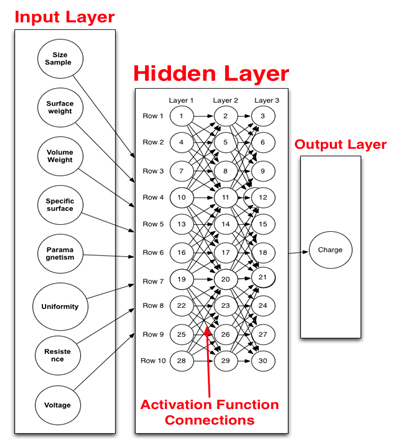
Figure 1.Graphic representation of the neuronal network computational model. This figure shows all the parameters (left column) used as input in the computational modeling, the activation functions (middle) where input information is transformed for specific output (far right) such as charge as measure of energy.
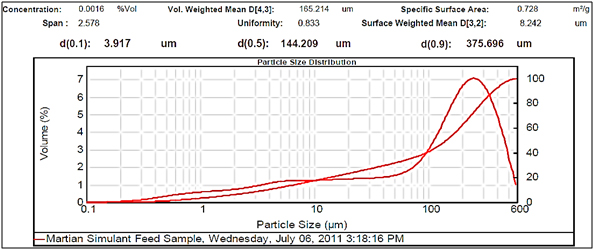
Figure 2.Large particle size.
Figure 3. Very small particle size
Figure 4.Very small particle size.
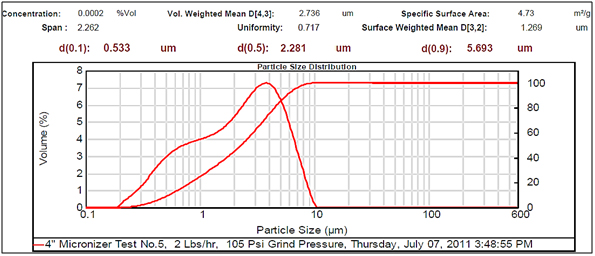
Figure 5.Small particle size.
Experimental results showed differences among the parameters selected in relation to particle sizes (Figures 2- 5, and Tables 1 and 2). There was a clear difference among the four different particle sizes: large (144.209 μm control), small (2.281 μm), very small (1.980 μm and 1.792 μm). The degree of differences among different parameters depended on the different size of the MRS particles. Thus, all small particles (1.792, 1.980, and 2.281 μm) showed marked differences in relation to control larger particle size (144.209 μm). However, there were some similarities in the results between the two very small particle size; however, there was a noticeable difference with the small (2.281 μm), which showed the highest charge, resistance, and surface area (Table 1). The smaller particle size (2.281 μm) showed the highest level of charge (3,240 C) compared to other samples of MRS with larger and very small particle sizes (144.209, 1.792, and 1.980 μm, respectively), which had negative charge values (Table 1). Likewise, resistance was higher (397 Ohm) in the small particle size (2.281 μm) and in the largest particle size (144.209 μm), which showed a resistance of 350 Ohm. The very small particle size (1.980 and 1.791 μm) had resistances in the range of 260-280 Ohms (Table 1). Surface-area to mass relationships were also higher (4.72 m2/g) with the small particle size (2.281 μm) when compared to control (large) particles (144.209 μm), which showed the lowest surface-area to mass ratio (0.73 m2/g). However, the surface-area to mass relationship of the small particle size (2.281 μm) was closer to the surface-area to mass relationship of the very small particle sizes (1.792 or 1.980 μm), which were in the range of 5.1-5.2 m2/g (Table 1).
Although, other selected parameters such as voltage, paramagnetism, surface-weighted mean, and volume-weighted mean did not differ significantly between the small particle size (2.281 μm) and the very small particle sizes (1.792 and 1.980 μm), there were marked differences between the small and control (large) particle sizes (144.209 μm), as well as between the very small particle sizes (1.792 and 1.980 μm) and the control particle size (Table 1). However, voltage values were negative for all particle sizes. The small particle size (2.281 μm) showed the least negative value (-19 mV) along with one of the very small particle sizes (1.792 μm) as compared to control particles (144.209 μm), which showed the most negative value (-23.9 mV). Paramagnetism also varied according the specific particle size. The largest particle size (144.209 μm) showed the highest paramagnetic value (595 μcgs) as compared to the small particle (2.281 μm), which was -29 μcgs, followed by one of the very small particles (1.792 μm), which had a paramagnetism of -76 μcgs. However, one of the very small (1.980 μm) particles showed the second higher paramagnetism (39 μcgs) (Table 1). Other selected parameters such as surface-weighted mean and volume-weighted mean showed differences between the small particles and the control particles. Thus, all small particles (2.281 μm) and very small particles (1.792 and 1.980 μm) had similar lower surface-weighted values (1.1-1.2 μm) as compared to control particles (144.209 μm), which had a surface-weighted value of 8.2 μm (Table 1). Likewise, volume-weighted values were different between small particles and control particles size; however, there was not a significant difference between small and very small particles. Thus, small particles (2.281 μm) and very small particles (1.792 and 1.980 μm) showed similar low values (2.1-2.7%) as compared to control particles (165.2%) (Figures 2- 5, and Table 1).
Other parameters examined included soil morphological uniformity, surface-weighted, volume-weighted, and specific surface-area, which showed different correlations with different particle sizes of the MRS (Table 1). Thus, the uniformity of the soil was indirectly correlated with charge, where the smaller the soil particle size resulted in a higher charge. However, soil uniformity was directly correlated to surface weighted, where higher soil uniformity correlated to a higher surface weighted surface area (Table 1). The relationship between soil uniformity and particle size of the MRS was direct, so large particle size MRS (144 nm) showed higher uniformity (8.2), as compared to small particle size MRS which showed lower uniformity (1.1-1.2) (Table 1).The relationship between particle size and surface area was higher between smallest particle sizes (1.79-2.28 nm) and the surface area, which was between 4 and 5 m2/g, as compared to larger particles (144 nm), which was 0.7 m2/g (Table 1). Other parameters such as volume weighted surface area were higher (165%) for the large particles (144 nm) compared to smaller particles (1.79-2.28), with lower volume weighted surface areas of 2.1-2.3% (Table 1).
Discussion
Our investigation demonstrated that the MRS is a good substrate to be used as a source of nanomaterial. Although the particle sizes of the MRS used were larger than the conventional nanoparticle size of 50 nm, they still exhibited electro-physical characteristics and/or behavior of nanoparticles as these properties relate to energy conductivity. Thus, as the MRS particle size becomes smaller, MRS particles generate more energy as measured by the amount of charge (C). This is one of the characteristics of a nanoparticle [28,29] Charge (Coulomb) is an important measurement unit, which is capable of transporting one Ampere in one second. Charge is mainly a property of protons and electrons; both have the same magnitude of electrical charge but different signs [6]. Thus, protons and electrons are the main energy carriers in most nanoparticles. However, the energy levels and/or electrical charges of nanoparticles may also depend on the types of matrices or constituencies of the nanoparticle material. Other authors have also reported efficacy of nanoparticles by determining the Z potential [30] which is another way to determine the level of charge (C). The relationship between the particle size of the MRS and the amount of charge is corroborated by the results of the Pearson correlation coefficient, in which the correlation between particle size and charge was high (r= -0.98) (Table 2). Although the value is negative, this indicates that the correlation is approaching -1. Voltage that was opposite to charge showed a lower degree of negative correlation (r=-0.50) (Table 2) [6].
Other parameters related to the physical characteristics of the MRS such as paramagnetism, surface-weighted, surface-area, and volume-weighted, showed positive high correlations (r= 0.90 – 0.98) with particle size of the MRS. The physical-chemical composition of the matrix or substrate also determine the movement of protons and electrons through itself [31]. Consequently, the matrix composition can influence the electrical charge of the substrate and/or particles. When the substrate is made of heterogeneous particle materials, the degree of interference is higher and can lead to inhibition. Thus, this will reduce expression of the charge (C) compared to homogenous nanoparticles in which charge expression is not subject to interference, therefore showing higher charge levels.
One of the best ways to express the electrical charge is through a mathematical vector system. The value of a charge of any nanoparticle can be smaller than any portion of the particle because charges can nullify each other, especially in larger and/or heterogeneous matrices or substrates compared to nanoparticles that are more homogeneous [6]. This could explain the charge differences according the particle size of the MRS. The MRS is a composition mainly made of combination of different metal ions including high concentrations of Fe2+ and Fe3+, Zn2+, Cu2+ and Cu3+, Al3+, Ca2+, Si, and many other elements [24,25]. The heterogeneous composition of metal ions of the MRS may reduce the charge of the large particles (144.209 μm) compared to the smaller size particles (1.79, 1.98, and 2.28 μm). This could be explained based on the homogeneous composition of the smaller particles in which the charges are not nullified by each other and can form a unidirectional vectorial plane, as describe above.6 Even though the small particles of the MRS were not within the range of <50 nm, they still showed both the electrical conductivity tendencies and behaviors of nanoparticles. Therefore, further micronizing of the MRS towards nano-size can be attempted and should result in maintenance of the electro-conductivities shown above (Tables 1 and 2). The particle size of the MRS was not further minimized in our experiments due to the limitation of the micronizing technique in relation to the type of MRS used. It is possible that the use of an MRS with different compositions would be easier to micronize to 50 nm.
Other parameters such as surface weighted, volume weighted, and surface-area relationship showed high correlations within MRS particle size (Tables 1 and 2). The specific surface of the substrate including particulate material such as soil influences the electro-conductivity of the diffuse layer of the substrate [8,31] Uniformity of the particles was the only parameter that did not show any direct correlation with particle size, although it exhibited good correlation with surface-area (Tables 1 and 2). This could be corroboration that the composition (i.e. metal ions) of the MRS matrix is more important than the uniformity of its particles. In fact, all particle sizes of the MRS showed a similar uniformity value (Table 1).
The importance and effect of a single variable or several variables has on other variables were identified using the neuronal computational modeling, which is important since the MRS is a matrix composed of several elements that interact with each other. Table 3 shows resistance as the variable with the strongest influence (error evaluation = 0.70) followed by voltage (error evaluation = 0.50). However, the values generated by resistance and voltage were not enough to have a marked effect on the other variables. The higher values of resistance and voltage confirm the importance of charge, as described above, since charge, which is the main variable expressing the energy of the nanoparticles of the MRS, is related to resistance and voltage [6]. Nevertheless, all other variables showed similar error evaluation (approximately 0.1), which indicates that these variables did not generate error in the data set of the model. Thus, they are the most important variables to consider [23]. This proves the importance of the appropriate selection of variables as input and the output variable such as charge (Figure 1).
The results of our investigation also demonstrate that the method used to investigate the induction of higher energy in the MRS micro-particles is effective. The UV photons and/or the electric current must have induced the reduction of iron species and increased the concentration of iron, which is prevalent in the MRS [24,25]. Electrical current can produce electrons [7] thus inducing movement of charge and consequently generate higher energy in the MRS micro-particles.
The level of electrical current used in the present investigation may induce formation of oxidants (electron acceptors) stimulating iron oxidation-reduction, [32] and, consequently, generation of proton and electrons. This could be due to the interaction between the UV photon and the iron containing minerals in the MRS, which produces H+ (protons) and triggers iron redox and higher charge. Iron is present at high concentrations in the electrolysis cells, and the presence of UV light and electrical current may have increased oxidation-reduction of the iron, which increases the level of energy of the MRS particles. The UV effect on the regolith and on the solution may be explained by the surface-mediated light-controlled Friedericksz transition effect. Light induces modulation of electric charges in a liquid current, as well as strong reorientation of the liquid current due to the field extending into the bulk [14] matrix.
The experimental results of the present investigation show the planet Mars as a great potential source of nanoparticles due to the great presence of both UV radiation and high concentrations of iron and other metal ions. The interaction of UV photons with iron ions (photo-Fenton reaction) constantly induces H+ release. This will, in turn, generate high energy particulate material. Furthermore, in addition to having similar types of minerals and ions as contained in the MRS, Martian soil may possess other types of minerals and ions, perhaps also in different valence states. This may contribute to a greater electro-conductivity in the particulate material of the surface of the Mars. Martian soil can be an energy sink due to the planet’s atmospheric conditions, which exhibit strong photochemical phenomena. Consequently, Martian soil could be a great substrate to harbor high energy electrical charge. The atmospheric conditions of Mars have been used to design different types of photochemical models [21] for determining the abundance of OH radicals. This model also discovered a relationship among abundances of CO, O2, O3, and molecular hydrogen. These results suggest a constant flux of high energy electrical charges (i.e., protons, electrons, and other particles) in Martian soil.
Conclusions
The present results demonstrate: 1) The application of electrical current along with short wave UV radiation with the use of electrolysis cells having electro-sensors is ideal for performing realistic experiments for constructing higher energy micro and/or nanoparticles. The nanoparticles must have a good surface-area relationship and exhibit high strength during the process of micro-sizing and/or nano-sizing. 2) MRS is a good experimental substrate to simulate studies to demonstrate the potential of Martian soil for construction of nanoparticles. 3) Mars can be a source of nanoparticles. Additional studies at the atomic level under similar and new conditions are needed in order to obtain a more comprehensive understanding of the electrical current and UV interaction as well as the geophysical and geochemical effects on the formation of the nano-particles on Mars as well as Earth.
Acknowledgments
This research was supported by a grant from the NASA Lyndon B. Johnson Space Center-Houston (NASA Grant # NAG-1241), and from CARC- Praire View A&M University- Evans Allen Fund. The Main Author thanks the late Dr. David S. McKay, former Scientist from NASA JSC-Houston for his valuable technical contribution, and for providing the MRS, Dr. Eustace Duffus for his effective laboratory technical assistance, Mr. John H. Trujillo, Computational Eng., for his assistance on the statistical and computational modeling, and to Dr. Larry Villanueva for reviewing the manuscript.
References
- Edmonds DT (2001) Electricity and Magnetism in Biological Systems. Oxford University Press.
- Ramsden JJ (2009) Applied Nanotechnology Elsevier Inc USA.
- Fowler T, Crundwell F (1999) Leaching of Zinc Sulfide by Thiobacillus Ferrooxidans: Bacterial Oxidation of the Sulfur Product Layer Increases the Rate of Zinc Sulfide Dissolution at High Concentrations of Ferrous Ions. Applied and Environmental Microbiology 65: 5285-5292.
- Cuero R, McKay DS, Ellis A (2003) Autotrophic Bacteria as the Interface between Inorganic and Organic (abstract). In American Society for Microbiology 103rd General Meeting.
- Horikoshi S, Serpone N (2013) Microwaves in Nanoparticle Synthesis: Fundamentals and applications (1stedn). Wiley-VCH Verlag GmbH & Co. KGaA Weinheim, Germany.
- Eisberg R, Resnick R (1985) Quantum Physics of Atoms, Molecules, Solids, Nuclei, and Particles. John Wiley & Sons Inc USA.
- Freund F (1981) Proton Highlife and Midway Tunneling. Trends in Biochemical Sciences 6:142-145.
- Griso R, Wysor M, Holshouser D, Thomason W (2009) Precision Farming Tools: Soil Electrical Conductivity. Virginia Cooperative Extension publication 442-508.
- Callahan P(1984) Ancient Mysteries Modern Visions: The Magnetic Life of Agriculture Acres USA.
- Arny T (1998) Explorations: an Introduction to Astronomy (2ndedn). The McGraw-Hill Companies Inc Boston.
- Hartman H, McKay CP (1995) Oxygenic photosynthesis and the oxidation state of Mars. Planet Space Sci 43: 123-128. [Crossref]
- McKay DS, Gibson EK Jr, Thomas-Keprta KL, Vali H, Romanek CS, et al. (1996) Search for past life on Mars: possible relic biogenic activity in martian meteorite ALH84001. Science 273: 924-930. [Crossref]
- Weiss BP, Yung YL, Nealson KH (2000) Atmospheric energy for subsurface life on Mars? Proc Natl Acad Sci U S A 97: 1395-1399. [Crossref]
- Boichuk V, Kucheev S, Parka J, Reshetnyak V, Resnikov Y, et al. (2001) Surface-Mediated Light-Controlled Friedericsz Transition in a Nematic Liquid Crystal Cell. Journal of Applied Physics 90: 5963-5967.
- Cuero R, McKay DS (2013) Induction and construct UV protective yeast plasmid. J Biotechnol 166: 76-83. [Crossref]
- Crundwell FK (1997) The Kinetics of the Chemiosmotic Proton Circuit of the Iron-Oxidizing Bacterium Thiobacillus ferrooxidans. Bioelectrochemistry and Bioenergetics 43: 115-122.
- De Duve C (1995) Vital Dust: Life as a Cosmic Imperative. Basic Books New York.
- Owen T, Biemann DR, Rushneck JE, Biller DW, Howarth A L. et al, (1977) The Composition of the Atmosphere at the Surface of Mars. Journal of Geophysical Research 82: 4635-4639.
- Coey JM, Venkatesan M, Fitzgerald CB, Douvalis AP, Sanders IS (2002) Ferromagnetism of a graphite nodule from the Canyon Diablo meteorite. Nature 420: 156-159. [Crossref]
- Arny T (2002) Explorations: an Introduction to Astronomy (3rdedn). The McGraw-Hill Companies Inc New York.
- Nair H, Allen M, Anbar AD, Yung YL, Clancy RT (1994) A photochemical model of the martian atmosphere. Icarus 111: 124-150. [Crossref]
- Jeong DH, Ziemkiewicz C, Ribarsky W, Chang R (2009) Understanding Principal Component Analysis Using a Visual Analytics Tool. Charlotte Visualization Center UNC Charlotte.
- Heaton J (2008) Introduction to Neural Networks for Java, (2nd edn) Heaton Research Inc, Chesterfield, Missouri, USA.
- Allen CC, Griffin C, Steele A, Wainwright N, Stansberry E (2000) Microbial Life in Martian Regolith Simulant JSC Mars-1. Abstract 1287. In 33rd Lunar and Planetary Science Conference Abstracts, Lunar and Planetary Institute, Houston.
- Cuero R, McKay DS (2007) Composition and Methods to Remove Toxic Metals and Radionuclide. U.S. Patent # 7.309.437 B2.
- Harvey PI, Crundwell FK (1997) Growth of Thiobacillus ferrooxidans: a Novel Experimental Design for Batch Growth and Bacterial Leaching Studies. Applied and Environmental Microbiology 63: 2586-2592.
- Fox J (2008) Applied Regression Analysis and Generalized Linear Models, Sage Publications Inc USA.
- Fleischman M, Ghoroghchian J, Roliso D, Pons S (1986) Electrochemical behavior of dispersions of spherical of ultra-micro electrodes J Phys. Chem 90: 6392.
- Brito PJ, Santhanam KSV, Ajayan PM (1996) Carbon Nanotube Electrode for Oxidation of dopamine. Bioelectrochemistry and Bioenergetics 41: 121.
- Win KY, Feng SS (2005) Effects of particle size and surface coating on cellular uptake of polymeric nanoparticles for oral delivery of anticancer drugs. Biomaterials 26: 2713-2722. [Crossref]
- Rinaldi VA, Cuestas GA (2003) Ohmic Conductivity of a Compacted Silty Clay. Journal of Geotechnical and Geo Environmental Engineering 128: 824-835.
- Cuero R, McKay DS, Lilly J (2012) Constructed molecular sensor to enhance metal detection by bacterial ribosomal switch-ion channel protein interaction. Journal of Biotechnology (Elsevier) 158: 1-7.