Abstract
Molecular weight will not only affect cytotoxicity, viscosity and other basic properties of molecules in physical and chemical fields, but also influence its efficiency of drug delivery in nanomaterial fields. It is of great importance to measure the molecular weight of a substance. In this study, we proposed a new method to directly determine the molecular weights of polymers with linear and repeated molecular structures. An empirical molecular weight formula of  is the basic knowledge of this new method. The parameters of the repeated molecular unit weight (Mo) and (Lo) can be calculated according to the polymer’s molecular formula. If the individual molecule length of Ln can be measured with the instrument of Atomic Force Microscopy (AFM), the molecular weight of W can be obtained with the parameters of Ln, Mo and Lo according to the formula of
  Chitosan with different molecular weights were chosen to value our new proposed method. Our results imply that the molecular weight of chitosan obtained with the new method is reasonable. Moreover, the distributions of molecular weight and molecular lengths can also be acquired at the same time with this novel method.
Key words
molecular weight, AFM, molecular weight distribution, molecular length, chitosan
Introduction
Molecular weight (MW), the mass of one mole of a substance, decides not only the basic properties of molecules (such as conformation [1], solubility, viscosity [2] and cytotoxicity [3]), but also the formations and strengths of their hydrogels of the molecules [1], and even the releasing rates of drugs carried by the molecules [4]. To obtain this basic information of molecules, people calculate the molecular weight with molecular formula. But this method is invalid to determine the molecular weight of polymers since they are polydisperse (consisting of species with different molecular weight), then some techniques were invented to determine the molecular weight of polymer. The common used methods include the technique of intrinsic viscosity method [5,6] depended on the Mark-Houwink and thermal coefficients, light scattering method with a light beam scattered by fluid and into a detector [7], size-exclusion chromatography (SEC) method which is independent of elution position, sedimentation analysis [8,9] based on the assumption of validity of the first and second laws of thermodynamics, and also Gel permeation chromatography method(GPC) [10,11] used to determine the polydispersity index and the viscosity molecular weight of polymer. Another method has been reported to calculate the molecular weight with the techniques of Langmur-Blodget [12] and Atomic Force Microscopy (AFM) [13], where the solution concentration, the volume, transfer area and some other parameters are needed.
In this study, we proposed a simple novel method which can be used to determine the molecular weight of some linear molecules of polymer directly, which means the molecular weight could be obtained without some empirical parameters. As a successful example, the molecular weights of two kinds of chitosan were measured with the imaging function of AFM, and it was found that the molecular weight obtained in our experiment agreed well with that got by former method of Gel Permeation Chromatography [14] as expected.
Principle and Method
The principle of this novel directly determining the molecular weight method based on the knowledge of the empirical formula of  where M is the relative molecular weight, Ln length is the length of an individual filament, Lo is the length of a monomer or a repeating unit of the polymer and Mo is the molecular weight of the monomer or the repeating unit. Since Lo and Mo can be calculated from the molecular formula of the polymer, the relative molecular weight M can be calculated if you get the length value of Ln.
To get the data of Ln, four steps of work should be done in this novel method of directly determining the molecular weight. 1) Prepare some samples with filament structure of polymer on substrate. In order to get the filament structure of polymer, a solution of certain concentration should be prepared (the concentration should be low enough to form filament structure of the polymer) first, then drop several micro litter of the solution on substrate surface and dry it if you wish to image it in air. 2) Image the filament structure with AFM. As an analyses tool, imaging is the basic function of AFM. One can select tapping mode, magnetic mode or contact mode to obtain the topography images of the polymer filaments in air or in liquid. Generally speaking, the more filaments you get, the more precise molecular weight you will obtain. 3) Measure the length (Ln) of all the filaments. Some software can be used to help you to measure the length of the filaments, example as the commercial software of Scanning Probe Image Processor or other software supported by the manufacturers of AFM. Statistical length values including the length distribution of the filaments can also be calculated with the data of individual length values. 4) Calculate relative molecular weight (W) of the polymer with the empirical formula of M=Mo*Ln/Lo. Since the unit molecular weight of Mo and the unit molecular length of Lo can be obtained from the molecular formula of the polymer as introduced in the beginning of the principle, the relative molecular weight W is easy to be calculated out. With the relative molecular weight W of every filament, the statistical molecular weight values including the molecular weight distribution of the filaments can be obtained.
Experimental section
Chitosan: Chitin is mainly extracted from the skeletal materials of crustaceans by acid treatment [15, 16]. chitosan, the fully or partially N-deacetylated derivative of chitin with a typical degree of acetylation of less than 0.35 [17], is known to consist of 2-acetamido-2-deoxy-β-D-glucose through a linkage of β(1→4). The high percentage of nitrogen (6.89%) makes chitin and chitosan are of commercial interest [18]. Chitosan is highly hydrophobic and is insoluble in water and most organic solvents, but it is soluble in dilute acids [17], exampled as acetic acid and formic acid aqueous solutions. This natural polymer have much more better properties than that of synthetic polymers materials [17], such as biocompatibility, biodegradability, non-toxicity, adsorption properties, etc. These excellent properties made chitin and chitosan not only as absorbable sutures, wound-dressing materials in medical field, but also as materials for wastewater treatment in water engineering [18,19], which has appealed much more enthusiasms of researchers.
Chitosan is a natural cationic polysaccharide with a large molecular weight range. Materials with different molecular weight of chitosan have different properties, Such as the antibacterial properties, permeation resistance [20,21], the rate of drug loading and releasing [22], drug delivery efficiency [23], pollutant removal properties [24]. So the measurement of chitosan molecular weight is of great importance. The repeated molecular structure of chitosan makes it possible for us to put forward this novel method to directly determine its molecular weight. The structure of chitosan includes the acetylated part and the deacetylated part, and a molecular structure of chitosan repeated monomer unit is exhibited in Figure 2. Where the left part is β-(1−4)-linked 2-amino-2-deoxy-D-glucopyranose unit representing the degree of acetylation (DA) of chitosan, and the right is the deacetylated result of the left part representing the degree of deacetylation (DD, DD can be measured by method of first derivative ultraviolet spectrophotometry [25,26] ). The relative molecular weight of the left part and right part of chitosan repeated monomer are 203.2 and 161.2 respectively [27], then the average molecular weight (Mo) of the monomer was calculated by the formula of 161.2 (DD) + 203.2 (1-DD). The length of a monomer chitosan unit has been reported as about 0.52 nm [27]. Considering the formula of M=Mo*Ln/Lo, the individual filament length of Ln is needed to calculate the molecular weight of chitosan. From the experimental point of view, chitosan molecules can be exhibited in some filaments or fibers form(elongated single strands) [28], then the individual length of the filament Ln can be measured if we got the topography image of it.
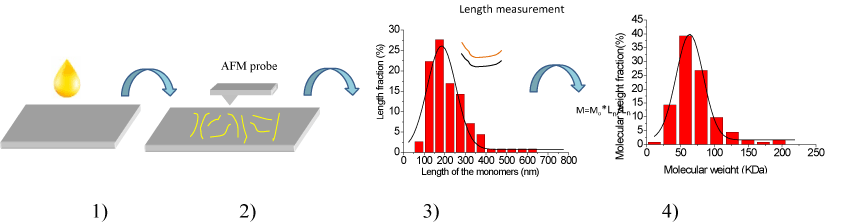
Figure 1. Principle of the novel method, and here are four steps in the new method. 1) Low concentration of sample solution should be prepared, and then dropping some solution on a substrate with smooth surface to prepare samples, 2) Imaging the sample with AFM in air or in liquid to acquire the topography images of the sample on substrate, 3) Measuring the lengths of the filaments in the AFM topography images and analyzing them. The black curve is the fitting curve of the length data. 4) Calculating the molecular weight of sample with an empirical formula. The black curve is the fitting curve of the molecular weight data.
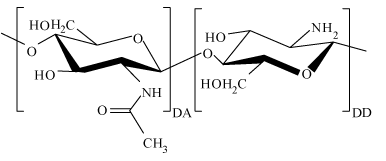
Figure 2. Molecular structure of chitosan repeated monomer unit, and this monomer structure of chitosan includes the acetylated (DA) part and the deacetylated (DD) part.
Materials and processing
Chitosan samples were all prepared from the Chitopharm® product provided by Cognis Deutschland GmbH & Co. (Düsseldorf, Germany). The low molecular weight of chitosan was obtained by treating the Chitopharm® product in two steps, the first step is treating the product with nitrous acid [29] to depolymerize and the second step is treating the product with acetic acid anhydride [30] to increase the Degree of Deacetylation (DD). Two kinds of chitosan samples were selected in our experiment, they are chitosan of high molecular weight (H-CS: MW = 126.2 kDa, DD = 84%) and chitosan of low molecular weight (L-CS: MW = 69.8 kDa, DD = 78%). The MW of all samples was verified by GPC using dextran standards. The DD of all samples was verified by first derivative ultraviolet spectrophotometry [25,26]. Acetic acid used in this experiment was purchased from HaoHua corporations, China. The purity of the acetic acid is 99.5 in percent. Sodium hydroxide with the purity of 96 in percent was purchased from Kermel Corporations, China. Deionized water with resistivity of 18.23 MΩ·cm was produced using GT-8L ion exchange system (LeiCi corporations). All substrates used in experiment were mica with freshly-cleaved surface (Ted Pella, Inc.).
Sample preparation
The same methods for samples preparation of H-CS and L-CS are described as follows: The aqueous solutions of 0.2 M CH3COOH/0.1M CH3COONa was prepared as the solvent of chitosan, and then adjusted to a pH value of 4.6 with sodium hydroxide and acetic acid aqueous solution. Chitosan was dissolved in the solvent to prepare 0.2 g/L chitosan solution. After 3 hours magnetic stirring, the chitosan solution was diluted to 0.0005 g/L by three steps. The first step was to drop 100 µL0.2 g/L chitosan solution into 900 µL acetic acid aqueous solution, and 5 minutes mechanical shaking to get the 0.02 g/L chitosan solution. The second step was similar to that of the first step, that is to say, we put 100 µL0.02 g/L chitosan solution into 900 µL acetic acid aqueous solution, and mechanical stirred it for 5 minutes to get the 0.002 g/L chitosan solution. The third diluting step was add 250 µL0.002 g/L chitosan solution to 750 µL acetic acid aqueous solution, and 5 minutes mechanical stirring to get the 0.00005 g/L chitosan solution. This low concentration ensured that some filaments structure of chitosan can be founded on substrate. The last step to prepare the chitosan sample before AFM imaging was to drop 10 μL 0.0005 g/L the new prepared chitosan solution on a freshly cleaved mica substrate immediately and air-dried 30-60 minutes. The reason why we dropping the chitosan solution on a mica surface immediately after the solution preparation is that there is no time for chitosan molecules to assemble into longer filaments or other structures. That is to say, our experiments ensured that the measured molecular lengths are their original data of the chitosan molecules before their self-assembling process. All experiments were carried out in grade 1,000 ultra-clean room condition at room temperature.
Measurements
The AFM images of morphologies for all chitosan samples were collected using a commercial AFM (Solver p47-h, NT-MDT, Moscow, Russia) with a scanner of 7130. AFM probe of RTESP-300 (Veeco, U.S.A) with rectangular cantilevers (spring constant (k) is about 40 N/m and tip curvature radius is about 8 nm) was used. Tapping mode (TM-AFM) was performed in air conditions with resonant frequency about 300 kHz and scanning frequencies of 1-2 Hz. Feedback parameters were optimized to ensure acquiring good image with minimal loading forces from the probe tip to the chitosan sample surface. AFM images with 512×512 pixels were obtained at different sample positions to acquire more filaments nanostructures of chitosan sample. In the end, all the acquired AFM topography images were analyzed and the lengths of the filaments were measured with the commercial software named Scanning Probe Image Processor (SPIPTM) (Image Metrology ApS, version 5.13, Lyngby, Denmark). All of the experiments were carried out at room temperature with the relative humidity ranging from 15% to 45%.
Results and discussions
Figure 3a shows a typical AFM topography image of H-CS chitosan in the form of filaments on mica surface obtained in our experiment, where the filaments of chitosan are in different lengths and shapes. All the filaments are not twinned with each other due to the low concentration of the chitosan solution used, which is beneficial to measuring the length of every individual filament. 114 filaments were measured and the lengths of them are distributed in figure 3 b. When the individual length value of chitosan filament LnH and the parameters of monomer H-CS (length of Lo (0.52 nm) and molecular weight MoH (161.2×0.84+203.2×0.16 DA) were considered, the molecular weight of H-CS can be calculated with the formula of 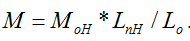 The calculated molecular weights of H-CS are described in figure 3c, and the peak value (MC-H) of their Gaussian fit curve is 109.590 ± 36.299 kDa. Comparing with the result (MH=126.2 kDa) from traditional measuring method of GPC, The range of MC-H includes the value of MH. The reasons why the molecular weight of chitosan acquired from two methods are not exactly equal to each other maybe lie in three main facts. The first one is that the DD value measured with first derivative ultraviolet spectrophotometry [25,26] might not exactly equal to its real value since different methods have different influence on the results of DD values [26]. The second reason maybe that the value of Lo estimated from the structure of chitosan molecular is not exactly equal to the monomer molecular length value used in the experimental section of AFM measurement due to the influences from thermal or other environmental parameters. The third reason could be that the sampling numbers of chitosan filaments are not enough to get a more accurate value of chitosan molecular weight. We thought it was acceptable for our measured chitosan molecular weight result since its range included the value of MH. In this sense, we concluded that MC-H was in agreement with MH, and that is to say, our new proposed method to directly determine the molecular weight of chitosan is reasonable.
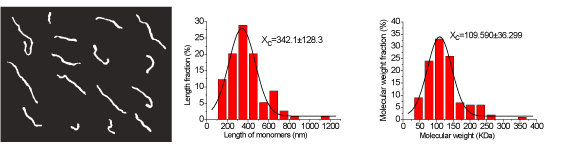
Figure 3. Experimental results of H-CS and the statistical data of H-CS molecules. a) Typical topography images of individual H-CS molecules (with the scanning area of 2,650 nm × 2,080 nm), where the molecules are in the shape of separated filaments. b) Statistical distribution of the lengths of chitosan filaments versus their percentages. The black curve is the Gaussian fit curve, and the peak value of the Gaussian curve is 342.1 ± 128.3 nm. c) Statistical distribution of the molecular weights of chitosan versus their percentages. The black curve is the Gaussian fit curve, and the peak value of the Gaussian curve is 109.590 ± 36.299 kDa.
2021 Copyright OAT. All rights reserv
Besides the molecular weight of chitosan can be obtained, the distributions of the molecular lengths and weights can also be acquired during the same experiment with this novel method. The statistical data in figure 3 b show that the lengths of the filaments (Ln) range from 100 nm to 1.2 µm, and the peak value of their Gaussian fit curve of the filaments lengths is 342.1 ± 128.3 nm. About 70% of the filaments’ lengths are in the range of 200 nm to 500 nm. Figure 3 c shows the distribution of H-CS molecular weight, where more than 70% of the chitosan molecules’ weights range from 60 kDa to 150 kDa with the maximum range of 20-300 kDa.
In order to verify our new method, the lower molecular weight of chitosan (L-CS, ML = 69.8 KDa, DD = 87%) was used to carry out the same experiments and the same data processing method with that of H-CS. Figure 4 a is a typical AFM topography image of L-CS on mica surface, where the chitosan molecules were in the form of separated filaments with different shapes as expected. We selected the same number of L-CS filaments as that of H-CS to analyses their lengths and molecular weights. That is to say, the lengths of 114 filaments were measured and analyzed in figure 4 b. The individual length value of L-CS filament Ln, the length of monomer L-CS (Lo = 0.52 nm), and molecular weight MoL (161.2×0.78+203.2×0.22 DA) were used to calculate the molecular weight of H-CS with the formula of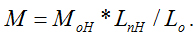 The calculated molecular weights of H-CS are described in figure 4c, and the peak value (MC-L) of their Gaussian fit curve is 63.659 ± 20.102 kDa. Comparing with the result (ML = 69.8 kDa) from the traditional method of GPC, the range of MC-L includes the value of ML. So it can be said that our determined value of MC-L agrees well with that of ML, even if these calculated molecular weights of chitosan acquired from two methods are not exactly equal to each other. The reasons for the difference between MC-L and ML maybe the same with that of the difference between MC-H and MH, which means that the value of DD, Lo and the sampling numbers of chitosan filaments will lead to the deviation between MC-L and ML. We thought it was reasonable for our measured chitosan molecular weight result of MC-L since its range included the value of ML.
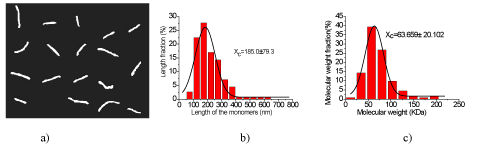
Figure 4. Experimental results of L-CS and the statistical data of L-CS molecules. a) Typical topography images of individual L-CS molecules (with the scanning area of 2,650 nm × 2,080 nm), where the molecules are in the shape of separated filaments. The black curve is the Gaussian fit curve, and the peak value of the Gaussian curve is 185.0 ± 79.3 nm. c) Statistical distribution of the molecular weights of chitosan versus their percentages. The black curve is the Gaussian fit curve, and the peak value of the Gaussian curve is 63.659 ± 20.102 kDa.
Moreover, the lengths of the L-CS filaments range from 50 nm to 650 nm according to figure 4 b, and about 80% of them belong to a small range of 100 nm to 300 nm. The average length of the L-CS filaments is 185.0 ± 79.3 nm. The statistical data of molecular weight were illustrated in figure 4c, where the molecular weights of the L-CS filaments range from 0 to 205 kDa, but more than 80% of the filaments are in the range of 25 kDa to 100 kDa.
Conclusions
We proposed a new method to directly determine the molecular weight of polymer with linear molecular structure and repeated units. The principle of the novel method was introduced firstly in this study, and then two kinds of chitosan with different molecular weights and DD were used to exam the reliability of this new method. The calculated molecular weights acquired from this method tell us that not only the range of MC-H includes the molecular weight of MH obtained from a traditional measuring method of GPC, but also the range of MC-L includes the molecular weight of ML obtained from the method of GPC. The agreements of MC-H with MH, and MC-L with ML made us draw the conclusion that our new proposed method can be used to directly determine the molecular weight of chitosan. Moreover, the AFM topography images and the distributions of chitosan can also be obtained during once experiment. Chitosan is only a representative of linear polysaccharide with repeated molecular structure, and it can be speculated that this new method can be used to determine the length, molecular weight and their distributions of all the other linear polysaccharide with repeated molecular structure, and even all the linear polymers with repeated molecular structures. Further works will be done to verify our prediction.
Acknowledgments
The authors acknowledge financial support from the National Natural Science Foundation of China (No. U1304310 and 21373077), and Henan Natural Science Research Office of Education project (No. 12A180005. and No. 2010A140001).
References
- Nowak AP, Breedveld V, Pakstis L, Ozbas B, Pine DJ, et al. (2002) Rapidly recovering hydrogel scaffolds from self-assembling diblock copolypeptide amphiphiles. Nature 417: 424-428.
- Regand A, Chowdhury Z, Tosh SM, Wolever TM, Wood P (2011) The molecular weight, solubility and viscosity of oat beta-glucan affect human glycemic response by modifying starch digestibility. Food Chemistry 129: 297-304.
- Mellati A, Kiamahalleh MV, Dai S, Bi J, Jin B, et al. (2016) Influence of polymer molecular weight on the in vitro cytotoxicity of poly (N-isopropylacrylamide). Materials Science and Engineering 59: 509-513.
- Mittal G, Sahana DK, Bhardwaj V, Kumar MR (2007) Estradiol loaded PLGA nanoparticles for oral administration: effect of polymer molecular weight and copolymer composition on release behavior in vitro and in vivo. Journal of Controlled Release 119: 77-85.
- Ci SX, Huynh TH, Louie LW, Yang A, Beals BJ, et al. (1999) Molecular mass distribution of sodium alginate by high-performance size-exclusion chromatography. J Chromatogr A 864: 199-210. [Crossref]
- Raut AS, Kalonia DS (2016) Viscosity Analysis of Dual Variable Domain Immunoglobulin Protein Solutions: Role of Size, Electroviscous Effect and Protein-Protein Interactions. Pharmaceutical Research 33: 155-166.
- Berne BJ, Pecora R (2000) Dynamic light scattering: with applications to chemistry, biology, and physics, Courier Corporation.
- Britten R, Roberts R (1960) High-resolution density gradient sedimentation analysis. Science, 131: 32-33.
- Williams JW, Van Holde KE, Baldwin RL, Fujita H (1958) The theory of sedimentation analysis. Chemical Reviews 58: 715-744.
- Balke ST, Hamielec AE, LeClair BP, Pearce SL (1969) Gel permeation chromatography. Industrial & Engineering Chemistry Product Research and Development 8: 54-57.
- Gellerstedt G (1992) Gel permeation chromatography, in Methods in lignin chemistry. Springer: 487-497.
- Roberts G (2013) Langmuir-blodgett films. Springer Science & Business Media.
- Sheiko SS, da Silva M, Shirvaniants D, LaRue I, Prokhorova S, et al. (2003) Measuring molecular weight by atomic force microscopy. J Am Chem Soc 125: 6725-6728. [Crossref]
- Liu X, Howard KA, Dong M, Andersen MØ, Rahbek UL, et al. (2007) The influence of polymeric properties on chitosan/siRNA nanoparticle formulation and gene silencing. Biomaterials 28: 1280-1288. [Crossref]
- Kumar MN, Muzzarelli RA, Muzzarelli C, Sashiwa H, Domb AJ (2004) Chitosan chemistry and pharmaceutical perspectives. Chem Rev 104: 6017-6084. [Crossref]
- Rinaudo M (2006) Chitin and chitosan: properties and applications. Progress in Polymer Science 31: 603-632.
- Kumar MNR (2000) A review of chitin and chitosan applications. Reactive And Functional Polymers 46: 1-27.
- Muzzarelli R (1997) Human enzymatic activities related to the therapeutic administration of chitin derivatives. Cellular and Molecular Life Sciences CMLS 53: 131-140.
- Kumar M, Nakamura S (1998) Methods of metal capture from wastewater. Advances in Wastewater Treatment Technologies Global Science Publishing 23-46.
- Huei CR, Hwa HD (1996) Effect of molecular weight of chitosan with the same degree of deacetylation on the thermal, mechanical, and permeability properties of the prepared membrane. Carbohydrate Polymers 29: 353-358.
- Chen XG, Zheng L, Wang Z, Lee CY, Park HJ (2002) Molecular affinity and permeability of different molecular weight chitosan membranes. J Agric Food Chem 50: 5915-5918. [Crossref]
- Genta I, Perugini P, Pavanetto F (1998) Different molecular weight chitosan microspheres: influence on drug loading and drug release. Drug Development and Industrial Pharmacy 24: 779-784.
- Köping Höggård M, Mel'nikova YS, Vårum KM, Lindman B, Artursson P (2003) Relationship between the physical shape and the efficiency of oligomeric chitosan as a gene delivery system in vitro and in vivo. The Journal of Gene Medicine 5: 130-141.
- Chung YC, Li YH,Chen CC (2005) Pollutant removal from aquaculture wastewater using the biopolymer chitosan at different molecular weights. Journal of Environmental Science and Health 40: 1775-1790.
- Muzzarelli RA, Rocchetti R (1985) Determination of the degree of acetylation of chitosans by first derivative ultraviolet spectrophotometry. Carbohydrate Polymers 5: 461-472.
- Khan TA, Peh KK, Ch'ng HS (2002) Reporting degree of deacetylation values of chitosan: the influence of analytical methods. J Pharm Pharm Sci 5: 205-212. [Crossref]
- Ma PL, Lavertu M, Winnik FM, Buschmann MD (2009). New Insights into chitosan− DNA interactions using isothermal titration microcalorimetry. Biomacromolecules 10: 1490-1499.
- Kocun M, Grandbois M, Cuccia LA (2011) Single molecule atomic force microscopy and force spectroscopy of chitosan. Colloids Surf B Biointerfaces 82: 470-476. [Crossref]
- Varum K, Ottoy M, Smidsrod O (1994) Water-solubility of partially N-acetylated chitosans as a function of pH: effect of chemical composition and depolymerisation. Carbohydrate Polymers.
- Hirano S, Ohe Y, Ono H (1976) Selective N-acylation of chitosan. Carbohydr Res 47: 315-320. [Crossref]