Abstract
A pair of gene paralogs, NTNG1 and NTNG2, sharing identical gene and protein structures and encoding similar proteins, forms a functional complement subfunctionalising (SF) within cognitive domains and forming cognitive endophenotypes, as detected by Intellectual Quotient tests [1]. Both NTNG paralogs are associated with autism spectrum disorder, bipolar disorder and schizophrenia, with unique non-overlapping segregation among the other cognitive disorders, emphasizing an evolutionary gain-dependent link between advanced cognitive functions and concomitant neurocognitive pathologies. We revealed complementary expression and transcriptome composition of the paralogs within the human brain explaining the observed phenomena of NTNG1 and NTNG2 functional complementarity. The gene paralogs expression levels undergo age-dependent and brain area-specific modalities over the almost entire human lifespan. It has also been reported that NTNG1 contains anthropoid-specific constrained regions, and both genes contain non-coding conserved sequences that underwent accelerated evolution in human. NTNG paralogs SF perturbates “structure drives function” concept at protein and gene levels. We suggest that the paralogs function diversification forms a so-called “Cognitive Complement”, as an end product of gene duplication and subsequent cognitive subfunction bifurcation among the NTNG gene duplicates.
Key words
gene duplication, evolution, subfunctionalisation, cognitive complement
Introduction
Complex behaviors arise from a combination of simpler genetic modules that have either evolved separately or co-evolved. Many genes and proteins they encode have been found to be involved in processing cognitive information with a single variant or a single gene generally accounting for only a partial phenotypic variation of a complex trait, such as cognition. Cognition as the quintessence of brain function can be viewed as a product of intricately interlinked networks generated by deeply embedded gene-nodes with specific or partially overlapping functions. The robustness of cognitive processing towards its single elements genetic eliminations (e.g. to study their function) and its simultaneous fragility expressed in the multiple forms of neurological disorders manifest the existence of cognitive domains, interlocked and subfunctionalised within a unit of cognition formed upon these domains interaction.
A gene content associated with the attenuated Intellectual Quotient (IQ) score (as a surrogate measure of human cognitive abilities) often relates to numerous diseases, such as schizophrenia (SCZ), autism spectrum disorder (ASD), depression, and others [2,3] and several of these genes have undergone positive selection during the human brain evolution [4]. Despite high conservation of the global network properties of the brain transcriptome among species there are robust human-specific disease-associated modules [5] and human accelerated regions (HARs) - highly conserved parts of genome, that underwent accelerated evolution in humans [6]. HARs can serve as genomic markers for human-specific traits underlying the recent acquisition of modern human cognitive abilities by the brain [7] that also “might have led to an increase in structural instability… resulted in a higher risk for neurodegeneration in the aging brain” [8], rendering intellect genetically fragile [9] and resulting in a variety of cognitive disorders cognitive disorders (CDs). The role of genomic context, epistasis [10], in evolution and pathology is manifested by frequently found disease-causing alleles present in animals without obvious pathological symptoms for the host [11]. Any CD is characterized by general intellectual disability plus psychiatric symptoms. A genetic perturbation-exerted behavioral CD in an animal model organism is not an adequate match for a human CD per se due to very poor contextual resemblance between the human general intellectual disability and animal behavioral CD together with the absence of interpretable psychiatric symptoms. The usefulness of animals as psychiatric models is also compromised by the fact that transcriptome differences of within species tissues are smaller than those among the homologous tissues of different species [12,13]. It is thus no surprise that compounds that “cure” mouse models consistently fail in human trials [14].
The previously observed phenomena of function complementation within cognitive domains among the NTNG paralogs [1] are also manifested in NTNG-associated human pathologies diagnosed in most cases (if not all) by a prominent cognitive deficit (Figure 1A-1,A-2). Both genes are associated with bipolar disorder (BD) and SCZ, devastating disorders that share similar etiology [15], with a genetic correlation by multivariate analysis of 0.590 [16], linked to human creativity [17], and characterized by impulsiveness as a common diagnostic feature [18]. The recently discovered associations of both paralogs with ASD [19] supports the reported genetic correlation of 0.194 for the ASD/SCZ pair [16] and shared module eigengenes detected by the principal component analysis among these two disorders [20]. Twelve NTNG1-linked CDs, ranging from Alzheimer’s disease to Tourette syndrome, span a broad spectrum of clinical features frequently involving reduced processing speed (PS) and verbal comprehension (VC, Figure 1A-1). As for NTNG2, working memory (WM) deficits and, inability to “bind” events, perceptual organization (PO) are the most prominent diagnostic traits of systemic lupus erythematosis (SLE) and temporal lobe epilepsy (Figure 1A-2), with pseudopapillary neoplasm also being characterised by indolent behavior in 90% of the cases [21]. Interestingly, that association of the synapse-expressed NTNG2 with both SCZ and an autoimmune pathology (e.g., SLE) correlates with a recent finding that human complement component C4 is involved in the synapse elimination and the development of SCZ [22]. Both NTNG paralogs are associated with a variety of CDs in a predominantly non-overlapping manner, except for ASD, BD and SCZ characterized by a shared and wide spectrum of cognitive abnormalities. It is noteworthy that ASD, BD and SCZ are also a primary focus of the recently initiated PsychENCODE project [23]. Thus, the clinical etiology of these diseases supports the IQ-deduced functional complementation of the NTNG paralogs [1] with VC/PS and WM/PO deficits also being uniquely segregated among the associated cognitive pathologies.
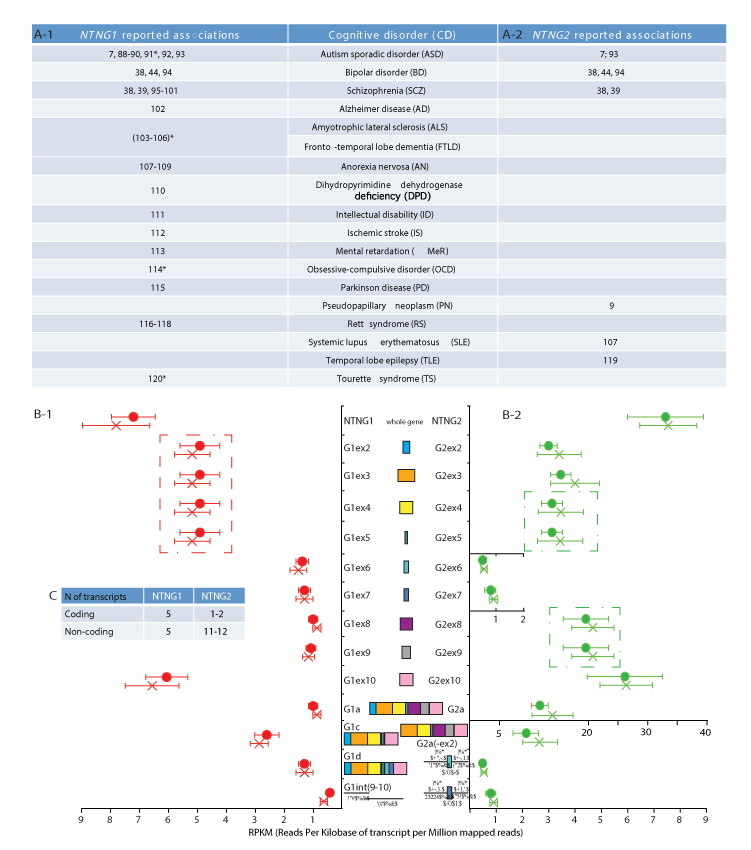
Figure 1. NTNG paralogs complementation within neurological disorders and brain transcriptome (A-1, A-2) Reported cognitive disorders (CDs) associations for NTNG1 and NTNG2; *denotes rather an indirect association via a direct interaction with the research target. (B-1, B-2) RNA-seq of the superior temporal gyrus (STG) of healthy (circle) and SCZ (cross) human subjects. The original dataset was produced by Wu et al. [31], accession number E-MTAB-1030 on ArrayExpress (ST1a) and reprocessed as described in SM. Five NTNG1 and four NTNG2 transcripts, consistently expressed across all 16 human samples are shown. Two samples (one healthy and one SCZ) have been omitted due to unsatisfactory quality of reads and expression profiling (ST1b). For the SNPs calling by SAMtools see ST1c. Data are presented as a mean RPKM ± SEM. (C) Total number of the assembled transcripts across all samples for both paralogs (see ST1d for the completely reconstructed NTNG transcriptome). Dash-outlined are co-spliced exon clusters.
Involvement of the pre-synaptically expressed axon-localised NTNGs in SCZ diagnosis supports the established view of SCZ as a product of distorted trans-synaptic signaling [24], with a recent study demonstrating that axonal connectivity-associated genes form a functional network visualisable by functional magnetic resonance imaging [25], and that brain connectivity predicts the level of fluid intelligence [26,27]. Both NTNGs have been found to participate in the brain functional connectivity based on parcellated connectome reconstruction [28]. The resemblance of the reported disease associations with behavioral phenotypes of Ntng1 and Ntng2 gene knockout mice is also noteworthy [29].
Results
Both NTNG genes are expected to have identical gene exon/intron compositions, but their intron lengths differ [30]. We reconstructed the paralogs’ transcriptomes by re-processing publicly available RNA-seq dataset [31] from post-mortem brain tissue obtained from the superior temporal gyrus (STG) of healthy and SCZ human subjects (Supplementary Table 1 (ST1a)). The total expression levels (genes, exons, individual RNA transcripts) prominently differed between the two genes (Figure 1B-1,B-2). The amount of NTNG2 (as a whole gene) was 5-fold greater than that of NTNG1; expression of exons (2-5), exons (8-9) and exon 10 of NTNG2 was 3-fold, 18-fold, and 4-fold higher, respectively, compared with NTNG1. The only two exons to conforming to the prevailing amount rule of NTNG2 mRNAs were exons 6 and 7, whose expression was nearly at the same absolute level as that of NTNG1 exon paralogs, making them highly underrepresented within the NTNG2 transcriptome. Next, distinct non-alternating splicing modules were formed by exons (2-5) of NTNG1 (Figure 1B-1), and by exons (4-5) and exons (8-9) of NTNG2 (Figure 1B-2). Two structurally identical RNA transcript paralogs (NTNG1a = G1a and NTNG2a = G2a) were detectable in both NTNG transcriptomes with G2a expression 8 to 9-fold higher than G1a expression. NTNG1 was uniformly presented across the all 16 analysed human samples with 2 more protein-coding RNAs (G1c and G1d, detected previously in mouse brain, [32]) and two non-coding intron (9-10)-derived transcripts (Figure 1B-1). At the same time, NTNG2 transcriptome was comprised of one extra potentially coding RNA (G2a-like with exon 2 spliced out, but in-frame coding preserved) and two assumed non-coding RNAs with exons 6 and 7 retained along with the preceding and following introns. Interestingly, that these two latter transcripts were the only RNA species with NTNG2 exon 6 and 7 retained (Figure 1B-2). Two more coding (G1f and G1n) and four more non-coding NTNG1 RNA species and 9 extra non-coding for NTNG2 RNA species were also assembled from the available reads, but due their inconsistent appearance across all 16 STG samples they are not presented in the figure but are summarized in the table (Figure 1C, for details refer to ST1d). In summary, quantitative and qualitative complementary differences are a prominent feature characterising the brain RNA transcriptome of human NTNG paralogs. Comparison of SCZ and healthy subject samples, however, revealed no significant differences in the transcription level of the whole genes, individual exons, or reconstructed RNA transcripts.
SNP calling across all STG samples (ST1c) to detect the presence of IQ-affecting SNPs [1] revealed that 15 of 16 subjects were positive for the T-allele rs2149171 (exon 4-nested), which attenuates the WM score in SCZ patients, preventing us from comparing allele carriers with non-carriers. Four healthy and three SCZ samples carried the T-allele rs3824574 (exon 3-nested, non-affecting IQ), and one healthy and one SCZ sample each contained the C-allele rs4915045 (exon10, non-coding part-nested, and non-affecting IQ). Thus, among the eleven cognitive endophenotype-associated SNPs only three could be called out of the available NTNG transcriptome.
The distinct complementary nature of the NTNG paralog segregation within neurological disorders and RNA transcriptome usage in the STG (Figure 1) has prompted us to analyse the expression of both genes across the entire human brain. We reconstructed the expression profiles of both genes in human brain areas over the lifespan from conception (pcw = post-conception week) to maturity (30-40 yrs old) using the RNA-seq data from BrainSpan (www.brainspan.org). Similarities and differences between age-dependent phases of the NTNG1 and NTNG2 expression profiles were readily detected (Figure 2). Based on the visual input, three distinct classifiers were elaborated: 1) predominantly synchronous (Figure 2A(1-4)), characteristic mostly of the cortical areas; 2) predominantly mixed and asynchronous (Figure 2B), characteristic of the cerebellar cortex and subcortical formations; and 3) anti-phasic (complementary, Figure 2C), characteristic of the mediodorsal nucleus of the thalamus (MD) and hippocampus. All analysed brain areas, except thalamus, expressed higher level of NTNG2 compared with NTNG1 (Figure 2C) with the largest difference observed at the time of birth (35-37 pcw) or soon after (4 months) for the synchronous classifiers (Figure 2A), and oscillating increment values across the life span for the mixed (Figure 2B) and anti-phasic (Figure 2C) classifiers. Intriguingly, expression of the paralogs in essentially all brain areas tended to be more similar at maturity (30-40 years old, nearly or above the mean age used for the IQ testing [1]), except the MD where the expression discrepancy was actually increased. Thus, the observed functional complementation among the NTNG paralogs is supported by the anatomical distribution of their expression, in the human brain and their expression patterns over the lifespan of the human subjects.
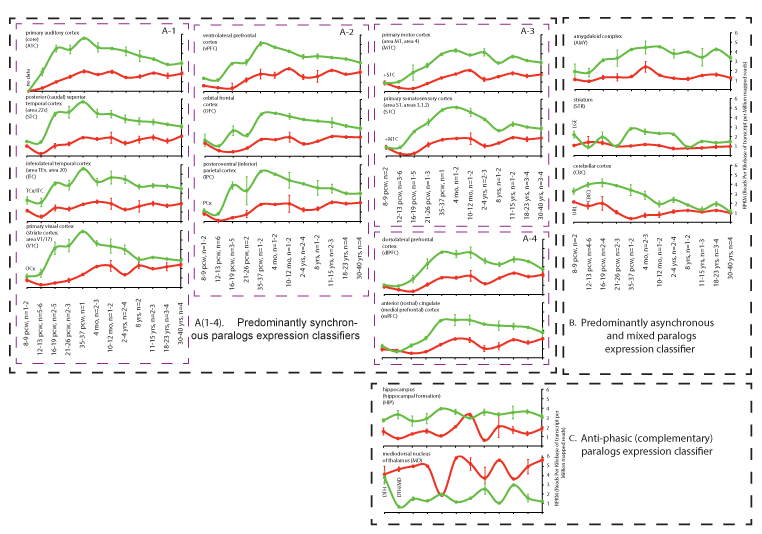
Figure 2. NTNG paralogs expression dynamics classification (A-C) in the human brain across the life span. A (1-4): further subdivision of the classifiers. RNA-seq data are from the BrainSpan (www.brainspan.org) presented as a mean ± SEM. TCx: Temporary Neocortex; OCx: Occipital Neocortex; PCx: Parietal Neocortex; LGE: Lateral Ganglionic Eminence; CB(C): Cerebellum(cortex); DTH: Dorsal Thalamus; URL: Upper (Rostral) Rombic Limb; pcw: Post-Conception Week. Two data points (MD, 12-13 pcw, and mPFC, 16-19 pcw) for NTNG1 expression were omitted as they were 6-7 times different from the mean for other replicas. All processed brain samples are listed in ST2.
Direct comparison of the NTNG paralogs revealed an identical intron-exon gene structure (Figure 1B-1, 2B-2) as well as closely matched exon sizes (Figure 3A). There are three exons of identical sizes (exons 4, 8 and 9), another three exons differ by one encoded amino acid (exons 3, 5 and 6) and three exons of different sizes (exons 2, 7 and 10). The largest difference among the genes is that intron (9-10) of NTNG1 is 52.7-fold larger than its NTNG2 paralogous intron, with intron (6-7) of NTNG1 being only 1.43-fold larger indicating a non-equilibria elaboration process of the non-coding elements expansion as the SF of the gene paralogs proceeded. Nevertheless, the size of all NTNG1 introns is generally several times larger than that of their NTNG2 analogs (Figure 3A). We previously demonstrated that exons 6 and 7 are differentially used within the brain NTNG transcriptome (Figure 1B-1 and B-2), and to explore their potential contribution to the paralogs SF we built identity matrices with these exons being excluded and included (but still producing in-frame existing transcripts, Figure 3B-1 left and right panels, respectively). Exclusion of both exons from the full-length transcripts (thus converting NTNG1m to NTNG1a and NTNG2b to NTNG2a, respectively) increased the DNA sequence identity on 2% (a relatively large effect as both exons together represent only 7.22 and 9.69% of the total coding part of the full-length RNA transcripts, NTNG1m and NTNG2b, respectively, Figure 3B-2). The spliced-out Ukd protein domains (encoded by exons 6 and 7) increased the proteins identity by 3.8% indicating a substantial difference in the middle portions of both genes (and encoded proteins) between the two gene paralogs. To corroborate this observation and to explore the importance of other protein parts we directly compared the sequences encoded by the full-length transcripts and producing Netrin-G1m and Netrin-G2b (Figure 3C). Similar to what is shown in Figure 3B-1 and 3B-2, the lowest sequence identity (17.5%) was represented by the Ukd domain (encoded by the exons 6 and 7) and by the preceding exon 5 (a 3’-part of the LE1 domain). Two other areas also showed substantially low identity, namely the N-terminus (including the protein secretory signal indicated by an arrow) and the outmost C-terminus responsible for the unique feature of Netrin-Gs – the GPI attachment. Thus, based on the percent sequence identity comparisons among the Netrin-G paralogs, several potential protein parts are predicted to contribute to the paralog SF. As reported by [33], identical gene and protein domain compositions result in the identical structural motifs with differences only in the spatial arrangement of the loops facing the post-synaptic Netrin-G’s interacting partners, NGL-1 and NGL-2, respectively (Figure 3D). The loop I binding surfaces alignment (Figure 3C, blue color) shows a high level of conservation (with at least 5 amino acids 100% conserved) among the Netrin-G paralogs, indicating that it is not likely responsible for the cognate ligand binding specificity. Neither Loop II (Figure 5C, yellow) nor Loop III (Figure 5C, orange) display a single conserved amino acid shared among the paralogous binding interfaces, as it originally has been described in [33]. Thus the complementary pattern of the pre-postsynaptic interactions mediated via specific Netrin-G/NGL pairs is reflected in the reciprocally different sizes of the loop-binding interfaces representing another element of the NTNG-encoded protein paralogs SF.
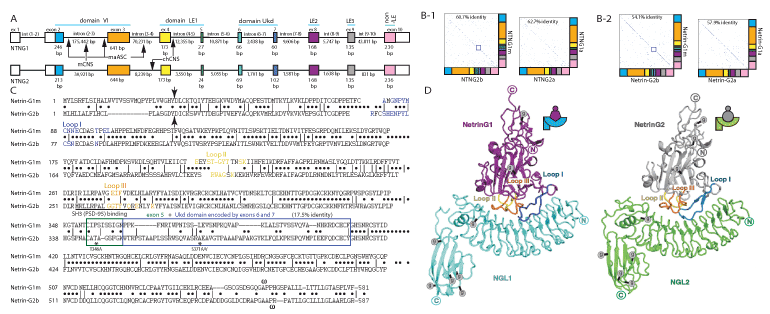
Figure 3. Human NTNG paralogs DNA and protein sequence comparisons and “structure-function” rule incongruence. (A) Identical gene structures with different sizes of introns. RNA-seq data from Figure 1B were used to precisely deduce the exon/intron junction boundaries. The sizes of exons 1, 10 and introns (1-2) are not indicated due to observed among the splice transcripts lengths variability (see ST1a for details). Arrows indicate location of CNS = conserved non-coding sequences that underwent accelerated evolution in human when compared to mouse (mCNS) and chimpanzee (chCNS), as per [118]; and ASC: Anthropoid-Specific Constrained regions in human compare to marmoset (maASC), as per [119]. (B) Identical exonal composition of the longest NTNG encoded RNA paralog transcripts and corresponding proteins with relatively high percent of identity among them dependent on the included/excluded Ukd domain (B-2) encoded by the exons 6 and 7 (B-1). Notably, the protein sequence represents higher percent of the paralogs difference than encoded it DNA. (C) Protein alignments for the longest human NTNG encoded proteins, Netrin-G1m and Netrin-G2b, with Loops I-III highlighting binding sites for their cognate post-synaptic binding partners NGL-1 (Lrrc4c) and NGL-2 (Lrrc4), respectively, as determined by Seiradake et al. [33]. Arrow indicates a putative secretory cleavage site location, as calculated by SignalIP algorithm [120], the blue rectangle delineates the area of the lowest identity (3’-domain LE1+Ukd domain); w – denotes a point of putative GPI-attachment, as predicted by Big-PI algorithm [121]. PSD-95 interaction site via the SH3-binding domain [64], as determined for mouse Netrin-G2, overlaps with the Loop III of NGL-2 binding surface. Two stars indicate a modern human (T346A) and a hominin-specific (S371A/V) amino acid substitutions [1]. (D) Identical structural motif of the Netrin-G1/NGL1 and Netrin-G2/NGL2 complexes as per [33]. The figure’s reproduction is covered by the Creative Commons Attribution license.
Discussion
Intrinsic complementarity of the NTNG paralog brain transcriptome and possible mechanism of the effects of IQ-affecting mutation alleles
There is no global difference at the mRNA level between healthy subjects and SCZ patients (Figure 1B). This conclusion is supported by previously published works stating that globally-altered mRNA expression of NTNG1 or NTNG2 is unlikely to confer disease susceptibility, at least in the temporal lobe [34], and Brodmann’s area [35]. However, the original paper-source of the STG samples RNA-seq along with that of many other genes (>1,000) reported that NTNG1 (but not NTNG2) falls under the group of genes with significant alternative promoter usage ([31]: ST6, p < 9.05E-10 at FDR <0.5) and NTNG2 (but not NTNG1) clusters with genes (>700) with significant alternative splicing differences ([31]: ST7, p<6.15E-12 at FDR<0.5) based on comparison of SCZ and control samples. Such observations of genome-wide association studies provide an extra layer of complementary regulation for both NTNG paralogs on a top of the described in the results section complementary usage rule for the exons, formed by unspliced splicing modules, resulting transcripts and comprising them exons (Figure 1B). Based on the available RNA-seq dataset it was not possible to detect RNA with the matched position of NTNG SNPs used for the IQ testing (ST2c), except for two coding exons located (rs2149171 and rs3824574) and exon 10 non-coding area located but transcribed rs4915045 (in 2 out of 16 samples). This fact points to indirect effects of the IQ-affecting mutation alleles potentially associated with the generation of shorter (secretable) isoforms (Prosselkov et al. unpublished) lacking two of the most prominent NTNG features: the GPI-link and the Ukd domain through an aberrant splicing factor binding. The GPI-link is a hallmark of Netrin-G family members [32,36] and without it the aberrant Netrin-G isoforms are likely to mimic the actions of their releasable ancestry molecules - netrins, still being able to bind to their cognate postsynaptic ligand, NGL, but without forming an axonal-postsynaptic contact. The Ukd domain of Netrin-G1, despite its so-far unknown function, is involved in lateral binding to the pre-synaptically localised leukocyte antigen-related (LAR) modulating the binding strength between NGL-1 and Netrin-G1 [37]. The search for a similar lateral interaction partner for the Netrin-G2 Ukd domain is currently underway. The inclusion of Ukd-encoding exons 6 and 7 is regulated by the Nova splicing factor [38], affecting the cortex Netrin-G1 exon 7 (but not exon 6), and, simultaneously, Netrin-G2 paralog exons exhibiting an opposite pattern. It is tempting to speculate, that deregulation of NTNG transcripts processing may have a role in brain-controlled cognitive abilities and associated CDs. Supporting such notion, decreased expression of Netrin-G1c mRNA (exons 6-9 excluded, Figure 1B-1) has been reported for BD and SCZ [34] with Netrin-G1d (exons 6 and 7 included but 8-9 excluded, Figure 1B-1) and Netrin-G1f (a secretable short isoform consisting of domain VI only and lacking the Ukd and GPI-link) being increased in the anterior cingulated cortex in BD, but not in SCZ [39]. Higher expression of Netrin-G1d mRNA in the fetal brain and low expression of the Netrin-G1c isoform in the human adult [34] indicates different functionality of these two splice variants joggling with the Ukd domain inclusion/exclusion pattern. And, according to our other data, if Netrin-G1 Ukd-containing isoforms are the dominant isoforms in adult mouse brain, Netrin-G2 Ukd-containing isoforms are present only at the trace level (Prosselkov et al. unpublished), resembling the transcriptome pattern in human STG samples (Figure 1B-1 and B-2). A similar “dynamic microexon regulation” associated with the protein interactome misregulation has been reported to be linked to ASD [40].
Synchronous and complementary expression of NTNG paralogs in the human brain supports the IQ-associated cognitive endophenotypes
The influential parieto-frontal integration theory (P-FIT) [41] states that general intelligence (“g”) is dependent on multiple brain cortical areas such as dolsolateral prefrontal cortex (dlPFC), Broca's and Wernicke's areas, and somatosensory and visual cortices [42]. Despite the wide acceptance of “g” as the only correlate of the intelligence, its unitary nature was challenged in a report by [43] of two independent brain networks (for memory and for reasoning) responsible for task performance, an idea that was later criticised for the data processing approach that was used [44]. Higher IQ scores (a composite surrogate of “g”) are reportedly associated with the fronto-parietal network connectivity [45,46]. High expression levels of NTNG paralogs within the intensively cognition-loaded areas of the brain and the distinct patterns of expression profiles (synchronous, asynchronous/mixed, and complementary, Figure 2A) support the association of NTNG1 and NTNG2 with the recorded cognitive endophenotypes [1]. Based on the expression patterns over the human life-span, among the total 16 analysed brain areas we found two brain areas falling under the same “anti-phasic (complementary)” classifier (Figure 2C): hippocampus (HIP) and mediodorsal nucleus of thalamus MD. Adding more to that, MD is the only brain area (out of the 16 presented) in which the NTNG1 expression level exceeds that of NTNG2 making it a promising candidate area for explaining the phenomena of NTNG SF. Two other brain areas classified by a synchronous paralog expression deserve a special attention, the dlPFC and the mPFC (Figure 2A-4). The PFC circuitry is known as a “hub of the brain’s working memory system” [47,48], which acts through direct HIP afferents [49] and has many connections with other cortical and subcortical areas [50]. The mPFC may function as an intelligence-control switchboard and the lateral PFC, part of the frontoparietal network global connectivity, predicts the working memory performance and fluid intelligence [51]. Interactions of the auditory information recognition fed by the ventral PFC stream with the sequence processing by the dorsal stream are crucial for the human language articulation [52,53]. The fact that both NTNG paralogs are extensively expressed across the PFC (Figure 2A-2 and A-4) pinpoints this brain area as a key for future molecular studies of the human-unique symbolic communications. The PFC is not only implicated in many psychiatric disorders, including SCZ [50,54], and is the only brain structure unique to primates without known homologs in the animal kingdom [55].
Evolution of the protein paralogs encoded by the NTNGs
Forkhead box P2 (FOXP2), a ubiquitously expressed transcription factor that has been reportedly linked to the evolution of human language through T303N, N325S substitutions [56], is 100% identical to Nea protein [57]. FOXP2 regulates the expression of multiple genes in humans and chimpanzees [58], and among them is an M3 gene brain module that is responsible for general fluid cognitive abilities [3] and LRRC4C, a gene encoding NGL-1 – a post-synaptic target of Netrin-G1. Similarly to FOXP2, Netrin-G1 is a 100% conserved protein among hominins with only one mutation found in chimpanzees that is absent in marmoset (and other primates) and mouse proteins [1]. On the other hand, Netrin-G2 in extinct hominins relative to that in modern humans contains a T346A point mutation (as per current version of hg19), that is also found in primates and mice and known as rs4962173 (dbSNP missense mutation) representing an ancient substitution from Neandethal genomes found in modern humans and reflecting a recent acquisition of the novel allele around 5,300 years BC. Nothing is known about the functional significance of this mutation but biochemically a substitution of alanine (A) on a polar threonine (T) could provide an extra point of regulation, e.g. a phosphorylation or glycosylation (NetPhos2.0 [59] assigns a low score for T346 to be phosphorylated but NetOGlyc4.0 [60] robustly predicts that it is glycosylated (see SM). Another mutation S371A/V reflects a selective sweep in Netrin-G2 protein from primates to hominins within a similar to T346A functional context when a hydrophobic alanine (in chimpanzee, A)/valine (in marmoset, V) is replaced by a polar serine (S) and a strong positive predictions for glycosylation but not phosphorylation (see SM). This poses a question about whether these two human-specific protein substitutions are associated with advanced cognitive traits as they may represent a hidden layer of poorly studied so far protein glycosylation-associated regulatomes known to affect the brain function and diseases [61,62]. In addition, T346 is nested on exon 5, just 20 nucleotides away from the rs2274855 mutation allele, affecting WM scores [1], and, together with S371A/V, they are both located within the lowest percent identity area (exons (5-7)) of Netrin-Gs (Figure 3C) and are proposed to contribute to NTNG duplicates SF. There are at least three more protein parts potentially contributing to the gene paralogs-specialised function subdivision (based on the low identity scores, Figure 3C): the secretory peptide, the GPI-link, and the outermost structurally elaborated unstructured loops (I-III) responsible for the reciprocal binding of Netrin-Gs to their post-synaptic cognate partners, NGL-1 or NGL-2, both containing a C-terminal PDZ-binding domain [63]. An interesting finding reported by [64] is the presence of an SH3(PSD95) domain binding site (required for the phosphatidylinositol-3-kinase recruitment) in mouse Netrin-G2 (100% identical to human) but not in Netrin-G1. The detected SH3 binding site overlaps with the Netrin-G2-loop III responsible for the binding specificity to NGL-2 [33,65,66].
The overall identical structural scaffold among the Netrin-G paralogs (Figure 3D) is likely to represent an anciently preserved primordial protein (encoded by a single gene in the primitive urochordate C.intestinalis) and its contribution to the process of SF among the NTNG paralogs goes against the “structure drives function” concept. It looks like that it is not the “structure” but rather the “evolution” itself that drives the selection of the best structural (or unstructural in our case) fit out of the available frameworks provided by the gene duplicates to fulfill emerging functional demands in a new ecological niche. The intricate phenotypic variability is grounded by the conserved nature of the genotype and constrained by the “structure-function” limitations of the coding DNA, and is only possible due to permissive evolutionarily continuing elaborations of non-coding areas able to absorb the most recently acquired elements (having a potential to become regulatory at some point, e.g. like HAR5 [7]) and carried over by neutral drift, as proposed by Kimura but for proteins [67]. At the same time, the multiple protein substitutions coinciding with the subfunctional labor segregation phenomena among the Netrin-G paralogs raises doubt about their neutral nature. Both genes undergo a purifying selection, from mice to human, through the reduction in the size of non-coding DNA (introns) and encoded proteins (the mouse Netrin-G2 is 2 amino acids longer than its human ortholog), further contributing to the host-specific SF. Thus, while the non-coding sequences are used to explore the evolutionary space in time, the restrictive boundaries of the paralogs SF are determined by the protein (unstructured) elements.
Molecular evolution of the “Cognitive Complement”
The appearance of the neural crest [68], an event that “affected the chordate evolution in the unprecedented manner” [69], multipotent progenitor cells [70], and neurogenic placodes (suggesting chemosensory and neurosecretory activities) [71] in first primitive urochordates/tunicates coincides with the presence of the Ntng precursor gene (ENSCING00000024925), later undergoing two rounds of duplication events in fish and affecting human cognitive abilities [1]. NTNG paralogs are expressed in the human neural crest-forming cells with 10-fold higher expression of NTNG2 than NTNG1 [72], and both are differentially expressed in human compared with chimpanzees and rhesus monkeys with the NTNG2 expression model showing stronger probability than NTNG1 [73], and both are more strongly expressed in human telencephalon compared with chimpanzees and macaques [74]. NTNG1 is classified as a brain module hub gene “whose pattern fundamentally shifted between species” [28]. Belonging to distinct modules of brain expression regulation [74,75], NTNGs are classified as “genes with human-specific expression profiles” [75]. A nearby gene, ~260 kbp upstream of NTNG2, is MED27 (mediator of RNA polymerase II) is proposed to be associated with the evolution of human-specific traits [76]. NTNG1 is also reported among the “adaptive plasticity genes” [77] potentiating rapid adaptive evolution in guppies (NTNG2 was not found within the input analysed RNA).
Complementarity among the NTNG paralogs and encoded proteins has been reported previously: the brain expression complementary pattern (in an almost self-exclusive manner) defined by the 5’-UTR-localised cis-regulatory elements [78]; complementary distribution within the hippocampal laminar structures [79]; axon-dendrite synaptic endings resulting in differential control over the neuronal circuit plasticity [80]; mutually-exclusive binding pattern to post-synaptic partners, NGL-1 and NGL-2, dictated by nonstructural protein elements [33]; alternative promoter usage vs. alternative mRNA splicing [31] and increased coefficient of variation (CV, ST1d] for NTNG1 expression but not NTNG2 in SCZ patients (similarly to [81]); knockout mice behavioral phenotypes and subcellular signaling partners complementarity [29]; “differential stability” brain modules expression (NTNG1 is expressed in the dorsal thalamus (M11) as a hub gene (Pearson’s 0.92) while NTNG2 is expressed in the neocortex and claustrum module (M6, Pearson’s 0.65)) [28]; hypocretin neuron-specific expression of NTNG1 (but not NTNG2) as a sleep modulator [82]; top-down and bottom-up information flows gating in mice and differential responsiveness to neuronal stimuli [Prosselkov et al. forthcoming]; and human IQ-compiling cognitive domains complementation [1]. The present study reports the association of NTNG complementarity with CDs (Figure 1A); mRNA splicing pattern complementary at the quantitative and qualitative levels via differential use of the middle-located exons (Figure 1B); brain complementary oscillatory expression over the human lifespan observed in intensively cognition-loaded brain areas (Figure 2); accelerated evolution of the paralog-segregated unique non-coding elements (Figure 3A); complementary pattern of the protein orthologs (mouse-to-human) protein sequence evolution. Such multi-level complementation is likely to reflect a shared evolutionary origin of a single gene of a primitive vertebrate organism that emerged 700 million years ago during the Cambrian explosion, and its subsequent functional segregation among the evolution-generated gene duplicates [83].
Occupying independent but intercalating functional niches, NTNG1 and NTNG2 do not compensate but rather complement each other’s function, forming a “functional complement” of genes. Half a billion years ago, the doubled gene dosage led to the gradual SF and manifested in a function complementation within the cognitive domains, at least in humans. We would like to coin such gene pair as a “Cognitive Complement”.
Materials and methods
Human brain NTNG transcriptome reconstruction
See Figure 1B and 1C. The original dataset was produced by [31] and the downloaded .bam files used for re-processing are listed in ST1a. All reconstructed transcripts are presented in the ST1d standalone Excel file. Two samples were excluded from the analysis due to failed “per base sequence quality” measure, and the “zero” expression level for NTNG1a and NTNG1int(9-10) otherwise consistently expressed throughout other samples (ST1b). SAMtools software was used for the SNP calling from the available RNA-seq datasets (ST1c). For details refer to SM.
Human brain expression profiling for NTNGs across the life span
The original source of the data was www.brainspan.org. All available samples were initially included into the analysis but two were excluded at a later stage (MD for 12-13 pcw and mPFC for 16-19 pcw) due to high deviation (6-7 times) from the mean of other replicas. The mean expression values per each brain area as RPKM values were plotted against the sampling age. Profile classification was performed visually by considering the overall trend for all plotted points as an average.
NTNG1 (NTNG1m)and NTNG2 (NTNG2b) full-length mRNA transcripts assembly
See Figure 3B. The human NTNG1m brain transcript was reported previously and we have confirmed its ortholog presence in the mouse brain by full-length cloning (Prosselkov et al., unpublished). Because NCBI contains only its partial CDS (AY764265), we used the RNA-seq-generated exons (Figure 1B) to reconstruct the full-length and to generate an open reading frame (ORF) of the encoded Netrin-G1m. Similarly, human NTNG2b was reconstructed from the RNA-seq dataset (E-MTAB-1030) and from Ensemble as follows. The exon 5 sequence was deduced from ENST00000372179, and other exons were from ENST00000467453 (no longer available on the current version of Ensemble) except for exon 6 deduced by running three independent alignments against the human genomic DNA with the mouse 3’-intron (5-6), exon 6, and 5’-intron (6-7) subsequently confirmed by the generated full-length ORF for Netrin-G2b. The reconstructed protein was predicted to encode 587 amino acid residues, similar to the mouse netrin-G2b ortholog of 589 residues (Prosselkov et al., forthcoming).
Full-length gene structures of reconstructed NTNG paralogs
See Figure 3A. Both, the RNA-seq obtained as described above from the STG brain samples, and the reconstructed full-length transcripts carrying all stably expressed exons were used to confirm the intron-exon junction coordinates for NTNG1 and NTNG2. Due to the observed variability in the intron (1-2) and exon 10 sizes their boundaries were left unmarked.
Conclusion
The emerged functional redundancy, as an outcome of gene duplication, leads to functional subdivisions and bifurcation among gene paralogs resulting in the paralogs SF. A functional compensation is known to exist among evolutionarily unrelated genes but has not been reported among the gene paralogs, more frequently characterized by function complementation. The structural identity of gene paralogs (at both, the gene and protein levels) does not provide a substrate for function compensation but rather for complementation, perturbating the “structure drives function” rule. A gene duplication event of a tunicate NTNG primordial gene and the subsequent process of its function diversification (driven by the appearance of new ecological niches and evolution) among the gene duplicates made them to SF into distinct cognitive domains in a complementary manner forming a “Cognitive Complement”. Studies analysing how the function of Ntng mouse genes resembles that of human orthologs are in progress [Prosselkov et al., forthcoming].
Supplementary materials(SM)
The Supplementary Materials include Supplementary Methods (RNA-seq of STG re-processing and SNPs detection) and Supplementary Tables (ST1a-c, ST2) as a single compiled pdf file. Reconstructed RNA-seq (.gtf) of the STG is presented as a standalone Excel file (ST1d). Also included are Netrin-G2b predicted phosphorylation and O-glycosylation, Netrin-G1 vs. Netrin-G2 Ukd alignment [84-87], predicted secretory peptide cleavage and GPI attachments.
View supplementary data
Acknowledgements
This work was in part supported by the “Funding Program for World-Leading Innovative R&D on Science and Technology (FIRST Program)” initiated by the Council for Science and Technology Policy (CSTP), and KAKENHI 15H04290 from the Japan Society for the Promotion of Science (JSPS).
References
- Prosselkov P, Hashimoto R, Polygalov D, Kazutaka O, Zhang Q, et al. (2016) Cognitive Endophenotypes of modern and extinct hominins associated with NTNG gene paralogs. Biomed Genet Genomics 1: 5-33.
- Zhao M, Kong L, Qu H (2014) A systems biology approach to identify intelligence quotient score-related genomic regions, and pathways relevant to potential therapeutic treatments. Scientific Reports 4: A4176.
- Johnson MR, Shkura K, Langley SR, Delahaye-Duriez A, Srivastava P, et al. (2016) Systems genetics identifies a convergent gene network for cognition and neurodevelopmental disease. Nat Neurosci 19: 223-232. [Crossref]
- Xu K, Schadt EE, Pollard KS, Roussos P, Dudley JT (2015) Genomic and network patterns of schizophrenia genetic variation in human evolutionary accelerated regions. Mol Biol Evol 32: 1148-1160.
- Miller JA, Horvath S, Geschwind DH (2010) Divergence of human and mouse brain transcriptome highlights Alzheimer disease pathways. Proc Natl Acad Sci U S A 107: 12698-12703. [Crossref]
- Pollard KS, Salama SR, King B, Kern AD, Dreszer T, et al. (2006) Forces shaping the fastest evolving regions in the human genome. PLoS Genet 2: e168. [Crossref]
- Boyd JL, Skove SL, Rouanet JP, Pilaz LJ, Bepler T, et al. (2015) Human-chimpanzee differences in a FZD8 enhancer alter cell-cycle dynamics in the developing neocortex. Curr Biol 25: 772-779. [Crossref]
- Zhou H, Hu S, Matveev R, Yu Q, Li J, et al. (2015) A Chronological Atlas of Natural Selection in the Human Genome during the Past Half-million Years. BioRxiv. [http://dx.doi.org/10.1101/018929]
- Crabtree GR (2013) Our fragile intellect. Part I. Trends in Genetics 29: 1-3.
- Hemani G, Shakhbazov K, Westra HJ, Esko T, Henders AK, et al. (2014) Detection and replication of epistasis influencing transcription in humans. Nature 508: 249-253. [Crossref]
- Jordan DM, Frangakis SG, Golzio C, Cassa CA, Kurtzberg J; Task Force for Neonatal Genomics, et al. (2015) Identification of cis-suppression of human disease mutations by comparative genomics. Nature 524: 225-229. [Crossref]
- Barbosa-Morais NL, Irimia M, Pan Q, Xiong HY, Gueroussov S, et al. (2012) The evolutionary landscape of alternative splicing in vertebrate species. Science 338: 1587-1593. [Crossref]
- Lin S, Lin Y, Nery JR, Urich MA, Breschi A, et al. (2014) Comparison of the transcriptional landscapes between human and mouse tissues. Proc Natl Acad Sci U S A 111: 17224-17229. [Crossref]
- Hyman SE (2014) How far can mice carry autism research? Cell 158: 13-14. [Crossref]
- Cross-Disorder Group of the Psychiatric Genomics Consortium, Lee SH, Ripke S, Neale BM, Faraone SV, et al. (2013) Genetic relationship between five psychiatric disorders estimated from genome-wide SNPs. Nat Genet 45: 984-994. [Crossref]
- Maier R, Moser G, Chen G-B, Ripke S, Cross-disorder Working Group of the Psychiatric Genomics Consortium, et al. (2015) Joint Analysis of Psychiatric Disorders Increases Accuracy of Risk Prediction for Schizophrenia, Bipolar Disorder, and Major Depressive Disorder. Am J Hum Genet 96: 283-294. [Crossref]
- Power RA, Steinberg S, Bjornsdottir G, Rietveld CA, Abdellaoui A, et al. (2015) Polygenic risk scores for schizophrenia and bipolar disorder predict creativity. Nat Neurosci 18: 953-955. [Crossref]
- Reddy LF, Lee J, Davis MC, Altshuler L, Glahn DC, et al. (2014) Impulsivity and risk taking in bipolar disorder and schizophrenia. Neuropsychopharmacology 39: 456-463. [Crossref]
- Sanders SJ, He X, Willsey AJ, Ercan-Sencicek AG, Samocha KE (2015) Insights into Autism Spectrum Disorder Genomic Architecture and Biology from 71 Risk Loci. Neuron 87: 1215-1233. [Crossref]
- Parikshak NN, Gandal MJ, Geschwind DH (2015) Systems biology and gene networks in neurodevelopmental and neurodegenerative disorders. Nat Rev Genet 16: 441-458. [Crossref]
- Cavard C, Audebourg A, Letourneur F, Audard V, Beuvon F, et al. (2009) Gene expression profiling provides insights into the pathways involved in solid pseudopapillary neoplasm of the pancreas. J Pathol 218: 201-209. [Crossref]
- Sekar A, Bialas AR, de Rivera H, Davis A, Hammond TR, et al. (2016) Schizophrenia risk from complex variation of complement component 4. Nature 530: 177-183. [Crossref]
- PsychENCODE Consortium, Akbarian S, Liu C, Knowles JA, Vaccarino FM, et al. (2015) The PsychENCODE project. Nat Neurosci 18: 1707-1712. [Crossref]
- Lips ES, Cornelisse LN, Toonen RF, Min JL, Hultman CM; International Schizophrenia Consortium, et al. (2012) Functional gene group analysis identifies synaptic gene groups as risk factor for schizophrenia. Mol Psychiatry 17: 996-1006. [Crossref]
- Richiardi J, Altmann A, Milazzo AC, Chang C, Chakravarty MM, et al. (2015) BRAIN NETWORKS. Correlated gene expression supports synchronous activity in brain networks. Science 348: 1241-1244. [Crossref]
- Finn ES, Shen X, Scheinost D, Rosenberg MD, Huang J, 2015. Functional connectome fingerprinting: identifying individuals using patterns of brain connectivity. Nat Neurosci 18: 1664-1671. [Crossref]
- Pamplona GSP, Neto GSS, Rosset SRE, Rogers BP, Salmon CEG (2015) Analyzing the association between functional connectivity of the brain and intellectual performance. Front Hum Neurosci 9: A61. [Crossref]
- Hawrylycz M, Miller JA, Menon V, Feng D, Dolbeare T (2015) Canonical genetic signatures of the adult human brain. Nat Neurosci 18: 1832-1844. [Crossref]
- Zhang Q, Goto H, Akiyoshi-Nishimura S, Prosselkov P, Sano C, et al. (2016) Diversification of behavior and postsynaptic properties by netrin-G presynaptic adhesion family proteins. Mol Brain 9: 6. [Crossref]
- Yin Y, Miner JH, Sanes JR (2002) Laminets: Laminin- and netrin-related genes expressed in distinct neuronal subsets. Mol Cell Neurosci 19: 344-358. [Crossref]
- Wu JQ, Wang X, Beveridge NJ, Tooney PA, Scott RJ, et al. (2012) Transcriptome Sequencing Revealed Significant Alteration of Cortical Promoter Usage and Splicing in Schizophrenia. PLoS One 7: e36351. [Crossref]
- Nakashiba T, Ikeda T, Nishimura S, Tashiro K, Honjo T, et al. (2000) Netrin-G1: a novel glycosyl phosphatidylinositol-linked mammalian netrin that is functionally divergent from classical netrins. J Neurosci 20: 6540-6550. [Crossref]
- Seiradake E, Coles CH, Perestenko PV, Harlos K, McIlhinney RA, et al. (2011) Structural basis for cell surface patterning through NetrinG-NGL interactions. EMBO J 30: 4479-4488. [Crossref]
- Eastwood SL, Harrison PJ (2008) Decreased mRNA expression of netrin-G1 and netrin-G2 in the temporal lobe in schizophrenia and bipolar disorder. Neuropsychopharmacology 33: 933-945. [Crossref]
- Aoki-Suzuki M, Yamada K, Meerabux J, Iwayama-Shigeno Y, Ohba H, et al. (2005) A Family-Based Association Study and Gene Expression Analyses of Netrin-G1 and -G2 Genes in Schizophrenia. Biol Psychiatry 57: 382-393. [Crossref]
- Nakashiba T, Nishimura S, Ikeda T, Itohara S (2002) Complementary expression and neurite outgrowth activity of netrin-G subfamily members. Mech Dev 111: 47-60. [Crossref]
- Song YS, Lee HJ, Prosselkov P, Itohara S, Kim E (2013) Trans-induced cis interaction in the tripartite NGL-1, netrin-G1 and LAR adhesion complex promotes development of excitatory synapses. J Cell Sci 126: 4926-4938. [Crossref]
- Ule J, Ule A, Spencer J, Williams A, Hu JS, et al. (2005) Nova regulates brain-specific splicing to shape the synapse. Nat Genet 37: 844-852. [Crossref]
- Eastwood SL, Harrison PJ. 2010. Markers of Glutamate Synaptic Transmission and Plasticity Are Increased in the Anterior Cingulate Cortex in Bipolar Disorder. Biol Psychiatry 67: 1010-1016. [Crossref]
- Irimia M, Weatheritt RJ, Ellis JD, Parikshak NN, Gonatopoulos-Pournatzis T, et al. (2014) A highly conserved program of neuronal microexons is misregulated in autistic brains. Cell 159: 1511-1523. [Crossref]
- Jung RE, Haier RJ (2007) The Parieto-Frontal Integration Theory (P-FIT) of intelligence: Converging neuroimaging evidence. Behav Brain Sci 30: 135-187. [Crossref]
2021 Copyright OAT. All rights reserv
- Colom R, Haier RJ, Head K, Álvarez-Linerac J, Ángeles Quiroga M, et al. (2009) Gray matter correlates of fluid, crystallized, and spatial intelligence: Testing the P-FIT model. Intelligence 37: 124-135.
- Hampshire A, Highfield RR, Parkin BL, Owen AM (2012) Fractionating human intelligence. Neuron 76: 1225-1237. [Crossref]
- Haier RJ, Karama S, Colom R, Jung R, Johnson W (2014) A comment on "Fractionating Intelligence" and the peer review process. Intelligence 46: 323-332.
- Song M, Zhou Y, Li J, Liu Y, Tian L, et al. (2008) Brain spontaneous functional connectivity and intelligence. Neuroimage 41: 1168-1176. [Crossref]
- Gläscher J, Tranel D, Paul LK, Rudrauf D, Rorden C, et al. (2009) Lesion mapping of cognitive abilities linked to intelligence. Neuron 61: 681-691. [Crossref]
- Kim J, Ghim JW, Lee JH, Jung MW (2013) Neural correlates of interval timing in rodent prefrontal cortex. J Neurosci 33: 13834-13847. [Crossref]
- Markowitz DA, Curtis CE, Pesaran B (2015) Multiple component networks support working memory in prefrontal cortex. Proc Natl Acad Sci U S A 112: 11084-11089. [Crossref]
- Spellman T, Rigotti M, Ahmari SE, Fusi S, Gogos JA, et al. (2015) Hippocampal-prefrontal input supports spatial encoding in working memory. Nature 522: 309-314. [Crossref]
- Riga D, Matos MR, Glas A, Smit AB, Spijker S, et al. (2014) Optogenetic dissection of medial prefrontal cortex circuitry. Front Syst Neurosci 8: 230. [Crossref]
- Cole MW, Yarkoni T, Repovs G, Anticevic A, Braver TS (2012) Global connectivity of prefrontal cortex predicts cognitive control and intelligence. J Neurosci 32: 8988-8999. [Crossref]
- Skeide MA, Friederici AD (2015) Response to Bornkessel-Schlesewsky et al. - towards a nonhuman primate model of language? Trends Cogn Sci 9: 483. [Crossref]
- Thothathiri M, Rattinger M (2015) Ventral and dorsal streams for choosing word order during sentence production. Proc Natl Acad Sci U S A 112: 15456-15461. [Crossref]
- Gulsuner S, McClellan JM (2014) De novo mutations in schizophrenia disrupt genes co-expressed in fetal prefrontal cortex. Neuropsychopharmacology 39: 238-239. [Crossref]
- Wise SP (2008) Forward frontal fields: phylogeny and fundamental function. Trends Neurosci 31: 599-608. [Crossref]
- Enard W, Przeworski M, Fisher SE (2002) Molecular evolution of FOXP2, a gene involved in speech and language. Nature 418: 869-872. [Crossref]
- Krause J, Lalueza-Fox C, Orlando L, Enard W, Green RE, et al. (2007) The derived FOXP2 variant of modern humans was shared with neandertals. Curr Biol 17: 1908-1912. [Crossref]
- Konopka G, Bomar JM, Winden K, Coppola G, Jonsson ZO, et al. (2009) Human-specific transcriptional regulation of CNS development genes by FOXP2. Nature 462: 213-217. [Crossref]
- Blom N, Gammeltoft S, Brunak S (1999) Sequence and structure-based prediction of eukaryotic protein phosphorylation sites. J Mol Biol 294: 1351-1362. [Crossref]
- Steentoft C, Vakhrushev SY, Joshi HJ, Kong Y, Vester-Christensen MB, et al. (2013) Precision mapping of the human O-GalNAc glycoproteome through SimpleCell technology. EMBO J 32: 1478-1488. [Crossref]
- Baenziger JU (2012) Moving the O-glycoproteome from form to function. Proc Natl Acad Sci U S A 109: 9672-9673. [Crossref]
- Baenziger JU (2013) O-mannosylation of cadherins. Proc Natl Acad Sci U S A 110: 20858-20859. [Crossref]
- Kim S, Burette A. Chung HS, Kwon SK, woo J, et al. (2006) NGL family PSD-95-interacting adhesion molecules regulate excitatory synapse formation. Nat Neurosci 9: 1294-1301. [Crossref]
- Arbuckle MI, Komiyama NH, Delaney A, Coba M, Garry EM, et al. (2010) The SH3 domain of postsynaptic density 95 mediates inflammatory pain through phosphatidylinositol-3-kinase recruitment. EMBO Rep 11: 473-478. [Crossref]
- Soto F, Watkins KL, Johnson RE, Schottler F, Kerschensteiner D. 2013. NGL-2 Regulates Pathway-Specific Neurite Growth and Lamination, Synapse Formation, and Signal Transmission in the Retina. J Neurosci 33: 11949-11959. [Crossref]
- DeNardo LA, de Wit J, Otto-Hitt S, Ghosh A (2012) NGL-2 regulates input-specific synapse development in CA1 pyramidal neurons. Neuron 76: 762-775. [Crossref]
- Kimura M, Ohta T (1974) On some principles governing molecular evolution. Proc Natl Acad Sci U S A 71: 2848-2852. [Crossref]
- Abitua PB, Wagner E, Navarrete IA, Levine M (2012) Identification of a rudimentary neural crest in a non-vertebrate chordate. Nature 492: 104-107. [Crossref]
- Green SA, Simoes-Costa M, Bronner ME (2015) Evolution of vertebrates as viewed from the crest. Nature 520: 474-482. [Crossref]
- Stolfi A, Ryan K, Meinertzhagen IA, Christiaen L (2015) Migratory neuronal progenitors arise from the neural plate borders in tunicates. Nature 527: 371-374. [Crossref]
- Abitua PB, Gainous TB, Kaczmarczyk AN, Winchell CJ, Hudson C, et al. (2015) The pre-vertebrate origins of neurogenic placodes. Nature 524: 462-465. [Crossref]
- Rada-Iglesias A, Bajpai R, Prescott S, Brugmann SA, Swigut T, et al. (2012) Epigenomic annotation of enhancers predicts transcriptional regulators of human neural crest. Cell Stem Cell 11: 633-648. [Crossref]
- Iskow RC, Gokcumen O, Abyzov A, Malukiewicz J, Zhu Q, et al. (2012) Regulatory element copy number differences shape primate expression profiles. Proc Natl Acad Sci U S A 109: 12656-12661. [Crossref]
- Konopka G, Friedrich T, Davis-Turak J, Winden K, Oldham MC, et al. (2012) Human-specific transcriptional networks in the brain. Neuron 75: 601-617. [Crossref]
- Liu XL, Somel M, Tang L, Yan Z, Jiang X, et al. (2012) Extension of cortical synaptic development distinguishes humans from chimpanzees and macaques. Genome Res 22: 611-622. [Crossref]
- McLean CY, Reno PL, Pollen AA, Bassan AI, Capellini TD, et al. (2011) Human-specific loss of regulatory DNA and the evolution of human-specific traits. Nature 471: 216-219. [Crossref]
- Ghalambor CK, Hoke KL, Ruell EW, Fischer EK, Reznick DN, et al. (2015) Non-adaptive plasticity potentiates rapid adaptive evolution of gene expression in nature. Nature 525: 372-375. [Crossref]
- Yaguchi K, Nishimura-Akiyoshi S, Kuroki S, Onodera T, Itohara S1 (2014) Identification of transcriptional regulatory elements for Ntng1 and Ntng2 genes in mice. Mol Brain 7: 19. [Crossref]
- Nishimura-Akiyoshi S, Niimi K, Nakashiba T, and Itohara S. 2007. Axonal netrin-Gs transneuronally determine lamina-specific subdendritic segments. Proc Natl Acad Sci U S A 104: 14801-14806. [Crossref]
- Matsukawa H, Akiyoshi-Nishimura S, Zhang Q, Luján R, Yamaguchi K, et al. (2014) Netrin-G/NGL Complexes Encode Functional Synaptic Diversification. J Neurosci 34: 15779-15792. [Crossref]
- Zhang F, Shugart YY, Yue W, Cheng Z, Wang G, et al. (2015) Increased Variability of Genomic Transcription in Schizophrenia. Sci Rep 5: 17995. [Crossref]
- Yelin-Bekerman L, Elbaz I, Diber A, Dahary D, (2015) Hypocretin neuron-specific transcriptome profiling identifies the sleep modulator Kcnh4a. ELife 4: e08638. [Crossref]
- Meerabux JM, Ohba H, Fukasawa M, Suto Y, Aoki-Suzuki M, et al. (2005) Human netrin-G1 isoforms show evidence of differential expression. Genomics 86: 112-116. [Crossref]
- McWilliam H, Li W, Uludag M, Squizzato S, Park YM, et al. (2013) Analysis Tool Web Services from the EMBL-EBI. Nucleic Acids Res 41: W597-600. [Crossref]
- Voineagu I, Wang X, Johnston P, Lowe JK, Tian Y, et al. (2011) Transcriptomic analysis of autistic brain reveals convergent molecular pathology. Nature 474: 380-384. [Crossref]
- O’Roak BJ, Vives L, Girirajan S, Karakoc E, Krumm N, et al. (2012) Sporadic autism exomes reveal a highly interconnected protein network of de novo mutations. Nature 485: 246-250. [Crossref]
- O'Roak BJ, Vives L, Fu WQ, Egertson JD, Stanaway IB, et al. (2012) Multiplex Targeted Sequencing Identifies Recurrently Mutated Genes in Autism Spectrum Disorders. Science 338: 1619-1622. [Crossref]
- King IF, Yandava CN, Mabb AM, Hsiao JS, Huang HS, et al. (2013) Topoisomerases facilitate transcription of long genes linked to autism. Nature 501: 58-62. [Crossref]
- Iossifov I, O'Roak BJ, Sanders SJ, Ronemus M, Krumm N, et al. (2014) The contribution of de novo coding mutations to autism spectrum disorder. Nature 515: 216-221. [Crossref]
- D’Gama AM, Pochareddy S, Li M, Jamuar SS, Reiff RE, et al. (2015) Targeted DNA Sequencing from Autism Spectrum Disorder Brains Implicates Multiple Genetic Mechanisms. Neuron 88: 910-917. [Crossref]
- Akula N, Barb, J, Jiang, X, Wendland, JR, Choi KH, et al. (2014) RNA-sequencing of the brain transcriptome implicates dysregulation of neuroplasticity, circadian rhythms and GTPase binding in bipolar disorder. Mol Psychiatry 19: 1179-1185. [Crossref]
- Fukasawa M, Aoki M, Yamada K, Iwayama-Shigeno Y, Takao H, et al. (2004) Case-control association study of human netrin G1 gene in Japanese schizophrenia. J Med Dent Sci 51: 121-128. [Crossref]
- Arinami T, Ohtsuki T, Ishiguro H, Ujike H, Tanaka Y, et al. (2005) Genomewide high-density SNP linkage analysis of 236 Japanese families supports the existence of schizophrenia susceptibility loci on chromosomes 1p, 14q, and 20p. Am J Hum Genet 77: 937-944. [Crossref]
- Ohtsuki T, Horiuchi Y, Koga M, Ishiguro H, Inada T, et al. (2008) Association of polymorphisms in the haplotype block spanning the alternatively spliced exons of the NTNG1 gene at 1p13.3 with schizophrenia in Japanese populations. Neurosci Lett 435: 194-197. [Crossref]
- Zakharyan R, Boyajyan A, Arakelyan A, Gevorgyan A, Mrazek F, et al. (2011) Functional variants of the genes involved in neurodevelopment and susceptibility to schizophrenia in an Armenian population. Hum Immunol 72: 746-748. [Crossref]
- Zhu Y, Yang H, Bi Y, Zhang Y, Zhen C, et al. (2011) Positive association between NTNG1 and schizophrenia in Chinese Han population. J Genet 90: 499-502. [Crossref]
- Ayalew M, Le-Niculescu H, Levey DF, Jain N, Changala B, et al. (2012) Convergent functional genomics of schizophrenia: from comprehensive understanding to genetic risk prediction. Mol Psychiatry 17: 887-905. [Crossref]
- Wilcox JA, Quadri S (2014) Replication of NTNG1 association in schizophrenia. Psychiatr Genet 24: 266-268. [Crossref]
- Zhang B, Gaiteri C, Bodea LG, Wang Z, McElwee J, et al. (2013) Integrated systems approach identifies genetic nodes and networks in late-onset Alzheimer's disease. Cell 153: 707-720. [Crossref]
- Lagier-Tourenne C, Polymenidou M, Hutt KR, Vu AQ, Baughn M, et al. (2012) Divergent roles of ALS-linked proteins FUS/TLS and TDP-43 intersect in processing long pre-mRNAs. Nat Neurosci 15: 1488-1497. [Crossref]
- Ishigaki S, Masuda A, Fujioka Y, Iguchi Y, Katsuno M, et al. (2012) Position-dependent FUS-RNA interactions regulate alternative splicing events and transcriptions. Sci Rep 2: 529. [Crossref]
- Rogelj B, Easton LE, Bogu GK, Stanton LW, Rot G, et al. (2012) Widespread binding of FUS along nascent RNA regulates alternative splicing in the brain. Sci Rep 2: 603. [Crossref]
- Nakaya T, Alexiou P, Maragkakis M, Chang A, Mourelatos Z (2013) FUS regulates genes coding for RNA-binding proteins in neurons by binding to their highly conserved introns. RNA 19: 498-509. [Crossref]
- Maurano MT, Humbert R, Rynes E, Thurman RE, Haugen E, et al. (2012) Systematic localization of common disease-associated variation in regulatory DNA. Science 337: 1190-1195. [Crossref]
- Wang K, Zhang H, Bloss CS, Duvvuri V, Kaye W, et al. (2011) A genome-wide association study on common SNPs and rare CNVs in anorexia nervosa. Mol Psychiatry 16: 949-959. [Crossref]
- Boraska V, Franklin CS, Floyd JA, Thornton LM, Huckins LM, et al. (2014) A genome-wide association study of anorexia nervosa. Mol Psychiatry 19: 1085-1094. [Crossref]
- van Kuilenburg AB, Meijer J, Mul AN, Hennekam RC, Hoovers JM, et al. (2009) Analysis of severely affected patients with dihydropyrimidine dehydrogenase deficiency reveals large intragenic rearrangements of DPYD and a de novo interstitial deletion del(1)(p13.3p21.3). Hum Genet 125: 581-590. [Crossref]
- Gilissen C, Hehir-Kwa JY, Thung DT, van de Vorst M, van Bon BW, et al. (2014) Genome sequencing identifies major causes of severe intellectual disability. Nature 511: 344-347. [Crossref]
- Stepanyan A, Zakharyan R, Boyajyan A (2013) The netrin G1 gene rs628117 polymorphism is associated with ischemic stroke. Neurosci Lett 549: 74-77. [Crossref]
- Bisgaard AM, Rasmussen LN, Moller HU, Kirchhoff M, Bryndorf T (2007) Interstitial deletion of the short arm of chromosome 1 (1p13.1p21.1) in a girl with mental retardation, short stature and colobomata. Clin Dysmorphol 16: 109-112. [Crossref]
- Stewart SE, Yu D, Scharf JM, Neale BM, Fagerness JA, et al. (2013) Genome-wide association study of obsessive-compulsive disorder. Mol Psychiatry 18: 788-798. [Crossref]
- Lesnick TG, Papapetropoulos S, Mash DC, Ffrench-Mullen J, Shehadeh L, et al. (2007) A genomic pathway approach to a complex disease: Axon guidance and Parkinson disease. PLoS Genet 3: 984-995. [Crossref]
- Borg I, Freude K, Kubart SK, Hoffmann K, Menzel C, Laccone F, et al. (2005) Disruption of Netrin G1 by a balanced chromosome translocation in a girl with Rett syndrome. Eur J Hum Genet 13: 921-927. [Crossref]
- Archer HL, Evans JC, Millar DS, Thompson PW, Kerr AM, et al. (2006) NTNG1 mutations are a rare cause of Rett syndrome. Am J Med Genet A 140: 691-694. [Crossref]
- Nectoux J, Girard B, Bahi-Buisson N, Prieur F, Afenjar A, et al. (2007) Netrin G1 mutations are an uncommon cause of atypical Rett syndrome with or without epilepsy. Pediatr Neurol 37: 270-274. [Crossref]
- Pan Y, Fang M, Shen L, Wang L, (2010) Abnormal expression of netrin-G2 in temporal lobe epilepsy neurons in humans and a rat model. Exp Neurol 224: 340-346. [Crossref]
- Scharf JM, Yu D, Mathews CA, Neale BM, Stewart SE, et al. (2013) Genome-wide association study of Tourette's syndrome. Mol Psychiatry 18: 721-728. [Crossref]
- Prabhakar S, Noonan JP, Pääbo S, Rubin EM (2006) Accelerated evolution of conserved noncoding sequences in humans. Science 314: 786. [Crossref]
- del Rosario RC, Rayan NA, Prabhakar S (2014) Noncoding origins of anthropoid traits and a new null model of transposon functionalization. Genome Res 24: 1469-1484. [Crossref]
- Petersen TN, Brunak S, von Heijne G, Nielsen H (2011) SignalP 4.0: discriminating signal peptides from transmembrane regions. Nat Methods 8: 785-786. [Crossref]
- Eisenhaber B, Bork P, Yuan Y, Löffler G, Eisenhaber F (2000) Automated annotation of GPI anchor sites: case study C.elegans. Trends Biochem Sci 25: 340-341. [Crossref]