Abstract
Excessive salt intake is a major cardiovascular risk factor. The main source of sodium in transitional and developing countries is not the processed food but salt added during the cooking procedure or at the table. The objective of this trial was to examine the impact of home salt containers’ labeling on daily salt intake. A sample of treated hypertensives (N= 139) was randomized in two groups, one receiving just a leaflet about the harmful effects of excessive salt consumption (control, N= 69), and the other one receiving in addition self-adhesive warning stickers for household salt containers (intervention, N= 70). Blood pressure (BP) and 24-hour urinary sodium excretion (Na24) were measured in all the subjects at the start of the trial, and 1, 2 and 12 months later. The average starting Na24 was 211.1±78.7 mmol, similar in both groups. One, two, and twelve months later a significant decrease in Na24 was observed in the intervention group (to 183.5±51.6 mmol; P <0.001) as opposed to the control group (to 206.5±60.4 mmol; P= 0.19). Initial BP steadily decreased by some 5.7/2.2 mm Hg (P<0.001) in the intervention group, and by 0.8/0.5 mm Hg among the controls (P>0.286). It is concluded that a marked, long-lasting reduction in Na24 and BP may be achieved with warning labels on harmful effects of excessive salt intake.
Key words
arterial hypertension, blood pressure, salt consumption, sodium.
Introduction
Arterial hypertension is one of the leading causes of death and a major public health problem. The causes of essential hypertension are numerous, including both genetic and environmental factors; one of the main environmental factors is excessive salt intake. It is directly associated with blood pressure (BP) elevation, and is an independent risk factor for development of stroke and heart attack [1]. Moreover, salt has additional adverse effects on the vasculature, such as impairment of endothelial function and increase in arterial stiffness [2].
The WHO recommends daily salt consumption below 5 grams. Nevertheless, the worldwide daily NaCl intake averages 9-13 g. In developed countries, the main source of salt is pre-processed, industrialized food, responsible for some 75% of the daily intake, while in less developed and transitional countries the main source is salt added during home cooking and/or at the table. Additional salting is responsible for 56.4% of the consumption in Croatia, followed by grocery bread (29.8%) and other bakery products (12.8%), with an average daily intake of 12 g [3].
A number of programs aimed at reducing daily salt intake have been launched. Campaigns generally consist of advertising in the media, of persuading the food industry and insisting on respective food labeling. Motivated by analogy with warning labels on tobacco products used in antismoking programs and our previous attempts at smoking reduction [4], we have hypothesized that accentuated, individualized warning, i.e. labels applied to household salt containers, might additionally lower the daily salt intake and elevated BP. Indeed, that intervention caused a significant reduction in daily natriuria over two months [5]. Since only long-term reduction can offer significant health benefits, we decided to continue the previous research [5] with the same examinees, and verify the effects of the intervention after one year.
Subjects and methods
The subjects of the study were treated, adult hypertensives of both sexes, registered in a family medicine office. The inclusion criteria, informed consent, measurements, and statistical evaluation have been presented previously [5]. From September 2012 to August 2015 included were 150 examinees. The subjects were randomized in two groups:
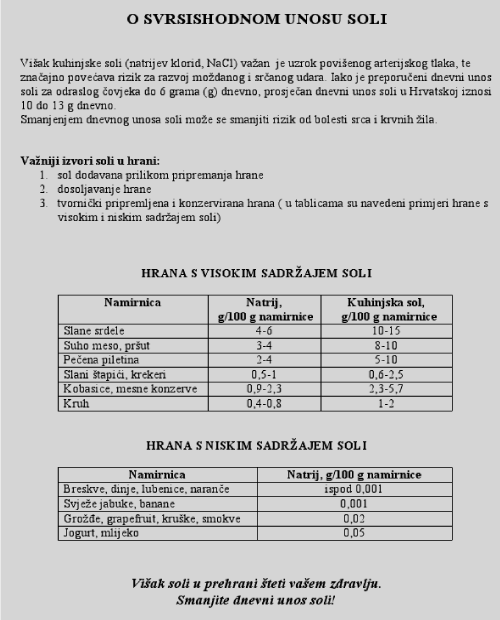
- Control group, which after discussion with their family doctor received an information leaflet about the harmful effects of excessive salt consumption (Figure 1),
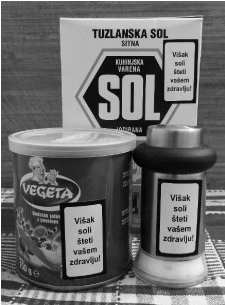
- Intervention group, which in addition to the aforementioned have received self-adhesive labels for home salt containers (e.g. salt shakers) with appropriate warnings (Figure 2), applied by a community nurse.

Figure 1. Printed informative leaflet about salt intake (in Croatian), handed to all the study participants
The evaluators were ignorant of the examinees’ allocation.
In individual test-list entered were general demographic data, and the results of BP measurement (standard mercury sphygmomanometry) and 24-hour urinary sodium excretion (Na24) [5] at the inception (0 month), after one month (1 month), after two months (2 month), and after twelve months (1 year). The sodium amount in each Na24 sample was determined with ion selective electrode and expressed in mmol/24 h.
The results were expressed as means and standard deviations (SD) in the tables, or standard errors of the means (SEM) in the diagram. The significance of the observed differences was tested by ANOVA, c2, Student’s t-test, and Mann-Whitney U test, as appropriate. The correlation between Na24 and BP was assessed with linear regression analysis. P<0.05 was considered significant.
Results
Of the 150 subjects included, this 12-month study completed 139 of them (92.7%): 69 in the control and 70 in the intervention group. There were no significant differences between the two groups, and the main peculiarities are shown in Table 1.
Table 1. Basic characteristics of the examinees
|
Control
group
(N= 69) |
Intervention
group
(N=70) |
Significance test |
P |
Age (years) |
58.7 ± 11 |
59.6 ± 13 |
t=0.02743 |
0.537 |
Gender (female/male) |
33/36 |
34/36 |
χ2=0.007 |
0.929 |
Body weight (kg) |
82.97 ± 11.8 |
85.2 ± 11.7 |
t=1.118 |
0.265 |
Body height (cm) |
177.6 ± 9.4 |
177.5 ± 9.7 |
t=0.066 |
0.954 |
Body mass index (BMI: kg/m2) |
26.3 ± 3.0 |
27.0 ± 2.8 |
t=0.493 |
0.898 |
Level of education (PSE/BME) * |
57/12 |
56/14 |
χ2=0.155 |
0.693 |
Antihypertensive drug intake
(range 1-4) |
2.1 ± 0.9 |
2.2 ± 1.0 |
Z**=0.622 |
0.574 |
*PSE = primary or secondary education, BME = bachelor or master degree; ** Z score in Mann-Whitney U test
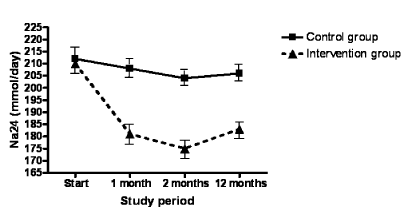
At the beginning of the trial Na24 was well over 200 mmol, averaging 211.1±78.7 mmol in the entire sample (Table 2). One month later Na24 dropped by some 29 mmol in the intervention vs. only 4.3 mmol in the control group. After two months, the achievement was similar (35 vs. 7.8 mmol), and persisted to the end of the trial, i.e. minus 26.5 vs. minus 5.7 mmol (Figure 3).

Figure 2. Warning labels on different salt containers, stating (in Croatian) “Too much salt is a health hazard”.

Figure 3. Graphic presentation of natriuria (Na24) during the trial. Symbols present arithmetic means, and error bars stand for standard errors of the means (SEM).
Table 2. Natriuria (Na24) in the control and intervention group during the trial
 Groups Groups
Na24* |
Control
(N= 69) |
Intervention
(N= 70) |
P
(t-test) |
0 month |
212.2 ± 70.0 |
210.0 ± 86.3 |
0.87 |
1 month |
207.9 ± 59.3 |
180.7 ± 63.3 |
0.01 |
2 months |
204.3 ± 58 |
174.9 ± 55.3 |
0.003 |
1 year |
206.5 ± 60.4 |
183.5 ± 51.6 |
0.017 |
ANOVA** |
F= 1.58; P= 0.19 |
F= 18.45; P <0.001 |
|
* Mean ± SD (mm Hg); ** One-way ANOVA refers to the columns, t-tests refer to the rows
Male participants, as already shown6, had notably higher Na24 than their female counterparts throughout the trial, e.g. 222.4±85.4 vs. 197.0±69.4 mmol; P= 0.047 at the inception, and 208.7±61.9 vs. 192.4±54.6 mmol; P= 0.233 (control) or 194.8±50.4 vs. 167.7±56.1 mmol; P= 0.037 (intervention group) after 12 months.
Similar, although less pronounced alterations were observed in BP. In the control group, practically no change was observed (Table 3). Conversely, in the intervention group a notable decrease in systolic (by over 5.5 mm Hg), diastolic (by some 2.2 mm Hg), and mean BP (by some 3.4 mm Hg or 3.3%) was registered throughout the study periods with minimal fluctuations (Table 4). Gender differences in BP were minor and statistically insignificant, while the observed BP lowering positively correlated with Na24 decrease over all the study periods (r= 0.598; P<0.001).
Table 3. Blood pressure results in the control group (N= 69)
Period |
Systolic (mm Hg ± SD) |
Diastolic (mm Hg ± SD) |
MAP* (mm Hg ± SD) |
0 month |
144.3 ± 17.8 |
84.3 ± 9.1 |
103.9 ± 13.1 |
1 month |
142.5 ± 18.4 |
84.4 ± 10.0 |
103.7 ± 13.5 |
2 months |
145.5 ± 16.2 |
83.4 ± 9.0 |
104.1 ± 12.3 |
1 year |
143.5 ± 14.8 |
83.8 ± 9.1 |
103.7 ± 11.2 |
Difference** |
- 0.8 |
- 0.5 |
- 0.2 |
ANOVA |
F=1.26 |
F=0.473 |
F= 0.375 |
P |
0.287 |
0.702 |
0.883 |
*MAP – mean arterial pressure, **Difference between month 0 and 1 year
Table 4. Blood pressure results in the intervention group (N= 70)
Period |
Systolic (mm Hg ± SD) |
Diastolic (mm Hg ± SD) |
MAP* (mm Hg ± SD) |
0 month |
142.8 ± 20.5 |
84.9 ± 10.0 |
104.2 ± 13.8 |
1 month |
138.6 ± 17.0 |
81.6 ± 8.5 |
100.6 ± 11.5 |
2 months |
137.4 ± 16.0 |
81.9 ± 8.2 |
100.4 ± 10.8 |
1 year |
137.1 ± 12.8 |
82.7 ± 7.6 |
100.8 ± 9.1 |
Difference** |
- 5.7 |
- 2.2 |
- 3.4 |
ANOVA |
F=8.43 |
F=6.65 |
F= 15.65 |
P |
<0.0001 |
0.0003 |
<0.0001 |
*MAP – mean arterial pressure, **Difference between month 0 and 1 year
Discussion
The participants in this trial were hypertensive patients already managed in family medicine. Although presumably all hypertensives in southern European family practice are warned about the harmfulness of excessive salt intake, the consumption is still very high, around 12 g per day [3,5]. The study was designed to evaluate the possible effects of intensified, oral, written, and graphic warning about the harmful effects of excessive salt intake, comparing two different levels of emphasized caveats on of urinary sodium excretion and BP control. Less intensive warning consisted of information, persuasion and distribution of relevant leaflets, and more intensive warning to those measures added stickers about harmful effects of excessive salt.
The average daily sodium excretion (24Na) in our sample of already treated hypertensive individuals was about 209 mmol before the intervention, corresponding to some 12.3 g of ingested salt per day. The enhanced warning resulted in considerable reduction in daily salt intake to an average of 175 mmol (9.7 g NaCl; reduction by some 16%) after 2 months and to 184 mmol (10.2 g NaCl; reduction by some 12%) after 12 months, and a significant BP reduction (e.g. by some 5.4/3.8 mm Hg after two months, and by some 5.7/3.4 mm Hg after one year). Such a marked decrease in BP and its persistence for at least one year is remarkable, and highly relevant for clinical practice7. Even better antihypertensive effect may be expected in an average hypertensive population since our patients were rather well controlled, taking already 2.2±0.9 antihypertensive agents5.
The male participants had significantly higher 24Na. The difference was expected because men have higher food and salt intake (heavier outdoor work, higher fast food intake, bigger body mass) [6]. After the intervention both sexes reduced their daily intake, but the gender difference persisted throughout the study.
Why were we more successful in long-term control of salt intake than in smoking cessation [4]? The answer possibly lies in the fact that tobacco is much more addictive [3,5].
This study has several limitations. The initial cohort of 150 enrolled patients was reduced to 139 (drop-out rate 7.4%) since 11 patients were inaccessible 12 months after the trial’s inception, and the registered data had to be recalculated. The observed, impressive effects of salt intake warning, lasting at least 12 months, should not be boldly extrapolated to any longer period of time. Moreover, at least a part of the achieved results, clearly visible in Figure 3, could be attributed to the Hawthorne phenomenon, to regression towards the mean or to the placebo effect.
Nevertheless, the striking difference between more intensive and less intensive warning favors the conclusion that the described results are real. The achieved reduction in salt intake, although amounting at some 15%, was only partial, remaining still well above the recommended levels. Such an intervention may not completely revert the dietary habits of a target population, but with persistence, continuous support and other complementary measures it may boldly contribute to the desired reduction in salt intake and improvement in hypertension control. Indeed, intensified warning markedly reduces salt ingestion in a long run, or answering to the Archie Cochrane's famous questions [8]:
1) Does it work? Yes, it does, decreasing salt ingestion/excretion by some 13% in 12 months.
2) Does it help? Yes, it does, decreasing the systolic BP in already treated hypertensive subjects by additional 4%, and the diastolic one by 2%.
3) Is it worth it? Yes, it costs pennies.
We conclude that enhanced warning with appropriate labels may have a significant impact on daily salt intake in a hypertensive community. This measure alone is unable to achieve the desired consumption of 5 g per day or less, but in addition to other interventions it may markedly decrease daily salt intake, lower prevalence and severity of arterial hypertension, and improve public health.
References
- He FJ, Li J, Macgregor GA (2013) Effect of longer term modest salt reduction on blood pressure: Cochrane systematic review and meta-analysis of randomised trials. BMJ 346: f1325. [Crossref]
- Edwards DG, Farquhar WB (2015) Vascular effects of dietary salt. Curr Opin Nephrol Hypertens 24: 8-13. [Crossref]
- Pinjuh Markota N, Rumboldt M (2015) Reducing salt intake by enhanced warning in family medicine. J Fam Med 2: 1025.
- Glavaš D, Rumboldt M, Rumboldt Z (2003) Smoking cessation with nicotine replacement therapy among health care workers: randomized double-blind study. Croat Med J 44: 219-24.
- Pinjuh Markota N, Rumboldt M, Rumboldt Z (2015) Emphasized warning reduces salt intake: a randomized controlled trial. J Am Soc Hypertens 9: 214-220. [Crossref]
- Pinjuh Markota N, Rumboldt M, Rumboldt Z (2014) Gender-related outcomes of emphasized warning in reducing salt intake [Spolne razlike naglašenog upozoravanja na smanjenje unosa soli – in Croatian]. In Rumboldt M, Petric D, eds. Proceedings of the 21st Croatian Family Medicine Congress [Zbornik XXI. Kongresa obiteljske medicine]. Split: HUOM, 2014:107-116.
- Sundström J, Arima H, Jackson R, Turnbull F, Rahimi K, et al. (2015) Effects of blood pressure reduction in mild hypertension: a systematic review and meta-analysis. Ann Intern Med 162: 184-191. [Crossref]
- Cochrane AL (1972) Effectiveness and efficiency: random reflections on health services. London: Nuffield PHT.


