atrial fibrillation, pulmonary vein isolation, extensive ablation, systemic inflammatory response syndrome
The pulmonary veins (PV) have been identified as the source of triggers initiating paroxysmal atrial fibrillation (AF) [1]. Contemporary catheter ablation techniques either use the electrical isolation of the limited segmental ablation at the PV ostia (venous-atrial junction) [2,3] or extensive burning approaches with the circumferential isolation of atrial tissue in the adjacent left atrium (LA) [4-6] sometimes supplemented by linear lesions between defined anatomical structures to interrupt macro reentrant circuits [7,8]. Identifying the impact of additional LA tissue ablation in modifying the maintaining substrate in the physiopathology AF process of persistent and permanent AF, even more, extensive ablation procedures have been supported, aiming LA strategic zones branded by complex fractionated potentials [9,10]. These extensive and extremely complex ablation designs are related with rare but overwhelming complications, as atrium-esophageal fistula [11,12] or vagal nerve damage, provoking acute pyloric spasm and gastric hypomotility [13], consequential from extra cardiac penetration of ablative power. A post cardiac injury syndrome has been reported, both following linear radiofrequency ablation in the LA for AF [14], as well as after catheter ablation for treat other arrhythmias [15], featuring a systemic inflammatory response syndrome (SIRS). This study was conducted at the Hospital e Clínica São Gonçalo, Rio de Janeiro, Brazil, where patients were recruited from the Artificial Cardiac Pacing Department. The study was approved by the Hospital e Clínica São Gonçalo Ethics Committee and was conducted in accordance with the principles of the Declaration of Helsinki. All patients signed written informed consent prior to study inclusion. The results are expressed as a mean and standard deviation for normally distributed data and as median with interquartile range otherwise. All statistical tests were two-sided. Comparisons between two-paired values were performed with the paired t-test in cases of a Gaussian distribution or by the Wilcoxon test otherwise. Comparisons between more than two-paired values were made by repeated-measures analysis of variance or by Kruskal–Wallis analysis of variance as appropriate, complemented by a post-hoc test. Categorical variables were compared with Fisher’s exact test. A P-value <0.05 was considered significant. Correlations between two variables were performed by Pearson’s chi-square test in case of a Gaussian distribution and with the Spearman correlation test otherwise. All statistical analyses were performed using the program Graphpad Prism v 7.0 (Graphpad Software, La Jolla, CA, USA).
We reported in this study 469 cases of AF ablation, performed from 2010 to 2016, being 397 cases of PV isolation only, and 72 extensive ablation procedures to treat more complex cases of AF. The general features of these patients are displayed in Table 1. From the total number of procedures, 18 cases developed SIRS, 3 (1%) patients after PV isolation only and 15 (21%) subjects after extensive AF ablation, as shown in Figure 1. Comparing both groups, the relative risk to develop SIRS after the procedure is 5.242 higher in the extensive ablation group, with 95% Confidence Interval (CI) ranging from 2.225 until14.980, and P<0.0001. The patients’ features during SIRS treatment post the ablation procedure in both groups are demonstrated in Table 2. The correlation between the PV isolation only and the number of ablated spots is weak: r=0.1888, 95%CI=0.092 to 0.282 and P=0.0002. However, the correlation between the extensive ablation and the number of ablated spots is stronger than the first one: r=0.7232, 95%CI=0.591 to 0.818 and P<0.0001. The Receiver Operating Characteristic (ROC) curve from the number of ablated spots presented an area under the ROC curve: 0.9726, 95%CI: 0.9221 – 0.9986, P<0.0001, sensitivity: 94%, specificity: 99%, cutoff point of ablated spots to occur the SIRS episode after the procedure: >191 points.
Table 1. Patients’ baseline characteristics
Parameters |
PVI |
Extensive ablation |
P value |
N |
397 |
72 |
--- |
Age, years |
58.3 ± 13.9 |
61.6 ± 17.0 |
0.0745 |
Body mass index, kg/m2 |
28.0 ± 3.6 |
28.6 ± 4.1 |
0.2038 |
Male gender (%) |
253 (64%) |
40 (56%) |
0.1891 |
White ethnicity (%) |
297 (75%) |
50 (69%) |
0.3810 |
Hypertension (%) |
300 (76%) |
60 (83%) |
0.1736 |
Hyperlipidemia (%) |
272 (69%) |
56 (78%) |
0.1259 |
Type 2 Diabetes Mellitus (%) |
150 (38%) |
20 (28%) |
0.1115 |
Coronary artery disease (%) |
90 (23%) |
12 (17%) |
0.2813 |
Atrial fibrillation |
397 (100%) |
72 (100%) |
1.0000 |
Creatinine, mg/dL |
0.90 ± 0.15 |
0.93 ± 0.17 |
0.1270 |
eGFR, mL/min/1.73 m2 |
94.3 ± 12.5 |
91.6 ± 13.7 |
0.0974 |
Albumin/creatinine ratio, mg/g |
12.5 ± 10.6 |
11.7 ± 8.5 |
0.5449 |
Antihypertensive |
|
|
|
ACE-inhibitors/ARB (%) |
260 (65%) |
51 (71%) |
0.4181 |
β blockers (%) |
290 (73%) |
51 (71%) |
0.7738 |
Diuretics (%) |
250 (63%) |
48 (67%) |
0.5962 |
DHP calcium channel blockers (%) |
177 (45%) |
36 (50%) |
0.4408 |
Mean 24-hour ABPM, mmHg |
139 ± 11/94 ± 4 |
141 ± 12/95 ± 6 |
0.1358/0.1306 |
Echocardiographic parameters |
|
|
|
Indexed LA volume (mL/m2) |
28.6 ± 3.5 |
41.4 ± 6.0 |
<0.0001 |
IST (mm) |
9.1 ± 1.8 |
9.4 ± 1.5 |
0.1834 |
LVPWT (mm) |
10.6 ± 1.9 |
11.0 ± 2.3 |
0.1129 |
LVEF, Simpson (%) |
62.5 ± 8.5 |
61.9 ± 8.1 |
0.5792 |
LEVDD (mm) |
50.8 ± 4.6 |
51.7 ± 5.3 |
0.1367 |
LEVSD (mm) |
32.5 ± 5.5 |
33.4 ± 7.7 |
0.2333 |
LV mass index (g/m2) |
167.4 ± 17.2 |
170.9 ± 23.0 |
0.1340 |
Data are presented as mean ± standard deviation or n (%). ABPM, ambulatory blood pressure measurements; ACE, angiotensin-converting enzyme; ARB, angiotensin receptor blocker; DHP, dihydropyridine; eGFR, estimated glomerular filtration rate; IST, interventricular septum thickness; LA, left atrium; LV, left ventricular; LVEDD, left ventricular end-diastolic diameter; LVEF, left ventricular ejection fraction; LVESD, left ventricular end-systolic diameter; LVPWT, left ventricular posterior wall thickness. N, number of patients; PVI, pulmonary vein isolation.
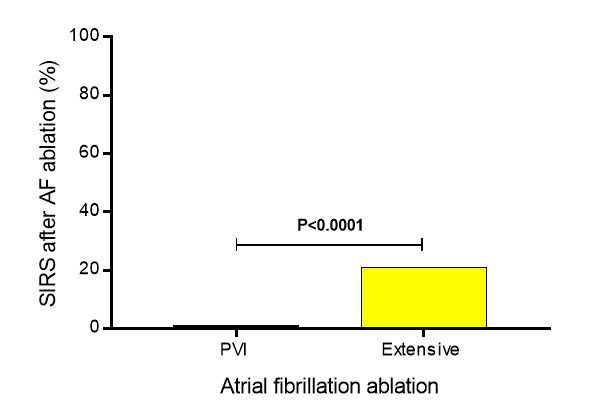
Figure 1. From the total number of procedures, 18 individuals developed SIRS, being 3 (1%) patients after PVI only and 15 (21%) subjects after extensive AF ablation, P<0.0001; AF, atrial fibrillation; PVI, pulmonary vein isolation; SIRS, systemic inflammatory response syndrome.
Table 2. Patients’ features during SIRS treatment post the ablation procedure
Parameters |
PVI |
Extensive ablation |
P value |
N |
3 |
15 |
--- |
Clinical parameters |
|
|
|
Dyspnea |
3 (100%) |
15 (100%) |
1.0000 |
Temperature, °C |
38.6 ± 0.8 |
39.5 ± 0.9 |
0.1370 |
Symptom onset, hours |
28.0 ± 18.3 |
18.4 ± 6.2 |
0.1000 |
Pulmonary congestion |
3 (100%) |
15 (100%) |
1.0000 |
Need for mechanical ventilation |
0 (0%) |
11 (73%) |
0.0429 |
Corticosteroids onset |
3 (100%) |
15 (100%) |
1.0000 |
Diuretic onset |
3 (100%) |
15 (100%) |
1.0000 |
Complete recovery, days |
9.5 ± 2.8 |
10.7 ± 4.0 |
0.5592 |
Laboratory tests |
|
|
|
Leukocytes, per μL |
17,797 ± 4,551 |
22,659 ± 5,902 |
0.1999 |
C-reactive protein, mg/dL |
31.7 ± 9.3 |
33.8 ± 8.4 |
0.7042 |
Negative blood cultures |
3 (100%) |
15 (100%) |
1.0000 |
Negative urine cultures |
3 (100%) |
15 (100%) |
1.0000 |
Creatinine, mg/dL |
1.53 ± 0.25 |
1.97 ± 0.41 |
0.0985 |
Chest tomography |
|
|
|
Bilateral edema |
3 (100%) |
15 (100%) |
1.0000 |
Pleural effusion |
0 (0%) |
11 (73%) |
0.0429 |
Electrocardiogram |
|
|
|
Sinus rhythm |
3 (100%) |
15 (100%) |
1.0000 |
Echocardiogram |
|
|
|
LVEF by Simpson’s method, % |
57.0 ± 2.6 |
55.1 ± 4.7 |
0.5185 |
Presence of pericardial effusion |
0 (0%) |
0 (0%) |
1.0000 |
Left atrium angiotomography |
|
|
|
Presence of pulmonary vein stenosis |
0 (0%) |
0 (0%) |
1.0000 |
Ablation procedure |
|
|
|
Mean number of ablated spots |
196.0 ± 4.6 |
228.9 ± 50.0 |
0.2831 |
Total procedure time, min |
256.7 ± 40.4 |
243.3 ± 42.4 |
0.6236 |
Total fluoroscopy time, min |
72.0 ± 7.2 |
60.7 ± 17.1 |
0.2876 |
3D electro-anatomical mapping system use |
3 (100%) |
15 (100%) |
1.0000 |
Radio frequency power, W |
36.7 ± 2.9 |
37.3 ± 4.6 |
0.8136 |
Catheter irrigation, mL |
1,900 ± 100 |
2,123 ± 243 |
0.1443 |
Values are presented as mean ± SD or %. LVEF, left ventricular ejection fraction; SIRS, systemic inflammatory response syndrome.
In conclusion, patients submitted to an extensive radio frequency ablation to treat AF are at higher risk than subjects underwent PV isolation only, for a possibly SIRS development post procedure. With supportive therapy, including mechanic ventilation, corticosteroids and diuretics administration this serious complication seems to be treatable, with resolution of the syndrome surrounded by 15 days.
- Haïssaguerre M, Jaïs P, Shah DC, Takahashi A, Hocini M, et al. (1998) Spontaneous initiation of atrial fibrillation by ectopic beats originating in the pulmonary veins. N Engl J Med 339: 659-666. [Crossref]
- Haïssaguerre M, Shah DC, Jaïs P, Hocini M, Yamane T, et al. (2000) Electrophysiological breakthroughs from the left atrium to the pulmonary veins. Circulation 102: 2463-2465. [Crossref]
- Arentz T, von Rosenthal J, Blum T, Stockinger J, Bürkle G, et al. (2003) Feasibility and safety of pulmonary vein isolation using a new mapping and navigation system in patients with refractory atrial fibrillation. Circulation 108: 2484-2490. [Crossref]
- Pappone C, Rosanio S, Oreto G, Tocchi M, Gugliotta F, et al. (2000) Circumferential radiofrequency ablation of pulmonary vein ostia: A new anatomic approach for curing atrial fibrillation. Circulation 102: 2619-2628. [Crossref]
- Verma A, Marrouche NF, Natale A (2004) Pulmonary vein antrum isolation: Intracardiac echocardiography-guided technique. J Cardiovasc Electrophysiol 15: 1335-1340. [Crossref]
- Ouyang F, Bansch D, Ernst S, Schaumann A, Hachiya H, et al. (2004) Complete isolation of left atrium surrounding the pulmonary veins: New insights from the Double-Lasso technique in paroxysmal atrial fibrillation. Circulation 110: 2090-2096. [Crossref]
- Oral H, Scharf C, Chugh A, Hall B, Cheung P, et al. (2003) Catheter ablation for paroxysmal atrial fibrillation: Segmental pulmonary vein ostial ablation versus left atrial ablation. Circulation 108: 2355-2360. [Crossref]
- Jaïs P, Hocini M, Hsu LF, Sanders P, Scavee C, et al. (2004) Technique and results of linear ablation at the mitral isthmus. Circulation 110: 2996-3002. [Crossref]
- Nademanee K, McKenzie J, Kosar E, Schwab M, Sunsaneewitayakul B, et al. (2004) A new approach for catheter ablation of atrial fibrillation: mapping of the electrophysiologic substrate. J Am Coll Cardiol 43: 2044-2053. [Crossref]
- Haissaguerre M, Sanders P, Hocini M, Takahashi Y, Rotter M, et al. (2005) Catheter ablation of long-lasting persistent atrial fibrillation: Critical structures for termination. J Cardiovasc Electrophysiol 16: 1125-1137. [Crossref]
- Pappone C, Oral H, Santinelli V, Vicedomini G, Lang CC, et al. (2004) Atrio-esophageal fistula as a complication of percutaneous transcatheter ablation of atrial fibrillation. Circulation 109: 2724-2726. [Crossref]
- Scanavacca MI, D’Avila A, Parga J, Sosa E (2004) Left atrial-esophageal fistula following radiofrequency catheter ablation of atrial fibrillation. J Cardiovasc Electrophysiol 15: 960-962. [Crossref]
- Shah D, Dumonceau JM, Burri H, Sunthorn H, Schroft A, et al. (2005) Acute pyloric spasm and gastric hypomotility: An extracardiac adverse effect of percutaneous radiofrequency ablation for atrial fibrillation. J Am Coll Cardiol 46: 327-330. [Crossref]
- Wood MA, Ellenbogen KA, Hall J, Kay GN (2003) Post-pericardiotomy syndrome following linear left atrial radiofrequency ablation. J Interv Card Electrophysiol 9: 55-57. [Crossref]
2021 Copyright OAT. All rights reserv
- Turitto G, Abordo MG Jr, Mandawat MK, Togay VS, El-Sherif N (1998) Radiofrequency ablation for cardiac arrhythmias causing postcardiac injury syndrome. Am J Cardiol 81: 369-370. [Crossref]