Nowadays, Advanced Therapy Medicinal Products (ATMPs) are new generation of pharmaceuticals which offer novel and revolutionary answer to be given to patients at the end of their therapeutic options. However, because of their prohibitive cost, they can only be proposed to a reduced number of patients. One possibility to reduce ATMP’ price is to automate their production as much as possible. Among the numerous possibilities, a real-time and closed loop monitoring of the T-cell growth during the expansion phase would be appreciated. In this short paper, we propose a simple white light spectroscopy method which can be easily implemented in such an autonomous device and able to monitor T-cell number evolution with a higher accuracy as compared to current cell counting methods.
T-cell culture, monitoring, white light spectroscopy, advanced therapy medicinal product
ATMP: Advanced Therapy Medicinal Product; EFS: Etablissement Français du Sang (French Blood Agency); FBS: Fetal Bovine Serum; OCM: Optical Concentration Model; OD: Optical Density; RPMI: Rosewell Park Memorial Institute medium; RSM: RPMI Supplemented Medium
Advanced Therapy Medicinal Products (ATMPs) recently emerged as new treatments for patients facing therapeutic dead ends. Genetic modification or tissue engineering is used to give living cells new physiological, biological characteristics or reconstruction properties. However, complex technologies of cell sorting, amplification, genetic transduction, amplification-division and activation are required to produce these new drugs. The whole process takes place in a controlled environment and numerous quality controls are performed throughout the production which can extend over one week. Consequently, the price of these promising therapeutic solutions restricts the possibilities to democratize their use for the greatest number of people. Devices developed during the recent years are not optimal due to the lack of online tracking technologies. Only few parameters such as temperature, pH or dissolved O2 are monitored using sterile probes placed inside the bioreactor. The PAT project (Process Analytical Technology) was born from this observation by the FDA in 2004. This project encourages research and development of new analysis technologies allowing a real time monitoring of all production stages of biopharmaceutical drugs. Concerning ATMPs, the whole production process is quite complex [1] and the above-mentioned quality controls are frequently performed, especially during the expansion phase [2,3]. Multiplying these controls, and therefore samplings, also increases the risk of introducing new contaminations. All this emphasizes the need to develop monitoring solutions which can easily be transposed in a close-loop system in order to provide a real-time cell growth monitoring and quality control.
Historically in cell culture, cell concentration estimation relies on directly measuring cell number, by counting them one by one, because the cell size makes it possible to directly observe them with common microscopes. On the contrary, absorption-based methods like turbidimetry or Beer-Lambert law derived techniques (optical density measurements for example) are usually preferred when considering smaller biological entities such as bacteria. Malassez cells are probably the most well-known technique used despite the fact that the visual and manual counting can be difficult and poorly reproducible due to the very small cell volumes sampled and therefore not representative of the culture flask. Alternative and commercial automated methods are available to facilitate cell counting.
Automatic cell counters have been developed and are commercially available. The LUNATM system (LOGOS BIOSYSTEMS) used in [4-6] requires 10 µL of cell solution. It is based on conventional imaging and image processing is used to count the imaged cells. Other systems developed by IPRASENSE are based on lensless imaging [7] in which diffraction figures of cells are recorded and analyzed to assess cell concentration. NORMA is a cell counter using 10µL whereas CYTONOTE is preferred to be used with adherent cells on larger volumes. They can reach higher accuracy thanks to the large investigating area (29.4 mm2) that lensless imaging technique allows. In addition, INCUCYTE® (SARTORIUS), used with both adherent and non-adherent cells [8,9], is an in-situ microscopy system based on holographic imaging designed to be used in an incubator (this is also the case for the HoloMonitor® system from PHI [10]). Here, cell counting can directly be performed within different flasks including 96 wells plates for high throughputs and/or multiple simultaneous experiments. Despite their easy use, these commercial systems seem difficult to integrate in a close-loop and real-time environment.
Other methods can also be used for both cells and subcellular entities qualification. Some of them are based on the capture of the biological entity at the surface of a biosensor in a ligand-analyte reaction. This is the case with the ELISA technique [11,12], SPR methods [13,14] and also Quartz Crystal Microbalances [15,16]. However, for all these methods, the need for a biological interface makes their transposition to a real-time measurement system difficult. Indeed, sensors’ surfaces must be regularly regenerated which prohibits their use in such a configuration. There exist other methods which can potentially be used without the need for a bio-chemical interface. Impedance spectroscopy (or dielectric spectroscopy) has been widely used during cell culture processes, particularly in the monitoring of mammalian cells [17]. This technique makes it possible to know the cell concentration thanks to their polarization following the application of an alternating electric field. It presents several significant advantages such as an in situ analysis of the cell culture and rapid measurements. However, this method suffers from some drawbacks such as the need for calibration and a decrease of the accuracy during the stationary phase of growth [18]. Raman spectroscopy could be more suitable and has already been demonstrated for agronomy or biology purposes [19], in particular during quality controls carried out on cell culture [20] and for pathogen detection [21]. However, Raman characteristics of cultured cells may not be required for cell concentration monitoring purpose. Flow cytometry can also be envisaged for cell counting [22,23] and cell activation detection [24]. Depending on the optical detection scheme employed together with the flow cytometer, counting cells and assessing some of their biological properties for quality control could be performed simultaneously. Adaptation in a close-loop system is straightforward if a derivation is added to the bioreactor as proposed in [2,3].
Indeed, cell counting methods described above all imply considering cells one by one in order to assess culture concentrations and most require sampling of small volumes poorly representative of what really occurs in the bioreactor. But, as long as only non-adherent cells are concerned, methods based on optical absorption measurement can potentially be performed on large sample volume [2,25,26]. The only condition is that the measurement does not require sampling which is possible using either derivation or sterilized optical probes. Using such methods means considering the global “light-culture” interaction rather than estimating concentration counting individual particles. In [2,3], we proposed proofs of concept using white light spectroscopy to measure B-cell concentration and possibly detect contaminations in real-time (the latter was not yet experimentally demonstrated). Detecting contamination is part of quality controls regularly performed during ATMP production. Another aspect of quality control concerns cell viability which can be optically estimated using statistical methods applied to absorbance spectra measurements in the UV-VIS range [27].
In this paper, we focus on cell growth monitoring and we present a simple white light spectroscopy system to monitor the evolution of T-cell concentrations over 1 week. 8 independent experiments of daily concentration measurements were performed using either the LUNATM automatic cell counter or white spectroscopy. On the last day, dilution ranges were prepared and used for determining an optical based absorption model. Accuracy and reproducibility of the spectroscopy optical method was then compared to that obtained using the automatic cell counter. This paper is organized as follows. The next section of the paper presents the material and methods used in our experiments from the biology and optics point of view. Experimental results will then be presented together with the description of the simple optical absorption model we used to estimate cell concentrations. After a section devoted to discussing our results, a conclusion and future work will be proposed.
CEM preparation: CEM cells (ATCC® CRL-2265TM) are T lymphoblasts supplied by the French Blood Agency (EFS Etablissement Français du Sang). They were grown in RPMI-1640 medium (P04-16515, PAN-Biotech®) supplemented with 25 mM HEPES (P05-01500, PAN Biotech®), 10% heat inactivated FBS (10270 -106, Fischer Scientific®) and 1% penicillin (10 kU.mL-1)/streptomycin (10 mg.mL-1) (FG101-01, TransGen Biotech®). The cells were maintained at 37°C in a humidified atmosphere containing 5% CO2.
Monitoring experiment protocol: Eight cell culture monitoring experiments were conducted. They last for a week according to the protocol presented in figure 1. At the end of the 5 first experiments, dilution ranges were prepared for establishing the optical spectroscopic absorption model. CEM cells were seeded on Day 1 and then resuspended in a T75 flask at a concentration of 5×10⁵ cells.mL-1 in 15 mL of supplemented RPMI (RSM). 3 mL of cell suspension were taken from the flask and transferred to sterile plastic cuvettes (C0793-100EA, Merck®) for spectral measurements; 3 cuvettes were prepared in order to have triplicates. Cell counting was carried out in the LUNA-II Automated Cell Counter (Logos Biosystems®) with trypan blue (V/V) (15250061, Fischer Scientific®) with 10 µL of cell suspension contained in the flask (3 independent measurements) as well as cell suspensions contained in each of the 3 cuvettes in order to measure the average concentration and determine a standard deviation.
Figure 1. Protocol used to study the optical monitoring of cell cultures. X3: triplicate. (Flask drawing from Eppendorf®, cuvette drawing from Brand.)
Spectral measurements were subsequently carried out on the 3 cuvettes. On Day 1, spectral measurements were performed on solutions directly collected from the flask. On days 2 to 5, sampled solution was diluted 3 times so that the absorption of the cuvette remains in the measurable spectroscopy range (between 20 and 80 % absorption). After measurements, the volumes of cell suspensions contained in the cuvettes were returned to the original flask and then kept in the incubator. 24 hours later, 1 mL of cell suspension present in the flask was introduced into a cuvette (3 times in order to obtain triplicates). 2 mL of RSM medium was added to each cuvette in order to lower cell concentration making the absorption spectra measurable. Cell counting as well as spectral measurements were carried out following the same protocol as the day before. This operation was repeated every 24 hours until Day 5.
Concentration ranges for optical absorption modeling: Different concentrations were prepared by diluting cuvettes in RPMI medium in order to obtain the following concentrations: 106, 9×10⁵, 8×10⁵, 7×10⁵, 6×10⁵, 5×10⁵, 4×10⁵, 3×10⁵, 2×10⁵ and 106 cells.mL-1. The goal was to obtain data for estimating the mathematical absorption properties of the cells at various concentrations. The cell suspension from the “monitoring cells” was recovered on Day 5 at the end of the experiments and used for this purpose. 3 cell counts and one spectral measurement were performed with each cuvette for mathematical modeling purposes.
Spectroscopic absorption measurements: Spectral absorption measurements of CEM suspensions were performed using the experimental set-up shown in figure 2. The spectroscopy measuring system consists of a light source (AvaLight-DH-S-BAL, Avantes®), connected by optical fibers (Thorlabs M25L01) to a cuvette holder (Avantes CUV-UV/VIS). The white light source was switched on about 30 min before measurements in to be cleared to allow temperature and spectral characteristics stabilization. After propagation through the cuvette, the light was transmitted to the spectrophotometer (Ocean Optics USB 4000 UV-VIS-ES) for spectra acquisition. Before each measurement, a reference spectrum was acquired using a cuvette containing RPMI medium. Spectra were recorded in transmission, in the wavelength range 177 nm and 892 nm with a step of 0.22 nm using the OceanView software.
Figure 2. Experimental set-up used for measuring absorption spectra
Spectral data processing: The spectral data were recorded into a text file then transposed to Excel. The data obtained in transmission were converted into absorption percentage and all calculation were performed using MatlabTM R2020b software. Only wavelengths between 330 nm and 860 nm were considered in order to eliminate measurements with a high background noise. Artefacts due to energetic emission peaks of the deuterium lamp were numerically removed. Regularly, absorption spectra of neutral densities (THORLABS NE05B and NE10B) were recorded and compared to the supplier’s data to ensure correct absorption spectra measurements. Spectra maxima were determined after spectra were slightly smoothed using cubic spline MATLABTM functions. Other spectroscopy signal treatments were performed on raw spectra.
This section illustrates the experimental results obtained during the 8 experiments. Concentration ranges were prepared during the 5 first weeks; monitoring experiments were conducted during 8 weeks. For simplicity purpose, only results concerning week 15 are reported here because they are representative of what the results obtained every week. Data obtained during all weeks are available on demand.
Cell culture monitoring using the automatic cell counter: As previously mentioned, T-cells were grown during a week and daily concentration measurements were performed. Concentrations were first measured using 10 µL sampled directly from the culture flask. Sampling and measurements were repeated 3 times. Second, concentrations were measured using 10 µL sampled from 3 spectroscopy cuvettes (Figure 1 and Figure 2). The results obtained during week 15 are shown in figure 3a where black circles and blue crosses correspond to data related to the flask and the cuvettes respectively.
Figure 3. Comparison of cell number obtained through concentration measurements by the automatic cell counter from flask and cuvette during week 15. (a) Number of cells measured every day. 2 triplicates per day: 1 with sample from the flask (black circle), 1 from sample from the cuvettes (blue crosses). (b) Box and Whiskers plots representing the standard deviations of week 15 data. On each box, the central red mark indicates the median, and the bottom and top edges of the box indicate the 25th and 75th percentiles, respectively. The whiskers extend to the most extreme data points
It can clearly be observed that data exhibit dispersion increasing with time, i.e. with the number of cells. Moreover, data dispersion is larger when sampling from the cuvette than from the flask. This is clearly visible on figure 3b where standard deviations (SDs) are reported as Box and Whiskers plots. To obtain the SD relative to the flask, the SD on day 1 was measured and expressed in terms of percentage, therefore generating 5 SD values for the flask at the end of the week. They were used to draw the “flask” Box and Whiskers plot. The same calculation was performed for the cuvette. On each box, the central red mark indicates the median, and the bottom and top edges of the box indicate the 25th and 75th percentiles, respectively. The whiskers extend to the most extreme data points. The mean SD and dispersion are smaller for the flask than for the cuvette (about 8% against 20%; figure 3b).
In order to compare data obtained with the automatic cell counter to those obtained using white light spectroscopy, it is necessary to establish the relation between cell concentration and spectroscopic properties of the cell suspensions.
Concentration range and spectroscopic behavior: The goal was to measure the absorption spectra of cell solutions at different concentrations and to express the cell concentration as a function of the spectral behavior. In what follows, we refer to it as “optical concentration model (OCM)”. Overall 5 concentration ranges were used to establish the OCM. An example of such absorption spectra is shown on figure 4a. Data indicated in the legend correspond to mean concentrations measured with the cell counter. Black stars correspond to the maxima positions and values of each individual spectrum. Values of the maxima and their positions were computed from slightly smoothed spectra although raw spectra are drawn on figure 4a. It should be noted that the positions of the maxima evolve with the maxima values. This was observed in all experiment as shown on figure 4b. Here, data are fitted with a linear regression with R2=0.61. This means that this evolution is not necessarily linear.
Figure 4. Establishment of the Optical Concentration Model. (a) Raw spectra obtained during week 15. Black stars refer to the maximum of each spectrum. (b) Relationship between maxima values and maxima positions during 8 weeks. (c) Maxima vs. concentration recorded during all experimental sessions. Concentrations are measured using the automatic cell counter (10 cuvettes per week, 3 measurements per cuvette). Red stars represent the mean maxima value for each triplicate
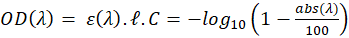
Black stars reported on figure 4a highlight spectra maxima values used to establish the OCM regardless of their position. This slightly differs from calculating the optical density at a fixed wavelength and correlating it to the concentration (from Beer-Lambert law) or to correlate the concentration to the solution transmission (turbidity). The OCM is established as follows. The Beer-Lambert law relates the optical density to the concentration of a species in solution by means of a simple linear relationship:
 -------(1)
In this expression, OD represents the optical density (unitless),  the length of the spectroscopy cuvette (in cm, generally 1 cm), ε the molar extinction coefficient, also termed molar absorptivity (in L.mol-1.cm-1) and C the concentration (in mol.L-1). The molar extinction coefficient and therefore the OD, depends on the wavelength. It is possible to relate the OD directly to the transmittance T(λ).
 -------(2)
In our experiments, spectra are expressed in percentage of absorption and not transmission nor absorbance. We then have:
 -------(3)
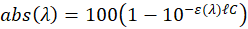
In this expression,  represent the absorption spectrum expressed in percentage. It is now straightforward to deduce:
 -------(4)
The value of the absorption maximum is therefore:
 -------(5)
In this expression,  represents the maximum of the molar extinction coefficient.
We then deduce:
 -------(6)
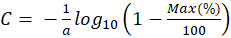
Thus, the concentration and the maximum absorption are expressed relative to each other with the only coefficient "a". The latter is related to the molar absorption coefficient as follows.
 -------(7)
In this expression,  is the Avogadro number and
  is the length of the spectroscopy cuvette.
The monitoring we propose is based on the spectroscopic measurements of cell concentrations. To achieve this, the value of “a” must be determined. Each dilution range was composed of 10 solutions. Absorption spectra of the overall 50 diluted solutions were recorded and their maxima computed. For each of them 3 measurements of their concentrations were performed with the automatic cell counter. Red stars in figure 4(c) represents the 50 couples (maximum, concentration). Equation (6) is then used to fit these experimental data. Result of the fitting is drawn with a blue curve on figure 4c. The result is that, with this culture protocol, the value of the “a” coefficient is a = (7.5±0.2)×10-7 mL.CEM-1 calculated with R2=0.98. The corresponding molar extinction coefficient is then = (4.52±0.13)×1014 L.mol-1.cm-1.
Cell culture monitoring using white light spectroscopy
On a daily basis, flask contents were sampled in 3 different spectroscopy cuvettes and absorption spectra were recorded. Figure 5a shows spectra recorded during week 15. Solutions sampled on days 2 to 5 were diluted 3 times in order to keep the absorption in the validity range of the spectral measurement. Spectra recorded on day 1 (black on the figure) are obtained with non-diluted samples. Therefore, the superposition of data from Day 1 and Day 4 is purely fortuitous.
Figure 5. Monitoring the cell number using white light absorption spectroscopy. (a) Raw spectra recorded during week 15. Colors refer to days, spectra recorded the same day are drawn with the same color. (b) Total number of cells calculated using the OCM (red stars) compared to counts obtained from the flask and the cuvette with the automatic counter
Figure 5a shows that the reproducibility and the accuracy of the spectroscopic measurements are extremely good. This is confirmed when calculating the number of cells in the flask using the OCM. The result is shown on figure 5b where spectroscopic measurements are plotted with red stars together with results obtained with the automatic cell counter already presented in figure 3a. SDs measured during week 15 with the OCM show a median value less than 2% with extreme values at 0.4% and 3%. These values should be compared to those presented in figure 3b. SDs corresponding to all experiments are reported on figure 6. On each box, the outliers are plotted individually using red crosses.
Figure 6. Box and Whiskers plot representing the SDs measured during the 8 monitoring experiments (expressed in %). The outliers are plotted individually using red crosses
It is observed that the spectroscopic measurement lead to the lowest median value (2%) while the median values obtained with the automatic counter are much larger (8.5% for the flask and 10% for the cuvette). Also, data dispersion appears to be larger when sampling the solution from the cuvette than directly from the flask.
Exponential evolution of cell number: As highlighted on figure 5(b), the number of cells in the flask evolves exponentially with time as expected. This evolution can be described by:
 -------(8)
In this expression, N0 represents the initial number of cells in the flask and b is a coefficient related to the time t2 needed for the cells to divide. This dividing time is given by:
 -------(9)
Figure 7 shows data obtained during week 15 fitted with equation (8) applied to cell numbers measured from the flask, the cuvette and spectroscopically respectively. For this example, the R2 of the fittings were 0.97, 0.92 and 0.99 for flask, cuvette and spectroscopy respectively. The initial numbers of cells reported result from fitting data concerning the flask, the cuvette and the spectrometer. Flasks were initially seeded with a CEM concentration of 5×10⁵ CEM.mL-1. The volume of the initial culture being 15 mL, this represents a theoretical initial number of cells equal to 7.5×10⁶ cells. It can be noted that, whatever the counting method is, the observed initial number of cells is higher than the theoretical one. Considering the 8 experiments, the lowest initial number of cells was in fact 6.9×10⁶ cells while the maximum one was 1.8×10⁷ cells.
Figure 7. Fitting experimental data obtained during week 15 with exponential functions. Initial numbers of cells calculated from fittings are reported
Dividing times have been determined from the fitting of spectroscopic data. They range from 30 to 50 hours. Finally, a weak correlation was also noticed between the dividing times and the initial numbers of cells (figure 8) with a correlation coefficient R2=0.87. On figure 8, data were fitted with an exponential function for illustration purpose. The low value of the R2 makes it impossible to conclude that the evolution is actually exponential.
Figure 8. Evolution of the dividing times with the initial number of cells
The discussion section is divided in 3 sub-sections concerning the OCM, the monitoring experiments and the integration possibilities allowed by the proposed technique.
Modeling the optical absorption of T-cells: The OCM established here is derived from the Beer-Lambert law. It does not rely on measuring the absorbance of a solution at a fixed wavelength but uses the maximum value of the absorption spectra expressed in percentage and this, regardless of the maximum position. Indeed, as shown on figure 4a, the position of the absorption spectra maxima increases with the cell concentration. This tendency was observed for the 5 dilution ranges used to establish the OCM as illustrated on figure 4(b). The fact that the position of the absorption maxima evolves with the concentration makes the measurement at a fixed wavelength a bit difficult to justify. It was then chosen to use the values of the true maxima instead of the absorption value at an arbitrary wavelength, i.e. with no real spectroscopic meaning. But it is acknowledged that a model based on the absorption at any particular wavelength is possible.
However, exploiting the information contained in the whole absorption spectrum (or absorbance, transmittance etc.) may offer supplementary possibilities. For example, in [24], authors studied the OD over a wavelength window ranging from 270 nm to 340 nm. They related the absorbance to cell concentration and applied their technique to both adherent and non-adherent cells. A wavelength window a bit larger was used in [27]. Authors exploited the absorbance spectrum between 210 nm and 600 nm in order, not only to count cells, but also to estimate their viability. They conducted experiments using CHO K1 cells and they presented absorbance spectra different from the ones presented here (after conversion of our data in OD). The main feature they observed occurred in the UV region not investigated in our case. The maxima we observed with T-cells occur around 520 nm. It is not yet clear whether or not the spectra differences can be imputed to the type of cells used in the experiments.
We propose an OCM which relates concentration to maximum absorption using a sigmoidal function. Only one parameter is required, the “a” parameter, which is directly related to the cell’s molar extinction coefficient. We measured the accuracy of this model in two ways. We first applied the OCM to the spectra used to establish it (i.e. the 5 concentration ranges we used). At the central concentration value, about 6×10⁵ CEM/mL, the accuracy is about 7%. The data are not shown here but are available on demand. This relatively good accuracy is due to the fact that the model was tested on data which have been used to establish it. While testing the OCM to other concentration ranges, the accuracy is only 15% while 20% accuracy is still acceptable (personal communication with the French Blood Agency). In all cases, at the end of the production process, a final cell counting is performed to adjust the dose to be injected to a particular patient. Knowing the weight of the patient, production should be planed until a cell excess of 15% is reached.
The OCM relies on the “a” parameter. We found “a” equal to 7.5×10⁻⁷ mL.CEM-1 which means that the molar extinction coefficient T-cells grown here is = 4.52×10¹⁴ L.mol-1.cm-1. We did not find such a value in the literature, we then cannot certify it. However, it is acknowledged that the cell properties, among which their optical properties, depend on the culture protocol. For T-cell grown with a different protocol (when adding new culture medium only once at the middle of the week), we measured a molar extinction coefficient equal to 7.2×10¹⁴ L.mol-1.cm-1. There may be two reasons for this difference. First, the differences in the protocols used in these two experiments and second, the medium used to measure absorption spectra. Indeed, in the experiment presented here, spectra are directly recorded with samples from the flask. The reference spectrum is recorded with 3 mL of culture medium. In the experiment which led to a higher absorptivity, cells were extracted, centrifuged and suspended in the PBS buffer. Spectra were then recorded, and reference was made with this buffer. We still don’t know if the difference in absorptivity is due to the different protocols or to cell modification induced by the medium they are suspended in. Overall, it seems better to establish an OCM for each protocol. Therefore, the method we propose should be preferred when protocols are stabilized.
Monitoring T-cells growth: Figure 6 shows the SDs of the experiments using Box and Whiskers plots. The meaning of it worth to be discussed. In these boxplots, the red line represents the median of the SDs calculated for each triplicate. It is directly related to the accuracy of the method used to count the cells. The span, i.e. the difference between the maximum and the minimum SD, is a bit more difficult to describe as it refers to the variability of the SD over all experiments. It is partially related to the experimental variability, how the solutions are homogenized before sampling and how what is sampled is representative of what really exist in the culture flask. The span is also related to the variability inherent in experimentation on living cells. The latter increases with time as it can be seen on figure 5b.
When suspensions are measured using the automatic cell counter, a median SD of about 10% is observed (note that the median SD is roughly equal for the flask and the cuvette). When using spectroscopic means, the median SD decreases to 2%. Meanwhile, the span is larger for the cuvette than for the flask. This is because only one sampling is required (from flask to counter) when measuring directly from the flask while two are necessary (flask to cuvette and cuvette to counter) to measure from the cuvette which cumulates possible uncertainties. This makes the above-mentioned variability more visible. As expected, the span observed when using white light spectroscopy is much lower because the measurements are made on a much larger volume.
In order to compare methods, cell counting with the LUNATM device relies on visualizing a few hundreds of cells. Large field lensless or holographic imaging allows analyzing a few thousands of cells (IPRASENSE or PHI instruments). Our cuvette holder is equipped with lenses leading to an optical beam diameter of about 4 mm in the 1 cm length cuvette. Considering a mean concentration of 105 cells.mL-1, this represents a few tens of thousands of cells. In fact, because we consider a derivation of the bioreactor’s content, we can monitor the cell number with a large volume and therefore a better accuracy. Furthermore, the derivation implies putting the culture in motion which increases the homogeneity of the solution and therefore the accuracy of the measurement figure 7.
Cell counting accuracy is not the only advantage of agitating the culture. Figure 7 shows the exponential increase of cell number during the week. The exponential behavior is normal because one cell divides into two daughter cells, themselves capable of giving rise to two other daughter cells. The exponential increases we computed lead to dividing times ranging from 30 to 50 hours while manufacturer indicates about 26 hours [28]. The growth protocol we used was defined for monitoring purpose. It does not necessarily correspond to the optimal cell culture protocol. However, dividing times we measured are similar to those presented in [29] where the effect of agitation on CAR-T cells growth is studied. In this work, the observed dividing times with static CAR-T cells cultures were 43h00±5h50 while we measured 38h30±6h30. They also demonstrate that agitation reduced the dividing time. Agitation at 300 rpm leads to dividing times of 35h50±0h50. In fact, agitation is used in the CliniMACS Prodigy® Instrument (Miltenyi Biotec) [30], as well as by the French Blood Agency in their protocols involving T-cells. In any case, agitation seems to be a better option to reduce the dividing time and improve solution homogeneity and OCM accuracy.
Figure 8 shows that the dividing times increase with the initial number of cells. This means that cells grow more slowly when they are numerous. This is in accordance with the cell growth kinetics which exhibits different phases. Among them, the exponential phase which continues until changes in the environment like depletion of nutrients and increase of waste metabolic products lead to a stationary phase [31]. The evolution we observe on figure 8 is then logical because a larger number of cells places the culture closer to the stationary phase conditions.
Integration possibility: For a practical integration, it seems that any method requiring a biochemical interface (ligand-analyte interaction for example) should be avoided. Sensor’s surface regeneration without risk of polluting the bioreactor contents may be a real bottleneck.
Optical methods allow contactless measurements on large volumes. The condition is to use either absorption probes or solution derivation [2,3]. The latter should be preferred as it is contactless, improves solution homogeneity, hence the OCM accuracy, and decreases the dividing times. In references [24] and [27], optical spectroscopy is performed in the UV-visible range. In our method, the OCM is established between 350 nm and 850 nm, but the main information is contained between 400 nm and 700 nm. This makes it possible to use low cost visible LEDs and ultra-compact spectrometers such as proposed by [32,33] instead of working within the UV range [24,27]. In this case, the design of the spectroscopy cuvettes could be inspired by the one already described [34].
In this paper, an easy-to-implement white light spectroscopy method to monitor cell cultures was presented. Examples concerning T-cell culture concentration measurements showed accuracy and reproducibility higher than using automatic cell counters, mainly because measurements are performed on large volumes. For this, a white light spectroscopic model of the culture absorption has been developed. It relies on measuring cell optical absorption spectra maxima. Cell culture monitoring performed during 8 experiments highlighted an exponential increase of cell number and dividing times correlated to those already published and possibly further reduced by agitating cell culture. This can be automatically done if a derivation of the bioreactor is considered. Because white light spectroscopy is performed in the visible range, the use of compact and low-cost components can be used to propose a highly integrated method to monitor cell cultures.
This spectroscopic monitoring method can be easily transposed to a real-time measurement and closed loop system which avoid regularly sampling of bioreactor content to measure cell concentration and to check the existence of possible contaminations. Current developments deal with the fabrication of a demonstrator and the use of information from the white light absorption spectra in order to establish a real time quality control. Indeed, monitoring and quality controls could be performed simultaneously since both rely on the only acquisition of the absorption spectra. This would allow a real time detection of ATMP production dysfunction and could be used to stop an useless production early, hence saving a considerable amount of money. Having such a system would be of great interest in terms of research, industrial manufacturing and more importantly in terms of benefit to patients.
This work was supported by the MiMedI project funded by BPI France (grant No. DOS0060162/00) and the European Union through the European Regional Development Fund of the Region Bourgogne-Franche-Comte (grant No. FC0013440).
There is no conflict of interest.
- Wang X, Riviere I (2016) Clinical manufacturing of CAR T cells: foundation of a promising therapy. Mol Ther Oncolytics 3: 16015. [Crossref]
- Wacogne B, Legrand D, Azzopardi CL, Pieralli C, Frelet-Barrand A, et al. (2021) Optical spectroscopy methods to monitor cells and bacteria concentrations and to detect contamination during cell culture: application to the fabrication of ATMPs, In: Ye X. et al. (eds) Biomedical Engineering Systems and Technologies. Communications in Computer and Information Science, Springer Book Series 1400: 53-75.
- Wacogne B, Legrand D, Pieralli C, Frelet-Barrand A (2020) Optical Spectroscopy for the Quality Control of ATMP fabrication: A new method to monitor cell expansion and to detect contaminations, In Proceedings of the 13th International Joint Conference on Biomedical Engineering Systems and Technologies (BIOSTEC 2020) 1: 64-72.
- LoE KK, Lee PC, El-Nezami H (2021) Low dose of zeralenone elevated colon cancer cell growth through G protein-coupled estrogenic receptor. Scientific Reports 1: 7403. [Crossref]
- Kumar V, Al-Momin S, Vanitha VK, Al-Aqeel H, Al-Musallam L, et al. (2019) Evaluation of Various Growth Conditions for the Cultivation of Microalgae Species in the Arid Regions. Journal of Mech of Cont and Math Sciences 4: 255-265.
- Gauchotte G, Hergalant S, Vigouroux C, Casse JM, Houlgatte R, et al. (2017) Cytoplasmic overexpression of RNA-binding protein HuR is a marker of poor prognosis in meningioma, and HuR knockdown decreases meningioma cell growth and resistance to hypoxia. J Pathol 242: 421-434. [Crossref]
- https://www.iprasense.com/
- Empower your research with IncuCyte® Live-Cell Analysis Systems. https://www.sartorius.com/en/products/cell-analysis/incucyte-live-cell-analysis-system.
- IncuCyte® S3 Live-Cell Analysis System. https://www.youtube.com/watch?v=ugbPMrFrYWE.
- https://phiab.com
- Engvall E, Perlman P (1971) Enzyme-linked immunosorbent assay (ELISA). Quantitative assay of immunoglobulin G. Immunochemistry 8: 871-874.
- Goldsby RA, Kindt TJ, Osborne BA, Kuby J (2003) Enzyme-Linked Immunosorbent Assay, Immunology, 5th edition. 148-150.
- Nguyen TT, Trinh KTL, Yoon WJ, Lee NY (2016) Integration of a microfluidic polymerase chain reaction device and surface plasmon resonance fiber sensor into an inline all-in-one platform for pathogenic bacteria detection, Sensors and Actuators B: Chemical 242: 1-8.
- Karlsson R, Stahlberg R (1995) Surface plasmon resonance detection and multispot sensing for direct monitoring of interactions involving low-molecular-weight analytes and for determination of low affinities. Analytical Biochemistry 228: 274-280. [Crossref]
- Tsong-Rong Y, Chao-Fa L, Hung-Che C (2012) QCM as Cell-Based Biosensor. Chemical Biology 5: 411-434.
- Wudy F, Multerer M, Stock C, Schmeer G, Gores HJ, et al. (2008) Rapid impedance scanning QCM for electrochemical applications based on miniaturized hardware and high-performance curve fitting. Electrochimica Acta 53: 6568-6574.
- Cole H, Demont A, Marison I (2015) The Application of Dielectric Spectroscopy and Biocalorim-etry for the Monitoring of Biomass in Immobilized Mammalian Cell Cultures, Processes 3: 384-405.
- Downey BJ, Graham LJ, Breit JF, Glutting NK (2014) A novel approach for using dielectric spectroscopy to predict viable cell volume (VCV) in early process development, Biotechnol Progress. 30: 479-487.
- Esmonde-White KA, Cuellar M, Uerpmann C, Lenain B, Lewis IR (2017) Raman spectroscopy as a process analytical technology for pharmaceutical manufacturing and bioprocessing. Anal Bio-anal Chem 409: 637–649.
- Calvet A, Ryder AG (2014) Monitoring cell culture media degradation using surface enhanced Raman scattering (SERS) spectroscopy. Analytica Chimica Acta 840: 58-67.
- Yoo SM, Lee SY (2016) Optical Biosensors for the Detection of Pathogenic Microorganisms. Trends in Biotechnology 34: 7-25. [Crossref]
- Maryamchik E, Gallagher KM, Prefer FI, Kadauke S, Maus MV, et al. (2020) New directions in chimeric antigen receptor T cell CAR-T therapy and related flow cytometry, Cytometry Part B. Clinical Cytometry 299-327.
- Pitoiset F, Cassard L, El Soufi K, Boselli L, Grivel J, et al. (2018) Deep phenotyping of immune cell populations by optimized and standardized flow cytometry analyses, Cytometry part A 93A: 793-802.
- Aijaz A, Trawinski D, McKirgan S, Parekkadan B (2020) Non-invasive cell counting of adherent, suspended and encapsulated mammalian cells using optical density. BioTechniques 68: 35-40.
- Sanjay M Nilapwar, Maria Nardelli, Hans V Westerhoff, Malkhey Verma (2011) Chapter four - Absorption Spectroscopy, 2011, Editor(s): Daniel Jameson, Malkhey Verma, Hans V. Westerhoff, Methods in Enzymology. Academic Press 500: 59-75.
- https://en.wikipedia.org/wiki/Absorption_spectroscopy.
- Drieschner T, Ostertag E, Boldrini B, Lorenz A, Brecht M, et al. (2020) Direct optical detection of cell density and viability of mammalian cells by means of UV/VIS spectroscopy. Analytical and Bioanalytical Chemistry 412: 3359-3371. [Crossref]
- https://www.atcc.org/products/crl-2265
- Costariol E, Rotondi MC, Amini A, Hewitt CJ, Nienow AW, et al. (2020) Demonstrating the Manufacture of Human CAR-T Cells in an Automated Stirred-Tank Bioreactor. Biotechnol J 15: 2000177. [Crossref]
- https://www.miltenyibiotec.com/US-en/products/clinimacs-prodigy.html
- Gutiérrez-Correa M, Villena G (2010) Characteristics and techniques of fermentation systems, 2010, in book: Comprehensive Food Fermentation and Biotechnology, First Edition, Chapter 7, Vol. 1, Asiatech Publisher, Inc. New Delhi 183-227.
- https://store.yujiintl.com/products/vtc-series-smd-5730?variant=6510207425.
- https://www.hamamatsu.com/eu/en/product/optical-sensors/spectrometers/mini-spectrometer/index.html
- https://www.dutscher.com/frontoffice/article/139040#