Abstract
Background: Liver fibrosis is now considered as a reversible disease. Curing the primary hepatic disease doesn’t mean fibrosis improvement and steatosis could be one of the reasons responsible for this failure. Loss of weight has shown to improve fibrosis but few data is available from Egypt.
Objective: to test the effect of weight reduction on the degree of fibrosis improvement in Egyptian patients with chronic hepatitis C (CHC).
Methods: Adult patients (> 18 years) with moderate and severe steatosis who were initially investigated by liver biopsy and FibroScan to assess their stage of fibrosis before starting interferon treatment, were reassessed by FibroScan after losing ≥ 10% of their weight. All patients were recruited from hepatitis C clinic, National Liver Institute (NLI), University of Menoufyia, Egypt from 2011 to 2014.
Results: Thirty CHC patients were included in the study, 20 patients with moderate and 10 with severe steatosis. Median age was 44.7 years (29-59 years) with equal sexes. The degree of fibrosis and its values improved significantly with weight loss (Mean ± SD was 13.81 ± 7.5 kPa before and 10.98 ± 5.6 kPa after losing weight, p < 0.01). Three patients (10%) with severe fibrosis were down-graded to F3 and F2 after weight loss (two and one patients, respectively).
Conclusion: Weight reduction is associated with improvement of hepatic fibrosis in Egyptian patient with CHC.
Key words
Egypt, Fibrosis, Weight loss, Fibroscan, HCV
Introduction
Obesity and its direct consequence nonalcoholic fatty liver disease (NAFLD) rates are increasing dramatically worldwide and steatosis becomes one of the most common hepatic histological findings [1]. Steatosis was found to be associated with liver fibrosis especially in chronic hepatitis C (CHC) with positive correlation between its grade and the fibrosis stage [2,3].
Liver fibrosis is a dynamic progressive process as long as the hepatic injurious stimulus wasn’t treated. It was considered irreversible in the past but the current studies showed that fibrosis [4-6], and even cirrhosis [7,8] in some series, could be reversible.
Our study was aimed to compare the degree of hepatic fibrosis in overweight patients with CHC before and after weight loss achieved by diet and exercise, which is considered as the standard treatment of steatosis [9,10].
Methods
Adult patients (>18 years) were recruited from hepatitis C clinic, National Liver Institute (NLI), University of Menoufyia, from 2011 to 2014. Standard available treatment at that time was pegylated interferon with ribavirin, after that time we started our new protocol of treating CHC with direct acting antiviral therapies. The assessment process necessitated doing liver biopsy and transient elastography (FibroScan). All patients with alcoholic history, uncontrolled DM or endocrine dysfunction were excluded by the protocol and redirected to special clinics for better management and reassessment. The NLI protocol asked the patient with moderate or severe steatosis to lose at least 10% of his weight by food diet and practicing exercises, to improve the response to treatment. Patients were advised to follow a diet regimen of 20% protein, 50% carbohydrate and 30% unsaturated fats prescribed by dietitian taking in consideration the different age, sex and the lifestyle of the patients with target of energy reduction of about 25 kcal/kg/day. They were also advised to practice exercise in the form of walking one hour 5 days per week. None of our patients received any medication to reduce his weight. FibroScan was done again to reassess the patient’s hepatic fibrosis stage after losing weight without the need for re-biopsy.
Our retrospective study was conducted on those naïve patients eligible for interferon treatment who succeeded to lose the desired weight. We had thirty patients to be involved in the study after excluding files with incomplete data and patients with BMI > 40 kg/m2, as that could affect the FibroScan result. None of our patients was alcoholic, diabetic or manifesting endocrinal dysfunction during the study.
Our study was approved from the ethical committee, NLI, University of Menoufyia.
BMI was calculated as defined by WHO [11]: bodyweight in kilograms divided by height in meters squared.
All liver biopsy specimens were analyzed according to METAVIR scoring system for assessment of fibrosis stage [12]. Steatosis was categorized by visual assessment as: if steatosis presents in 1-10% of hepatocytes [mild]; 11-30% [moderate]; and 31-100% [severe].
FibroScan was performed using the FibroScan apparatus (Echosens, Paris, France), with 5-MHz transducer. The fibrosis grading score used was: F0=0-2.9 kPa; F1=3-5.9 kPa; F2=6-8.9 kPa; F3=9-16.9 kPa; and F4=17-75 kPa (results were expressed in kilopascals) [13-15].
Statistical Analysis:
Data was statistically analyzed using SPSS version 21 for windows and for all the analysis a p value < 0.05 was considered statistically significant. Data are shown as mean, range or value. As appropriate, stages of fibrosis were tested against continuously-distributed variables using the Anova test. Chi-squared test was used to test two ordinal variables, while paired t test was used for pre and post values of the same variable of the same group of patients.
Results
The present study included 30 CHC patients with moderate and severe steatosis who were initially assessed by liver biopsy and FibroScan before starting interferon treatment for their fibrosis stage, activity grade and degree of steatosis. After losing 10% or more of their weight, they were followed up by FibroScan only. Our patients’ median age was 44.7 years (29-59 years) with equal sexes (15 men and 15 women), table 1 shows the patients characteristics before and after losing weight. Only ALT showed significant decrease after weight loss (p < 0.05).
Table 1. Descriptive data and patients’ characteristics at the beginning of assessment
Mean ± SD
After losing weight |
Range |
Mean ± SD
Before losing weight |
Studied variables |
|
29-59 years |
44.7 ± 8.9 |
Age |
|
|
15:15 |
Male: Female |
29.05 ± 1.92 |
27-36.9 kg/m2 |
33.2 ± 2.5 |
BMI |
41.2 ± 11 |
22-88 U/L |
49.8 ± 15.8 |
ALT |
47.1 ± 15.3 |
19-79 U/L |
49.9 ± 16.1 |
AST |
4 ± 0.6 |
3.6-4.9 gm/dl |
4.2 ± 0.4 |
Albumin |
0.7 ± 0.7 |
0.3-1.1 mg/dl |
0.7 ± 0.2 |
Total bilirubin |
0.15 ± 0.08 |
0.03-0.5 mg/dl |
0.2 ± 0.1 |
Direct bilirubin |
1.09 ± 0.3 |
1-1.4 |
1.1 ± 0.1 |
INR |
824.2 ± 2112 |
17.5-5639.9 IU/ml× 103 |
779.6 ± 1385.5 |
HCV RNA level |
10.98 ± 5.57 |
6.1-30.8 kPa |
13.8 ± 7.5 |
FibroScan |
N: Number, SD: Standard deviation, ALT: Alanine Aminotransferase, AST: Aspartate Aminotransferase, RNA: Ribonucleic Acid, INR: International Normalized Ratio, kPa: kilopascal
According to the histological examination there were 20 patients with moderate and 10 with severe steatosis. Table 2 shows the frequency of different grades of fibrosis between patients according to Metavir classification.
Table 2. Characteristics of patients’ liver biopsies
% |
Frequency |
|
Fibrosis stage |
36.7
30
26.6
6.7 |
11
9
8
2 |
F1
F2
F3
F4 |
Activity grade |
53.3
43.3
3.4 |
16
13
1 |
A1
A2
A3 |
Steatosis degree |
0
0
66.7
33.3 |
0
0
20
10 |
No
Mild
Moderate
Severe |
100.0 |
30 |
Total |
After body weight loss, our results showed great improvement of liver stiffness measured by FibroScan. Table 3 shows the frequency of different grades of fibrosis between patients before and after weight reduction. Figure 1 shows this frequency in relation to BMI before and after weight loss.
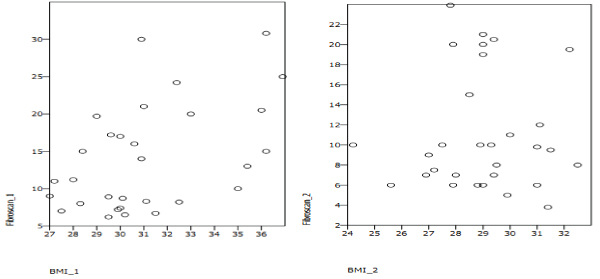
Figure 1. Scatter plot of FibroScan results according to BMI
1 = before weight loss and 2 = after weight loss
Table 3. Fibrosis grades by FibroScan before and after weight reduction
After
number (%) |
Before
number (%) |
Stage of fibrosis |
5(16.7%) |
0(0%) |
F1 |
9(30%) |
11(36.7%) |
F2 |
10(33.3%) |
10(33.3%) |
F3 |
6(20%) |
9(30%) |
F4 |
P < 0.01 |
|
For statistical reason, we tested the FibroScan results again as values in kPs, to avoid any statistical defect when grouping patients into grades. Table 4 shows descriptive data (mean, standard deviation and range) of liver fibrosis beside BMI data before and after losing weight. It shows the highly significant improvement of liver fibrosis after weight loss (p<0.01).
Table 4. FibroScan and BMI before and after losing weight
p- value |
Range |
SD |
Mean |
|
<0.01* |
6.1-30.8 |
7.46 |
13.81 |
FibroScan (before) kPa |
3.8-23.9 |
5.57 |
10.98 |
FibroScan (after) kPa |
<0.01* |
27-36.9 |
2.5 |
33.23 |
BMI (before) kg/m2 |
24.2-32.5 |
1.92 |
29.05 |
BMI (after) kg/m2 |
SD: Standard deviation, kPa: kilopascal. *Paired t-test
Discussion
Liver fibrosis reversibility is still a hot issue. Although it was considered to be a dynamic process depending on the balance between degradation and remodeling of extracellular matrix deposition by metalloproteinase enzymes and their tissue inhibitors, yet the mechanism is not completely understood. For instance, treating the cause of liver disease was thought to improve the ability of liver tissue to reverse fibrosis, but studies showed incomplete or insignificant improvement in some patients [6,7]. This means that, there are other co-factors which if treated could improve the healing response.
Increased body weight is well known to increase fat deposition in hepatocytes i.e. steatosis and it was claimed to cause liver fibrosis [16]. Studies showed that decreasing the hepatic steatosis grade by weight loss achieved by lifestyle modifications (diet and exercise) could improve hepatic fibrosis [17]. Few or scarce data are available from Egypt, in spite of the high prevalence of liver disease in our population [18].
In our study we used FibroScan in the assessment of liver fibrosis as it was proved to be a reliable method to detect significant fibrosis compared to histological assessment of liver tissue [14,19], it measures liver stiffness based on the propagation speed of shear waves with overall diagnostic accuracy reaching 94% [20].
Our study goal was to 2021 Copyright OAT. All rights reservld improve the degree of fibrosis in Egyptian patients suffering CHC. We included patients diagnosed with moderate or severe steatosis and compared their FibroScan results before and after losing significant weight, at least 10% of their original weight. We used BMI [11] in the assessment of our patients’ weight reduction, and we found a significant decrease in it with mean of 4.18 kg/m2; p<0.01.
Our main result was that there is marked improvement in the degree of fibrosis and its values in the second scan and before starting the treatment of CHC (Mean ± SD was 13.81 ± 7.5 kPa before and became 10.98 ± 5.6 kPa after losing weight, p<0.01). Three patients (10%) with severe fibrosis were down-graded to F3 and F2 after weight loss (two and one patients, respectively). This means that losing weight is an important factor for liver fibrosis healing and it could has more additive effect when treating the main cause of liver injury i.e. hepatitis C in our cases.
Our results go with Hickman et al. [17] who investigated 19 patients using liver biopsy before and after weight reduction and found that it was associated with improvement of fibrosis.
Also Dixon et al. [ 21], who investigated the effect of losing significant weight using laparoscopic adjustable gastric band placement on the degree of liver fibrosis and inflammation. They investigated their patients by doing two liver biopsies, before and after weight loss. They reported that significant weight loss was associated with marked improvement in hepatic necro-inflammatory changes and stage of fibrosis.
In conclusion: Weight loss is associated with hepatic fibrosis improvement. It is important to achieve significant weight loss before starting the treatment of the primary cause of the liver disease. More work is needed to find out other co-factors which, if treated could improve the response to the standard available treatments.
References
- Williams CD, Stengel J, Asike MI, Torres DM, Shaw J, et al. (2011) Prevalence of nonalcoholic fatty liver disease and nonalcoholic steatohepatitis among a largely middle-aged population utilizing ultrasound and liver biopsy: a prospective study. Gastroenterology 140: 124-131. [Crossref]
- Leandro G, Mangia A, Hui J, Fabris P, Rubbia-Brandt L, Colloredo G, et al. (2006) Relationship between steatosis, inflammation, and fibrosis in chronic hepatitis C: a meta-analysis of individual patient data. Gastroenterology 130: 1636-1642. [Crossref]
- Zubair A, Mubarik A, Jamal S, Arif A, Khan DA (2009) Correlation of steatosis with fibrosis and necro-inflammation in chronic hepatitis C infection in the absence of confounding factors. J Coll Physicians Surg Pak 19: 417-420. [Crossref]
- Rockey DC (2016) Liver Fibrosis Reversion After Suppression of Hepatitis B Virus. Clin Liver Dis 20: 667-679. [Crossref]
- Ellis EL, Mann DA (2012) Clinical evidence for the regression of liver fibrosis. J Hepatol 56: 1171-1180. [Crossref]
- Ramachandran P, Iredale JP, Fallowfield JA (2015) Resolution of liver fibrosis: basic mechanisms and clinical relevance. Semin Liver Dis 35: 119-131. [Crossref]
- Manne V1, Akhtar E, Saab S (2014) Cirrhosis regression in patients with viral hepatitis B and C: a systematic review. J Clin Gastroenterol 48: e76-84. [Crossref]
- Sohrabpour AA, Mohamadnejad M, Malekzadeh R (2012) Review article: the reversibility of cirrhosis. Aliment Pharmacol Ther 36: 824-832. [Crossref]
- Tilg H, Moschen A (2010) Weight loss: cornerstone in the treatment of non-alcoholic fatty liver disease. Minerva Gastroenterol Dietol 56: 159-167. [Crossref]
- Clark JM (2006) Weight loss as a treatment for nonalcoholic fatty liver disease. J Clin Gastroenterol 40: S39-43. [Crossref]
- WHO Expert Committee report (1995). World Health Organ. Physical status: the use and interpretation of anthropometry. Tech Rep Ser 854: 1-452. [Crossref]
- Bedossa P, Poynard T (1996) An algorithm for the grading of activity in chronic hepatitis C. The METAVIR Cooperative Study Group. Hepatology 24: 289-293. [Crossref]
- Vizzutti F, Arena U, Romanelli RG, Rega L, Foschi M, et al. (2007) Liver stiffness measurement predicts severe portal hypertension in patients with HCV-related cirrhosis. Hepatology 45: 1290-1297. [Crossref]
- Colletta C, Smirne C, Fabris C, Toniutto P, Rapetti R, et al. (2005) Value of two noninvasive methods to detect progression of fibrosis among HCV carriers with normal aminotransferases. Hepatology 42: 838-845. [Crossref]
- Nitta Y, Kawabe N, Hashimoto S, Harata M, Komura N, et al. (2009) Liver stiffness measured by transient elastography correlates with fibrosis area in liver biopsy in patients with chronic hepatitis C. Hepatol Res 39: 675-684. [Crossref]
- Dixon JB, Bhathal PS, O’Brien PE (2001) Nonalcoholic fatty liver disease: predictors of nonalcoholic steatohepatitis and liver fibrosis in the severely obese. Gastroenterology 121: 91-100. [Crossref]
- Hickman IJ, Clouston AD, Macdonald GA, Purdie DM, Prins JB, et al. (2002) Effect of weight reduction on liver histology and biochemistry in patients with chronic hepatitis C. Gut 51: 89-94. [Crossref]
- Kandeel A, Genedy M, El-Refai S, Funk AL, Fontanet A, Talaat M (2017) The prevalence of hepatitis C virus infection in Egypt 2015: implications for future policy on prevention and treatment. Liver Int 37: 45-53. [Crossref]
- Ziol M, Handra-Luca A, Kettaneh A, Christidis C, Mal F, Kazemi F, et al. (2005) Noninvasive assessment of liver fibrosis by measurement of stiffness in patients with chronic hepatitis C. Hepatology 41: 48-54. [Crossref]
- Mobarak L, Nabeel MM, Hassan E, Omran D, Zakaria Z (2016) Real-time elastography as a noninvasive assessment of liver fibrosis in chronic hepatitis C Egyptian patients: a prospective study. Ann Gastroenterol 29: 358-362. [Crossref]
- Dixon JB, Bhathal PS, Hughes NR, O'Brien PE (2004) Nonalcoholic fatty liver disease: Improvement in liver histological analysis with weight loss. Hepatology 39: 1647-1654. [Crossref]