Abstract
Background/Objectives: Data regarding the validity of self-reported weight and height in adolescents to calculate Body Mass Index (BMI) and determine the prevalence of obesity are conflicting. The aim of the study was to evaluate the validity of self-reported weight and height in the assessment of overweight/obesity prevalence in a sample of Italian adolescents.
Subject/Methods: A representative cluster sample of 369 adolescents of the second class of secondary schools in the Lazio region was investigated. Weight and height were both self-reported and measured. BMI was calculated from both self-reported and measured values. Data were analysed using Paired-sample t-test, Student’s t test, Bland-Altman plots and Kappa Cohen’s statistics.
Results: The adolescents ‘self-reported weights were underestimated; their heights were overestimated, and their resultant BMI was underestimated. The mean differences were - 0.3±3.7 kg (95% CI -0.68 to 0.08; p 0.116) for weight, 1.2±2.9 cm (95% CI 0.89 to 1.48; p 0.000) for height and 0.4±1.5 kg/m2 (95% CI -0.58 to -0.27; p 0.000) for BMI. The prevalence of overweight/obesity was 18.9% based on self-reported data (24.0% for males and 15.0% for females) and 23.3% by measured data (30.2% for males and 17.9% for females).
Conclusion: Self-reported weight and height, very useful to simplify large-scale investigations, should be used with caution in Italian adolescents, because they could lead to erroneous estimating rates of overweight and obesity in this population.
Key words
Adolescents, obesity, overweight, self-reported weight/height
Introduction
Childhood obesity is a major challenge for public health, because of the health risks associated with excess body fat and its prevalence has increased rapidly in recent decades in children and adolescents around the world (1-3). Furthermore, overweight and obese adolescents are more likely to become obese adults (4). Therefore, the surveillance of overweight/obesity prevalence in children and adolescents is needed to successfully plan health interventions and to monitor its trend (5). The Body Mass Index (BMI), calculated as body weight (kg) divided by height (m) squared, is the most commonly used parameter to evaluate excess body weight in large scale studies and it is considered an appropriate index to define overweight also in children and adolescents (6, 7). Generally, the BMI is assessed by measurements of weight and height carried out by trained staff with adequate equipment (8). However, self-reported data on weight and height are widely used to calculate BMI and determine the prevalence of overweight/obesity in many countries and regions of the world (9, 10). Indeed, frequently self-reported weight and height data are preferred in large scale epidemiological studies respect to those measured, because they are easier and cheaper and simplify data collection on fieldwork (11). Measured anthropometric data may be unaffordable in large population surveys and are not applicable in the investigation based on postal or telephone surveys. Moreover, since anthropometric measurements might seem invasive especially for people with weight problems, their refusal may affect the participation rate to the survey and thus contribute to underestimate the prevalence of overweight/obesity (9). Still, refusals were observed in adolescents even for self-reported BMI data, but with a lower frequency compared to that for the measured BMI (12).
Nevertheless, the validity of self-reported height and weight data is debated, and several investigations have shown conflicting results. In fact, some authors have suggested the effectiveness of the self-reported data (13-15), while others have raised concerns about their accuracy (16, 17). Moreover, sometimes the quality of these data is not described in papers that report results based on self-reported weight and height (11).
Even though there are strong correlations between anthropometric values self-reported and measured (18, 19), the Pearson correlation coefficient is not adequate to describe and quantify the bias in weight and height self-reported in reference to those measured (20,21). In fact, commonly self-reported body weight tends to be underestimated with respect to that measured both in young people and adults, while self-reported height tends to be overestimated (9, 22), although in adolescent’s height may be also underestimated (11). Generally, in adolescents the self-reported weight and height of the overweight or obese and of the girls lead to underestimate their ponderal status to a greater extent than the male adolescents and those with normal weight, and the extent of the underestimation increases with the degree of adiposity (11, 23).
Therefore, self-reported data lead to underestimate overweight and obesity prevalence among adolescents, with a wide variability in the error range observed in literature (24, 25).
Furthermore, compared to objective measures, some studies have shown that self-reported weight and height have a weak sensitivity, that is, a low percentage of obese or overweight adolescents are correctly classified, while up to about a quarter/half of them are not included in the right weight status category when using self-reported data (11, 25, 26).
Still, comparisons of sensitivity between studies are complicated by the use of different definitions of overweight and obesity (26). Additional limits to compare and evaluate the results of published studies on anthropometric data self-reported and measured may be any differences in the measurement procedures and tools used, as well as differences in the statistical analysis, which are also not always described (22).
Several studies have examined factors, other than gender and weight status, associated with the accuracy of self-reported height and weight in adolescents, including age, race/ethnicity and socioeconomic status (19, 27, 28-32). The results of these studies are quite conflicting (11) and the validity of self-reported anthropometric data might vary between populations and over time, as well as it is influenced by several aspects, including cultural and socio-demographic factors and the health status of a community (9,26).
Several authors propose the use of specific population equations to correct self-reported data and some propose to adjust the threshold values of BMI to define obesity from self-reported BMI (33-35). However, it is usually recommended to use weight and height measured, and when this is not possible to check the validity of self-reported data in the studied population (9,11). Furthermore, the validity of self-reported height and weight has not been adequately examined in diverse youth samples, especially in different cultural contexts and countries (11).
The aim of the present study was to evaluate the validity of self-reported weight, height and resultant BMI values in the assessment of the prevalence of overweight and obesity in a sample of Italian adolescents.
Materials and Methods
Sample
The study was performed on a representative sample of adolescents of the Lazio region aged 15-16 years attending the second class of randomly selected public and private secondary schools, according to a list provided by the Regional Education Office. Cluster sampling was performed according to World Health Organization (WHO) cluster survey methodology (36) with classes as the unit of sampling. The sample size was calculated on the basis of an expected prevalence of overweight/obesity of 30%, using a desired level of precision of 5% and a design effect of 2. The resulting number was increased by 11.5% to compensate for eventual refusals. 21 secondary school classes were recruited for total of 438 students enrolled (203 males and 235 females). The attendance to the project was 86,1% however 1,7% of the total adolescents were absent from school the day of the survey and it was not possible to recover them afterwards, therefore the participation rate was 84,4%. Also 4 subjects were not considered in the analysis because they were older than18 years. Overall, 369 adolescents (162 males and 207 females) were investigated in the study.
Data collection was performed between December 2011 and May 2012. The study was in compliance with the Ethical Committee of the National Research Institute on Food and Nutrition. Only adolescents with a consent form signed by a parent or legal guardian were included in the sample.
Anthropometric data measured and self-reported
Weight and height measurements were carried out by trained and standardized staff, according to WHO recommendations (8). Height was measured to the nearest 0.1 cm by a stadiometer SECA 214 (Hamburg, Germany), with the subject without shoes, standing up, weight being equally distributed on feet, with the head in the Frankfurt plane and the back of the head, buttocks and heels (if possible) in contact with the vertical board. Weight was measured to the nearest 50 g by electronic scale SECA 872TM (Hamburg, Germany), with the subject in fasting condition (or after a light breakfast) and after emptying the bladder.
The measurements were carried out at school in the morning, one adolescent at a time, in a quiet room, ensuring privacy and confidentiality for each youth. Prior to the standardised measurement, adolescents were asked face to face to report about their date of birth, weight and height. Gender and measurement date were also recorded; age was calculated from measurement date and date of birth. Body Mass Index (BMI) was calculated as the weight in kilograms divided by the square of the height in meters (kg/m2) considering both measured and self-reported values of weight and height. Ponderal status was defined using both values of BMI from measured and self-reported weight and height, by the gender and age specific BMI reference values of Cole &Lobstein (37).
Statistical analysis
The statistical analyses were performed using SPSS statistical software package version 20.0 (SPSS Inc., Chicago, IL). Descriptive statistics were used to calculate means and standard deviations. Paired-sample t-test were conducted in order to detect significant differences in means between the direct measures and self-reported data on weight, height and BMI respectively. Means between genders were compared by unpaired t-test. The index of Cohen’s Kappa (38) was applied to compare the classification of overweight and obesity through weight and height measured data and that obtained from self-reported data; the criteria of Landis and Koch (39) were used to evaluate the agreement of classification. Differences between groups were tested using Student’s t test. Bland-Altman analysis (20) was used to visualize the agreement between self-reported and measured data.
Results
Characteristics of the study sample are shown in Table 1. Children had age (mean± standard deviation) 15.8 ± 0.5 years, weight 62.5 ± 13.6 kg, height 167.2 ± 8.9 cm and BMI 22.3 ± 4.0 kg/m2. The mean differences between self-reported and measured anthropometric data of the adolescents are presented in Table 2. On average, the teens underestimated the weight of -0.3 ± 3.7 kg and overestimated height of 1.2 ± 2.9 cm, hence a significant BMI underestimation of -0.4 ± 1.5kg/m2. Both genders slightly underestimated their weight although the mean differences were not statistically significant (girl -0.2 ± 3.2; boys -0.4 ± 4.2). Girls overestimated their height (1.7 ± 2.6 p=0.000) to a greater extent (p=0.000) than boys (0.6 ± 3.1; p=0.015). Also, BMI was significantly underestimated in female and males (respectively -0.5 ± 1.4 p=0.000; -0.3± 1.7 p=0.035), however the differences between genders were not statistically significant.
Table 1: Study sample characteristics (Means ± Standard Deviation)
|
Males
(n= 162) |
Females
(n= 207) |
Total
(n= 369) |
p |
Age (years) |
15.9±0.6 |
15.7±0.5 |
15.8±0.5 |
0.141* |
Weight (kg) |
68.5±15.0 |
57.8±10.2 |
62.5±13.6 |
<0.001* |
Height (cm) |
173.9±6.7 |
162.0±6.6 |
167.2±8.9 |
<0.001* |
BMI (kg/m2) |
22.6±4.4 |
22.0±3.6 |
22.3±4.0 |
0.324* |
*p-value from test U of Mann-Whitney
Table 2: Comparison of self-reported and measured weight, height and BMI
|
Self-reported
Mean ±SD |
Measured
Mean ±SD |
Difference
Mean ±SD (95% CI) * |
p** |
Girls (n= 207) |
|
|
|
|
Weight (kg)
Height(cm)
BMI (kg/m2) |
57.6 ±9.4
163.7 ±7.0
21.5 ±3.1 |
57.8 ±10.2
162.0 ±6.6
22.0 ±3.6 |
-0.2 ± 3.2 (-0.69 to 0.20)
1.7 ±2.6 (1.30 to 2.01)
-0.5 ±1.4 (-0.74 to -0.35) |
0.272
0.000
0.000 |
Boys (n= 162) |
|
|
|
|
Weight (kg)
Height (cm)
BMI (kg/m2) |
68.1 ±13.6
174.5 ±7.4
22.3 ±3.8 |
68.5 ±15.0
173.9 ±6.7
22.6 ±4.4 |
-0.4 ±4.2 (-1.02 to 0.28)
0.6 ±3.1 (0.11 to 1.07) §
-0.3 ±1.7 (-0.54 to -0.02) |
0.262
0.015
0.035 |
Total (n= 369) |
|
|
|
|
Weight (kg)
Height (cm)
BMI (kg/m2) |
62.2 ±12.6
168.4 ±9.0
21.8 ±3.4 |
62.5 ±13.6
167.2 ±8.9
22.3 ±4.0 |
-0.3 ± 3.7 (-0.68 to 0.08)
1.2 ± 2.9 (0.89 to 1.48) §
-0.4 ±1.5(-0.58 to -0.27) |
0.116
0.000
0.000 |
*95% CI = 95% confidence interval; **according to the paired-sample t-test; § unpaired t-test p=0.000
Table 3 shows the mean differences between self-reported and measured weight, height and BMI according to ponderal status. The results highlight a tendency associated to the excess weight to underestimate weight (p=0.000) and overestimate slightly height. The overweight adolescents underestimated their body weight -1.8 ± 3.3 kg and overestimated their height of 1.5 ± 3.8 cm; obese individuals underestimated their body weight in average of -5.5 ± 5.9 kg and overestimated their height of 1.4 ± 3.6 cm. Consequently, the BMI was underestimated of - 1.1 ± 1.5 kg/m2 in the overweight adolescents and - 2.5 ± 2.5 kg/m2 among the obese ones. In the normal weight teens, body weight was overestimated by 0.5 ± 2.8 kg and height was overestimated by 1.2 ± 2.5 cm, so even BMI was underestimated, although slightly (- 0.1 ± 1.1). Instead, in the thinness teens, body weight was overestimated by 1.6 ±3.2 kg and the height were underestimated by - 0.3 ± 2.6; then BMI was overestimated by 0.6 ± 1.2.
Table 3: Mean difference (self-reported minus measured) in weight, height and BMI according to ponderal status (mean ±sd)
|
Ponderal status
|
p* |
Thinness
n.23 |
Normalweight
n.260 |
Overweight n.57 |
Obese
n.29 |
Δ Weight (kg) |
+1.6±3.2 |
+0.5±2.8 |
-1.8 ±3.3 |
-5.5 ±5.9 |
0.000 |
Δ Height (cm) |
-0.3±2.6 |
+1.2±2.5 |
+1.5 ±3.8 |
+1.4±3.6 |
0.071 |
Δ BMI (kg/m2) |
+0.6±1.2 |
-0.1 ±1.1 |
-1.1±1.5 |
-2.5±2.5 |
0.000 |
*according to ANOVA analysis Δ= self-reported value minus measured value
The differences between self-reported and measured values were plotted against the means of the self-reported and measured values for weight (Figure 1), height (Figure 2) and BMI (Figure 3). The 95% limits of agreement were -6.9 and 7.5 for weight, -6.8 and 4.4 for height, and -2.6 and 3.4 for BMI.
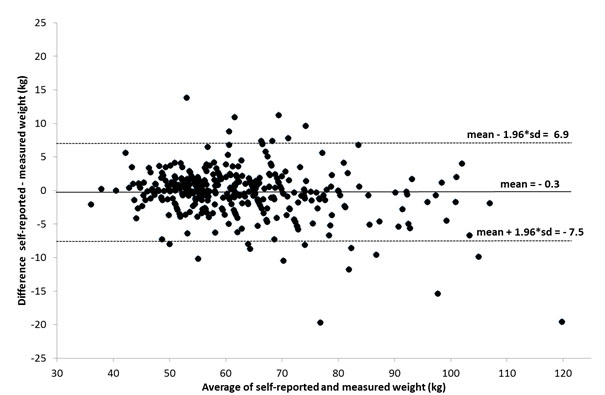
Figure 1: Bland-Altman plot of the difference versus the average of reported and measured weights
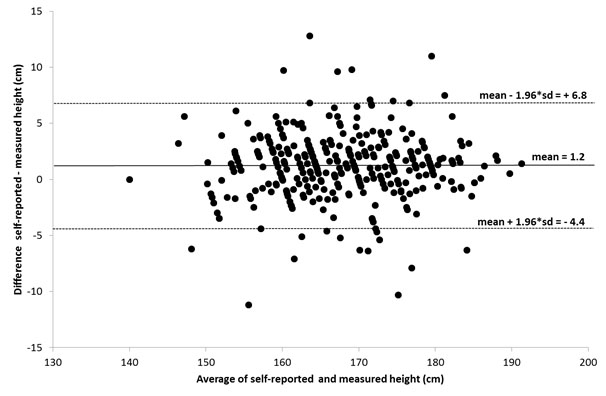
Figure 2: Bland-Altman plot of the difference versus the average of reported and measured heights
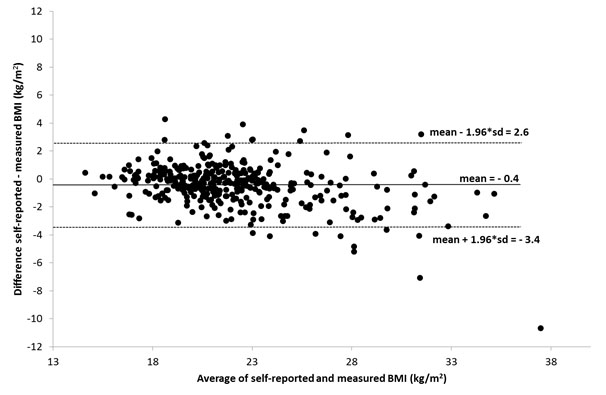
Figure 3: Bland-Altman plot of the difference versus the average of reported and measured BMI
Table 4 shows that the prevalence of overweight and obesity was underestimated by self-reported data respect to measured ones (13.8% vs 15.4%for overweight and 5.1% vs 7.9% for obese) in particular among males (16% vs 19.1% for overweight and 8.0% vs 11.1% for obese).
Table 4: Percentage of overweight and obesity from data self-reported and measured
|
|
Males
(n=162) |
Females
(n=207) |
Total sample
(n=369) |
Overweight (%) |
|
|
|
|
Self-reported |
|
16.0 |
12.1 |
13.8 |
Measured |
|
19.1 |
12.6 |
15.4 |
Difference |
|
-3.1 |
-0.5 |
-1.6 |
Obese (%) |
|
|
|
|
Self-reported |
|
8.0 |
2.9 |
5.1 |
Measured |
|
11.1 |
5.3 |
7.9 |
Difference |
|
-3.1 |
-2.4 |
-2.8 |
Table 5 shows the agreement between the assessment of ponderal status by BMI from self-reported weight and height and that from measured: 12 obese (41.4%) were misclassified within the overweight group; 23 out of 57 (40.4%) overweight subjects were incorrectly identified in the category of normal weight, while 2 (3.5%) fell in the obese class. Most of the normal weight teens 245 out of 260 (94.2%) were classified correctly, instead 7 of them (2.7%) fell within the overweight range and 8 (3.1%) within thinness one. 7 out of 23 (30.4%) thinness subjects were falsely in the category of normal weight. The value of Kappa was equal to 0.64 (p <0.001), 95% CI (0.56; 0.72), close to the lower limit of the range values that defines a substantive agreement, according to the criteria of classification of Landis and Koch. Regarding to gender, among obese males 6 out of 18 (33.3%) were misclassified as overweight, 14 out of 31 (45.2%) overweight subjects were in the category of normal weight; most of the normal weight adolescents, 95 out of 102 (93.1%) were classified correctly, and 5 out of 11 thin subjects (45.4%) were in the category of normal weight. Among obese females 6 out of 11 (54.5%) were misclassified as overweight, 9 out of 26 (34.6%) overweight subjects were in the category of normal weight; most of the normal weight, 150 out of 158 (94.9%) were classified correctly, and only 2 out of 12 thin subjects (16.6%) were in the category of normal weight.
Table 5: Agreement between the assessment of ponderal status from measured and self-reported weight and height
BMI from self-reported weight and height |
BMI from measured weight and height |
Thinness |
Normal weight |
Overweight |
Obese |
Total |
Thinness |
16
7
0
0
23 |
8
245
7
0
260 |
0
23
32
2
57 |
0
0
12
17
29 |
24
275
51
19
369 |
Normal weight |
Overweight |
Obese |
Total |
Males |
|
|
|
|
|
Thinness |
6
5
0
0
11 |
3
95
4
0
102 |
0
14
16
1
31 |
0
0
6
12
18 |
9
114
26
13
162 |
Normal weight |
Overweight |
Obese |
Total |
Females |
|
|
|
|
|
Thinness |
10
2
0
0
12 |
5
150
3
0
158 |
0
9
16
1
26 |
0
0
6
5
11 |
15
161
25
6
207 |
Normal weight |
Overweight |
Obese |
Total |
Discussion
This study examined the accuracy of self-reported weight, height and resultant BMI in the assessment of the prevalence of overweight in a sample of Italian adolescent. Self-reported weights were slightly underestimated by examined adolescents, while heights were overestimated, and BMI underestimated significantly. These findings were similar to those in previous studies in adolescents (19, 28). In this study, the mean differences were within the range of values ??reported in the literature for this age group of -4.0 to 1.5 kg of weight, -1.1 to 6.9 cm of height and -3.0 to 0.2 of BMI values.
In the present study, the difference between boys and girls in the degree of inaccuracy in reporting weight was no significant. Nevertheless, girls reported height more inaccurately than boys, with self-reported values being significantly higher than those measured, confirming previous researches (26, 27, 33-40).
Like in other studies (41-43), the results of this survey highlight the problem with self-reported data in the teens with excess weight that tend to underestimate their weight and overestimate their height, resulting in a lower prevalence of overweight and obesity (1.6 percentage points for overweight and up to 2.8 percentage points for obesity). In fact, the magnitude of the discrepancy between self-reported and actual anthropometric measures was affected by the actual ponderal status, with heavier adolescents understating their weight more than the thinner ones.
The lack of recent information on weight and height measurement might be a cause of self-report error of these parameters, especially during adolescence, when growth is very rapid (44), and mainly in disadvantaged groups who may not have easy access to this type of measures (22, 45). Moreover, teens may measure easier their weight, but they may have less occasions to measure their height; furthermore, girls seem to be more fixated on weight than height (40). Social desirability is another factor that may lead to a bias in self-reported weight and height (46); thus, it is more likely that individuals or groups, subjected to a strong social pressure in relation to body image, are influenced to report idealised and/or socially accepted values (47). In this context, some studies on adolescents have shown an association between the degree of dissatisfaction regarding their body image and underreporting of their body weight (29, 31, 33). As above mentioned, it has been amply demonstrated that the status of the individual’s body weight affects the systematic inaccuracy in the weight and height values self-reported (21, 42, 48). Furthermore, the influence of social desirability on self-reported data may change over time, in function of cultural and social changes, and it also may be contingent on the data collection method used; such as whether the data collection is done for interview in person or by phone (49). Although it is clearly an objective, measurable phenomenon (i.e., BMI), obesity is also a subjective, emotional experience of one’s body and body image, and has been significantly associated with internal states, such as low self-esteem (43). Because a lower self-esteem is associated with greater bias in self-reported weight, discrepancies in self-reports of weight problems at pre-pubescent and first puberty phase possibly reflect discrepant perceptions of body image among individuals, implying one’s unwillingness or inability to acknowledge his/her obesity because of denial and/or social stigma (43).
This study has some limitations. The cross-sectional study design does not allow analysis of cause-and-effect relationships and does not include adolescents out of schools although we examined the age group that has an obligation to go to school in Italy. The strengths of our study include the high participation rate, the sample representativeness and the fact that all anthropometric measurements were performed by two well trained and standardised investigators, thus diminishing the probability of measurement error.
In conclusion, the present findings indicate that there is a discrepancy between self-reported and measured weight and height data in the adolescent sample, the greater the more increases the additional body weight. Therefore, the anthropometric self-reported data, very useful to simplify large-scale investigations, should be used with caution in the studied population, because they could lead to erroneous estimating rates of overweight and obesity. These discrepancies cannot be ignored because body weight excess has substantial effects on public health and resources, and underestimating overweight and obesity prevalence’s could mislead policy makers to overlook the extent of the problem; also this misclassification could distort the results from etiological studies about the risk factors associated to body weight and underestimate the impact of obesity-related diseases (50). Future research, also extended to other Italian regions, should explore the predictors of inaccuracy, to elucidate trends in biases from self-reported anthropometric indices.
Acknowledgements
Funding for this study was made possible by the financial support of the Italian Ministry of Agriculture, Food and Forestry (MIPAAF, D.M.7105 del 29/03/2010).
The authors gratefully thank the teachers, adolescents and families who participated in this study.
Financial Support
Italian Ministry of Agriculture, Food and Forestry (MIPAAF, D.M.7105 del 29/03/2010).
Conflict of interest statement
The authors have no conflict of interest to declare.
References
- Wang Y, Lobstein T (2006) Worldwide trends in childhood overweight and obesity. Int J Pediatr Obes 1: 11-25. [Crossref]
- Lobstein T (2015) Prevalence And Trends Across The World - The Free Obesity eBook. http://ebook.ecog-obesity.eu/chapter-2-epidemiology-prevention-across-europe/prevalence-trends-across-world/#\nhttp://ebook.ecog-obesity.eu/chapter-2-epidemiology-prevention-across-europe/prevalence-trends-across-world/]
- Ng M, Fleming T, Robinson M, Thomson B, Graetz N, et al. (2014) Global, regional, and national prevalence of overweight and obesity in children and adults during 1980-2013: a systematic analysis for the Global Burden of Disease Study 2013. Lancet. [Crossref]
- Goldhaber-Fiebert JD, Rubinfeld RE, Bhattacharya J, Robinson TN, Wise PH (2013) The utility of childhood and adolescent obesity assessment in relation to adult health. Med Decis Making 33: 163-175. [Crossref]
- WHO. European Food and Nutrition Action Plan 2015–2020. 2014;(September 2014):15-8. [Accessed 9 November 2015. www.euro.who.int/__data/assets/pdf_file/0008/253727/64wd14e_FoodNutAP_140426.pdf]
- Bellizzi MC, Dietz WH. Workshop on childhood obesity: summary of the discussion. Am J Clin Nutr 70: 173–175. [Crossref]
- Krebs NF, Himes JH, Jacobson D, Nicklas TA, Guilday P, et al. (2007) Assessment of Child and Adolescent Overweight and Obesity. Pediatrics 120: S193–S228. [Crossref]
- WHO. Physical Status: The Use and Interpretation of Anthropometry. Report of a WHO Expert Committee, Technical Report Series N° 854, 1995.
- Connor Gorber S, Tremblay M, Moher D, Gorber B (2007) A comparison of direct vs. self-report measures for assessing height, weight and body mass index: a systematic review. Obes Rev 8: 307-326. [Crossref]
- Keith SW, Fontaine KR, Pajewski NM, Mehta T, Allison DB (2011) Use of self-reported height and weight biases the body mass index-mortality association. Int J Obes 35: 401-408. [Crossref]
- Sherry B, Jefferds ME, Grummer-Strawn LM (2007) Accuracy of adolescent self-report of height and weight in assessing overweight status: a literature review. Arch Pediatr Adolesc Med 161: 1154-161. [Crossref]
- Chau N, Chau K, Mayet A, Baumann M, Stéphane Legleye S, (2013) Self-reporting and measurement of body mass index in adolescents: refusals and validity, and the possible role of socioeconomic and health-related factors. BMC Public Health 13: 815. [Crossref]
- Strauss RS (1999) Comparison of measured and self-reported weight and height in a cross-sectional sample of young adolescents. Int J Obes 23: 904–908.
- Hayes AJ, Kortt MA, Clarke PM, Brandrup JD (2008) Estimating equations to correct self-reported height and weight: implications for prevalence of overweight and obesity in Australia. Aust N Z J Public Health 32: 542–5. [Crossref]
- Clarke P, Sastry N, Duffy D, Ailshire J (2014) Accuracy of Self-Reported Versus Measured Weight Over Adolescence and Young Adulthood: Findings from the National Longitudinal Study of Adolescent Health, 1996-2008. Am J Epidemiol 180: 153–159. [Crossref]
- Galan I, Gandarillas A, Febrel C, Meseguer C (2001). Validation of self-reported weight and height in an adolescent population. Gac Sanit 15: 490–497. [Crossref]
- Zhou X, Dibley MJ, Cheng Y, Ouyang X, Yan H (2010) Validity of self-reported weight, height and resultant body mass index in Chinese adolescents and factors associated with errors in self-reports, BMC Public Health 10: 190. [Crossref]
- Goodman E, Hinden BR, Khandelwal S, (2000) Accuracy of teen and parental reports of obesity and body mass index. Pediatrics 106: 52–58. [Crossref]
- Brener ND, McManus T, Galuska DA, Lowry R, Wechsler H (2003) Reliability and validity of self-reported height and weight among high school students. J Adolesc Health 32: 281–287. [Crossref]
- Martin Bland J, Altman D (1986) Statistical methods for assessing agreement between two methods of clinical measurement. The Lancet 327: 307–310. [Crossref]
- Tsigilis N (2006) Can secondary school students’ self-reported measures of height and weight be trusted? An effect size approach. Eur J Public Health 16: 532-5. [Crossref]
- Engstrom JL, Paterson SA, Doherty A, Trabulsi M, Speer KL (2003) Accuracy of self-reported height and weight in women: an integrative review of the literature. J Mid Womens Health 48: 338–345. [Crossref]
- Maximova K, Mc Grath JJ, Barnett T, O' Loughlin J, Paradis G, Do you see what I see? Weight status misperception and exposure to obesity among children and adolescents. Int J Obes 2008; 32(6):1008-15. [Crossref]
- Drake KM, Longacre MR, Dalton MA, Langeloh G, Peterson KE, et al. (2013) Two method measurement for adolescent obesity epidemiology: Reducing the bias in self-report of height and weight. J Adolesc Health 53: 322–327. [Crossref]
- Pérez A, Gabriel K, Nehme EK, Mandell DJ, Hoelscher DM (2015) Measuring the bias, precision, accuracy, and validity of self-reported height and weight in assessing overweight and obesity status among adolescents using a surveillance system. Int J Behav Nutr Phys Act 12(Suppl 1): S2. [Crossref]
- De Vriendt T, Huybrechts I, Ottevaere C, Van Trimpont I, De Henauw S, (2009) Validity of self-reported weight and height of adolescents, its impact on classification into BMI-categories and the association with weighing behaviour. Int J Environ Res Public Health 6: 269–271. [Crossref]
- Abalkhail BA, Shawky S, Soliman NK (2002) Validity of self-reported weight and height among Saudi school children and adolescents. Saudi Med J 23: 831–837. [Crossref]
- Himes JH, Hannan P, Wall M, Neumark-Sztainer D (2005) Factors associated with errors in self-reports of stature, weight, and body mass index in Minnesota adolescents. Ann Epidemiol 15: 272–278. [Crossref]
- Jansen W, van de Looij-Jansen PM, Ferreira I, de Wilde EJ, Brug J (2006) Differences in measured and self-reported height and weight in Dutch adolescents. Ann NutrMetab 50: 339–346. [Crossref]
- Morrissey SL, Whetstone LM, Cummings DM, Owen LJ (2006) Comparison of self-reported and measured height and weight in eighth-grade students. J Sch Health 76: 51. [Crossref]
- Rasmussen F, Eriksson M, Nordquist T (2007) Bias in height and weight reported by Swedish adolescents and relations to body dissatisfaction: the COMPASS study. Eur J Clin Nutr 61: 870–876. [Crossref]
- Richmond TK, Thurston I, Sonneville K, Carly E, Walls CE, et al. (2015) Racial/ethnic differences in accuracy of body mass index reporting in a diverse cohort of young adults. Int J Obes 39: 546-548. [Crossref]
- Brettschneider A-K, Rosario AS, Ellert U (2011) Validity and predictors of BMI derived from self-reported height and weight among 11- to 17-year-old German adolescents from the KiGGS study. BMC Res Notes 4: 414. [Crossref]
- Nyholm M, Gullberg B, Merlo J, Lundqvist-Persson C, Råstam L, et al. (2007) The validity ofobesity based on self-reported weight and height:Implications for population studies. Obesity 15: 197–208. [Crossref]
- Dauphinot V, Wolff H, Naudin F, Guéguen R, SermetC, et al. (2009) New obesity body mass index threshold for self-reported data. J Epidemiol Community Health 63: 128–132. [Crossref]
- Bennet S, Woods T, Liyanage WM, Smith DL (1991) A simplified general method for cluster-sample surveys of health in developing countries, World Health Stat Q 44 : 98-106.[Crossref]
- Cole TJ, LobsteinT (2012) Extended international (IOTF) body mass index cut-off for thinness, overweight and obesity. Pediatr Obes 7: 284 -294. [Crossref]
- Cohen J (1988) Statistical power analysis for behavioural sciences (2nd edition). Hillsdale, New Jersey, USA: Lawrence Earlbaum and Associates
- Landis JR, Koch GG (1977) The measurement of observer agreement for categorical data. Biometrics 1977; 33: 159-74. [Crossref]
- Fonseca H, Silva AM, Matos MG, Esteves I, Costa P, et al. (2010) Validity of BMI based on self-reported weight and height in adolescents. Acta Paediatr 99: 83-88. [Crossref]
- Elgar FJ, Roberts C, Tudor-Smith C, Moore L (2005) Validity of self-reported height and weight and predictors of bias in adolescents. J Adolesc Health 37: 371–375. [Crossref]
- Wang Z, Patterson CM, Hills AP (2002) A comparison of selfreported and measured height, weight and BMI in Australian adolescents. Aust N Z J Public Health 26: 473–478. [Crossref]
- Tokmakidis SP, Christodoulos AD, Mantzouranis NI (2007) Validity of self-reported anthropometric values used to assess body mass index and estimate obesity in Greek school children. J Adolesc Health 40: 305–310. [Crossref]
- Ekström S, Kull I, Nilsson S, Bergström A. Web-based self-reported height, weight, and body mass index among Swedish adolescents: a validation study. J Med Internet Res 2015; 17(3):e73. Available from: http://www.ncbi.nlm.nih.gov/pubmed/25791395, accessed on 20 October 2015.
- Gillum RF, Sempos CT (2005) Ethnic variation in validity of classification of overweight and obesity using self-reported weight and height in American women and men: the Third National Health and Nutrition Examination Survey. Nutr J 4: 27. [Crossref]
- Larsen JK, Ouwens M, Engels RCME, Eisinga R, van Strien T (2008) Validity of self-reported weight and height and predictors of weight bias in female college students. Appetite 50: 386–389. [Crossref]
- Wen M, Kowaleski-Jones L (2012) Sex and ethnic differences in validity of self-reported adult height, weight and body mass index. Ethn Dis 22: 72-78. [Crossref]
- Kovalchik S (2009) Validity of adult lifetime self-reported body weight. Public Health Nutr.12: 1072-1077. [Crossref]
- St-Pierre M, Béland Y (2004) Mode effects in the Canadian Community Health Survey: A comparison of CAPI and CATI. Proceedings of the American Statistical Association Meeting: Survey Research Methods. American Statistical Association: Toronto
- Akhtar-Danesh N, Mahshid Dehghan M, Merchant AT, Rainey JA (2008) Validity of self-reported height and weight for measuring prevalence of obsesity. Open Med 2: 14–19. [Crossref]