Abstract
Ideal body weight (IBW) calculation is useful in clinical practice, but most of the formulas to calculate it are complicated. Broca index (BI) is still a simple and effective method to determine IBW although seems to be abandoned. Our objective is to verify validity of BI compared with Hammond and Robinson formulas, and with IBW calculated from ideal body mass index (BMI) (22.5kg/m2) in a population. We made a correlational study from 400 patients of nutrition and surgery consult, from 2010 to 2015. Patients were classified according to their BMI in group A <30kg/m2 and B ≥30kg/m2. Age, sex, height and weight, were recorded to calculate IBW with Hammond, Robinson and BI formulas and the IBW calculated from ideal BMI. we analyzed, statistical significance with student’s t test, Pearson coefficient and linear regression. Of the 400 patients, 221 were group A, 49.7% men, and 50.3% women. Average age, height, actual weight and actual BMI were 38.9years-old, 167cm, 67.6kg, and 24.1kg/m2 respectively; and group B, 179 patients; 44.6% men, 55.4% women. Average age, height and actual weight, and actual BMI were 38.4years-old, 168cm, 112.3kg and 39.7kg/m2 respectively.
Both groups showed normal distribution. When comparing IBW using BI, with the other formulas analysed with t-test, result was significant in all (p 0.000). Utilizing Pearson coefficient also all showed significance (p 0.000) for both groups. Linear regression with Hammond, Robinson formulas and weight calculated from ideal BMI showed relationship of 95.7%, 96.5% and 99.8% respectively and between the 4 IBW formulas together, 100% relationship for both groups.
BI seems to offer the same accuracy as other more complex formulas for the calculation of the IBW. BI continues to have validity and utility in clinical practice, so we promote it as a useful clinical tool because of its simplicity.
Key words
Body mass index, weight calculation, weight equations, weight formulas.
Introduction
Weight and height are the simplest, practical and most common anthropometric measures to initially assess the general nutritional status and ideal body weight (IBW) patients should have, and are useful in clinical practice, particularly for the general physician. There are many formulas to calculate the IBW, most of them are complicated and require charts or calculators. The Broca index (BI) (height in centimeters-100=IBW) despite having more than 100 years of formulated, is still a valid and effective method to determine IBW with the benefit of its simplicity although nowadays seems to be abandoned.
The body mass index (BMI) has been used since the seventies as the main criteria to define the desirable range of weight according to the constitution of the patient, and it is used as an indicator of the severity of obesity with implications in morbidity and mortality. The IBW calculated with BI correlates with the weight calculated from ideal BMI of 22.5 kg/m2 associated with the lowest mortality rate, which makes it a useful tool, easy to obtain in clinical practice [1].
Objective
Verify the validity and utility of the BI to determine IBW compared with Hammond and Robinson formulas, and with the weight calculated from ideal BMI (22.5kg/m2) [2], both in non- obese patients (BMI < 30 kg / m2) and obese patients (≥ 30 kg/m2).
Hypothesis
The IBW calculated with BI, adequately correlates with Hammond and Robinson formulas, and with the weight calculated from ideal BMI (22.5kg / m2).
Material and methods
This is a retrospective, observational, correlational and descriptive study obtained from the clinical records of 400 patients of a nutrition and bariatric surgery consult of our medical group, collected from January 01, 2010 to December 31, 2015. The patients were classified in two groups according to the BMI, patients with BMI < 30 kg/m2 (group A) and patients with BMI ≥ 30 kg/m2 (group B). Microsoft® Excel v. 15.23 was used to register the following variables: age, sex, height (cm), weight (kg), and to perform calculations of the Hammond, Robinson, BI and weight calculated from ideal BMI (22.5kg / m2). Statistical package for Social Sciences SPSS v. 21 was used to analyze data from both groups separately and verify their normal distribution according to the Kolmogorov-Smirnoff test. Independent samples t test was used to compare the BI (height cm - 100) with Hammond’s equation IBW= (48kg for 150cm) + 1.1 kg/cm for men and (45kg for 150cm) + 0.9kg/cm for women; Robinson’s equation IBW= (50kg + 0.75) X height cm -152.4 for men and (45.5Kg + 0.67) X height cm -152.4 for women; and with the IBW calculated from ideal BMI (22.5kg/m2) for both group A and B, considering p<0.05 significant. Pearson correlation coefficient and linear regression analysis were also utilized to investigate BI relation with the other three formulas. We also analyzed Pearson correlation for both groups separated by sex and height.
Results
Of the total population of 400 patients, 221 were assigned to group A, of which 110 where men (49.7%) and 111 women (50.3%) with an average age of 38.9 years old (range 19 to 66), average height of 167cm (range 133 to 190) DS 0.09. In group B, there were 179 patients; 80 men (44.6%) and 99 women (55.4%) with an average age of 38.4 (range of 15 to 70), average height of 168cm (range 152 to 194cm) DS 0.08. The average of the patient´s actual weight in group A was 67.6kg DS 11.3, and an average of actual BMI of 24.1kg/m2 DS 2.8. Group B had an average of 112.3kg of actual weight SD 21.9, and average of actual BMI of 39.7kg/m2 SD 5.8.
Both groups showed a normal distribution according to the Kolmogorov-Smirnoff test for both weight and height. When comparing the calculated IBW obtained using BI, with the IBW obtained from the Hammond and Robinson’s equations, as well as with the weight calculated from ideal BMI (22.5kg / m2) analysed with the student's t-test for related samples, the result was significant in all (p 0.000). Utilizing Pearson correlation coefficient to contrast the BI with the other formulas, also all showed statistical significance (p 0.000) for both groups, when analysed by sex and height in both groups separately the significance was also p 0.000.
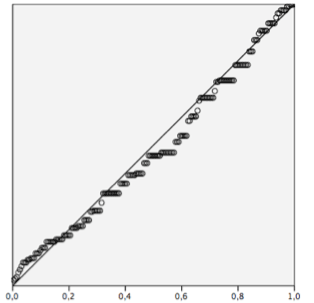
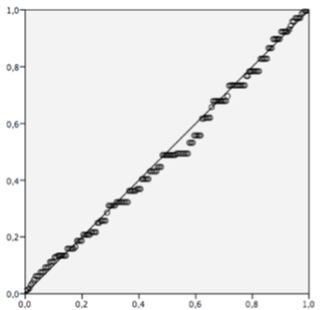
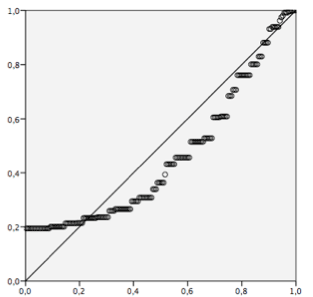
With linear regression analysis, the BI compared with Hammond’s equation showed a relationship of 95.7%, with Robinson’s 96.5% and with the weight calculated from ideal BMI (22.5kg/m2) 99.8%. (Figure.1-3). The linear regression analysis between the 4 IBW formulas, showed 100% relationship for both groups.

Figure 1. Linear regression Boca’s Index and Hammond’s formula.

Figure 2. Linear regression Boca’s Index and Robinson’s formula

Figure 3. Linear regression Boca’s Index and weight calculated with ideal BMI.
When compared considering different height ranges, <140cm, 141-150, 151-160, 161-170, 171-180, >1.81 we found no differences between both groups, but minor ranges of height tend to have less correlation with BI, and the ranges >160cm has a correlation higher than 50%.
Discussion
The most commonly used anthropometric measures used in clinical practice to initially assess the nutritional status of an individual, are weight and height. They are simple, practical and easily obtained. The calculation of the IBW of a patient has been searched for a long time. In the middle of the 19th century, Quetelet, a Belgium astronomist, developed an index showing that the body weight in adults was related to the quadrate height in a constant relationship. A few years later in 1871 a French surgeon, Pier Broca, pioneer in physical anthropology and known by his multiple works on the brain and cranial anthropometry, introduced in clinical practice the index that bears his name for the determination of this important parameter obtained in adults empirically by subtracting 100cm from the patient's height [3-5].
Historically, the IBW was defined as the one associated with the lowest mortality, which is why it has great importance. According to the actuarial data of insurers obtained from the evaluation of weight and height from a large healthy population, charts to obtain the IBW were created. The first documented table was published in 1913 by Medico-Actuarial Mortality Investigation and subsequently in 1942 the Metropolitan Life Insurance Company, released its own charts based on longevity [6,7]. Because of their lack of practicality, these tables were replaced by equations to estimate the ideal weight.
In 1963 and 1964, Hamwi [8] and Devine [9] developed and published formulas to calculate IBW to obtain the adequate doses of certain drugs according to it. Since then, several similar formulas and equations have been created for the same purpose through regression analysis of weight and height data like Robinson's [10] equation in 1983 developed with the same intention. In the same year, Miller et al. [11] also formulated other equations based on Metropolitan Life Insurance Company’s tables. More recently in 2000, Hammond [12] created a metric system version from the Hamwi equation.
It was not until the end of the 1970s, when it was suggested that BMI was preferable to other weight indexes to estimate the IBW [13]. Because adult weight increases proportionally to the square of height, BMI has a good correlation with fat mass with values ??of r 0.7 in population studies. Gray’s paramount study in 1989 showed that in a population of 750000 people, the BMI range between 20 to 25kg/m2 was the one that correlated better with the lower mortality rate, and that it increased exponentially as it increased, becoming more of 200% in patients with BMI >40 kg/m2 [13-16]. Therefore, BMI has also been used as criteria to determine a desirable weight range and is internationally accepted by both the World Health Organization (WHO) and the National Institutes of Health (NIH), defining the different intervals to classify patients as overweight, obesity I, II, morbid obesity or higher [16].
Any of the above-mentioned equations so far, as well as the ideal BMI can be used to calculate the IBW, however, they are not easy to use in daily clinical practice without a calculator and consumes time.
Some authors emphasize that a deeper analysis in this regard should be done, and that we should forget both the IBW and the BMI because of the disadvantage that they do not distinguish fat mass from fat-free mass [12], however, studies that analyze body composition and give us this data, are more expensive and are not available in everyday clinical practice.
Shan et al [1], compiled a list of IBW formulas used to evaluate the relationship between height-weight tables and IBW equations, and to determine which formula or table fit best within the BMI of 22 kg/m2 using linear regression and correlations, finding that most of the slopes of the formulas fall between BMI range of 20 to 25 kg/m2, with differences between men and women, therefore, they proposed that formulas could be used as a guide to asses body weight rather than assessing weight from various height-weight tables.
Our study was aimed to assess the validity of the BI. We wanted to know if there were differences between Hammond and Robinson equations and the weight calculated from ideal BMI of 22.5 kg/m2, and to asses if there were differences between obese and non-obese population, as well as between men and women and different ranks of height, so we divided the patients into two groups accordingly to their BMI greater or less than 30kg/m2 and analyzed the data separately between men and women and different ranges of height and to verify if there was difference between these groups in healthy adults. We did not include children since the utility of this index is limited to the adult population. Comparing the BI with the other three formulas used in this study, the comparative analysis using the t-student statistic and Pearson's correlation had statistical significance in both groups (p 0.000). When using linear regression, comparing all the mentioned formulas, a value of 100% (R2 1,000) was obtained, which seems to corroborate that the BI has the same accuracy as the other three equations and can be used for this propose with confidence independently of weight, BMI and height in adults. When we compared different height ranges we found that BI higher ranges have more correlation than lower ones.
Conclusion
It seems that BI offers the same accuracy as other more complex formulas such as Hammond and Robinson’s for the calculation of the IBW, and also correlates well with the weight calculated from ideal BMI, and that it continues to have validity and utility in clinical practice, so we promote its use in clinical practice in view of its simplicity and practicality.
Conflict of interest
The authors involved in this investigation declare that they don’t have conflict of interest.
Author’s contributions
Dr. Alejandro Weber: Conception and design of the investigation. Main author, principal reviewer and investigator. General supervisor.
Lic. Sofía Ortega: Investigator and reviewer, Acquisition of data and analysis.
Dr. Pablo Webe2021 Copyright OAT. All rights reservreviewer, Statistical analysis and interpretation of data.
References
- Shah B, Sucher K, Hollenbeck CB (2006) Comparison of ideal body weight equations and published height-weight tables with body mass index tables for healthy adults in the United States. Nut Clin Pract 21:312-319.
- Berrington de Gonzalez A, Hartge P, Cerhan JR, Flint AJ, Hannan L, et al. (2010) Body-mass index and mortality among 1.46 million white adults. N Engl J Med 363: 2211-2219. [Crossref]
- Peterson CM, Thomas DM, Blackburn GL, Heymsfield SB (2016) Universal equation for estimating ideal body weight and body weight at any BMI. Am J Clin Nutr 103: 1197-1203. [Crossref]
- Pai MP, Paloucek FP (2000) The origin of the "ideal" body weight equations. Ann Pharmacother 34: 1066-1069. [Crossref]
- Rössner S (2007) Paul Pierre Broca (1824-1880). Obes Rev 8: 277. [Crossref]
- Metropolitan Life Insurance Company (1942) Ideal weights for men. Stat Bull Metrop Life Insur Co 23:6–8.
- Metropolitan Life Insurance Company (1943) Ideal weight for women. Stat Bull Metrop Life Insur Co 24:6–8.
- Hamwi GL. (2033) Changing dietary conceptsin therapy. In: Danowski TS, editor. Diabetes mellitus: diagnosis and treat-ment, New York: American Diabetes Association, p. 73-8.
- Devine BJ (1974) Gentamicin therapy. Drug Intell Clin Pharm 8:650–655.
- Robinson JD, Lupkiewicz SM, Palenik L, Lopez LM, Ariet M (1983) Determination of ideal body weight for drug dosage calculations. Am J Hosp Pharm 40: 1016-1019. [Crossref]
- Miller DR, Carlson JD, Lloyd BJ, Day BJ (1983) Determining ideal body ? weight (and mass). Am J Hosp Pharm 40:1622–1625.
- Hammond KA. (2000) Dietary and clinical assessment. In: Mahan LK, Stump SE, editors. Krause’s food, nutrition, & diet therapy. (11th Edition), Saunders, Philadelphia, p. 353–79.
- Müller MJ1 (2016) Ideal body weight or BMI: so, what's it to be? Am J Clin Nutr 103: 1193-1194. [Crossref]
- Flegal KM, Kit BK, Orpana H, Graubard BI (2013) Association of all-cause mortality with overweight and obesity using standard body mass index categories: a systematic review and meta-analysis. JAMA 309: 71-82. [Crossref]
- Wang ZJ, Zhou YJ, Galper BZ, et al. (2015) Association of body mass index with mortality and cardiovascular events for patients with coronary artery disease: a systematic review and meta-analysis. Heart 101:1631-1638.
- Gray DS (1989) Diagnosis and prevalence of obesity. Med Clin North Am 73:1-13.
- Hruby A, Hu FB (2015) The Epidemiology of Obesity: A Big Picture. Pharmacoeconomics 33: 673-689. [Crossref]


