Abstract
Background
Participant experience in clinical research is critical to recruitment, retention, and overall study quality. While Press Ganey surveys are widely used in hospitals to assess patient satisfaction, there is no standardized post-visit evaluation tool for clinical research settings. This study aimed to assess the experiences of research participants at the NYU Clinical Research Centers (CRCs) across the New York Metropolitan area.
Methods
A survey informed by the Hierarchical Service Quality Model and adapted from the Press Ganey Outpatient Services Survey was developed and distributed to English-speaking participants (≥ 18 years) enrolled in studies at NYU CRCs in Manhattan, Brooklyn, and Long Island. Data were collected via REDCap and analyzed using SPSS and Stata. Descriptive statistics summarized demographic data and satisfaction responses. Chi-square and independent t-tests assessed associations between participant motivations and geographic indicators, including Area Deprivation Index (ADI) and Health Professional Shortage Area (HPSA) scores.
Results
Among 158 participants, the majority reported high satisfaction with staff professionalism, communication, and facility quality. Most respondents were white (47%) and held graduate or professional degrees (42%), with underrepresentation of individuals from high-ADI ZIP codes.
All participants resided in areas with high HPSA scores, but none were from ZIP codes with ADI ≥ 85. Statistically significant associations were found between altruistic motivation and both lower ADI (p = 0.0345) and higher HPSA scores (p = 0.002), suggesting complex patterns of geographic inequity in research participation.
Keywords
research participant experience, quality improvement, patient retention, research participant satisfaction, clinical trials
Conclusions
This study highlights high satisfaction among research participants but reveals gaps in representation from socioeconomically disadvantaged areas. Findings underscore the importance of translating surveys, tailoring outreach, and addressing structural barriers. Broader implementation of standardized participant feedback tools may improve equity, retention, and quality in clinical research.
Introduction
High-quality clinical research is essential for driving medical innovation and advancing patient-centered care. Its success depends not only on scientific rigor but also on enrolling and retaining participants who are engaged and confident in the research process. There is a dearth of literature on the best-practices in evaluating patient experience in clinical research, particularly in underserved and community healthcare settings [1-2]. While satisfaction and experience are often used interchangeably in the literature, the Agency for Healthcare Research and Quality distinguishes the two: satisfaction refers to whether expectations were met, whereas experience reflects the participant’s perception of what actually occurred during the healthcare or research encounter [3]. This distinction is critical to ensure accurate assessment of the participant’s voice and to inform responsive improvements in study environments.
Furthermore, limited research is available connecting patient experience as it relates to specific populations, diseases, and clinical trials [2,4,5]. Current methods to evaluate whether researchers are achieving these goals primarily focus on learning why a participant might join a study and their understanding of the research [6]. Although participants’ experiences in clinical research can significantly influence their adherence to study protocols and retention, limited data has been collected on this perspective [7]. The literature has demonstrated that patient feedback leads to improvements in clinical care, such as better communication among healthcare teams and informs best practice [4,8]. It is standard practice to gather feedback from hospitalized and ambulatory patients about various aspects of their healthcare experience, but a very limited number of national institutions have implemented surveys to exclusively gauge research participant experience [9]. It is important to consider research participants' perceptions of their experiences within a study to enhance patient retention and satisfaction [10]. This may involve assessment of the participant’s comfort level during appointments, the clarity of communication from the research team, and the support they receive for participation [11]. Quality evaluation of the research participant’s perspective will better equip research teams to consider participants' viewpoints when designing and conducting clinical studies [4].
Recognizing this, the NYU Clinical and Translational Science Institute (NYU CTSI) has prioritized creating a more inclusive and supportive research environment. This initiative is informed by direct research participant feedback, collected through a comprehensive experience survey administered across the NYU Clinical Research Center (CRC) Network in Manhattan, Brooklyn, and Long Island. CRCs are ambulatory research units where participants are typically seen on an outpatient basis, underscoring the need for a patient-centered approach in non-inpatient research settings. This study applies the Hierarchical Service Quality Model (HSQM), which evaluates service quality across multiple dimensions such as interaction quality, environment, and perceived outcomes [12]. It also incorporates the Clinical Research as a Care Option (CRAACO) framework, which promotes integrating research participation as a standard part of clinical care [13]. By using these models, the study aims to elevate the participant’s voice and position research as a meaningful care experience. The NYU CTSI provides essential services and resources to principal investigators and provides oversight of clinical research conducted at the NYU CRCs. While thousands of research participants visit the CRCs to participate in clinical research, their experience has not yet been formally assessed. This quality improvement project aimed to evaluate participant experience across the NYU CRC network and identify actionable insights to enhance research delivery and satisfaction.
Materials and methods
To build the survey we conducted a literature review to understand current practices and frameworks related to research participant experience. Additionally, the NYU Langone Health Press Ganey Outpatient Services Survey, routinely administered to ambulatory patients by many hospital systems, served as a foundation [14,15]. Our survey design was informed by prior work applying service-based frameworks to clinical settings, such as Lee et al. [4], and by the HSQM developed by Brady et al. [12]. This model evaluates service quality across three key dimensions: participant-staff interactions, the physical environment, and perceived care quality.
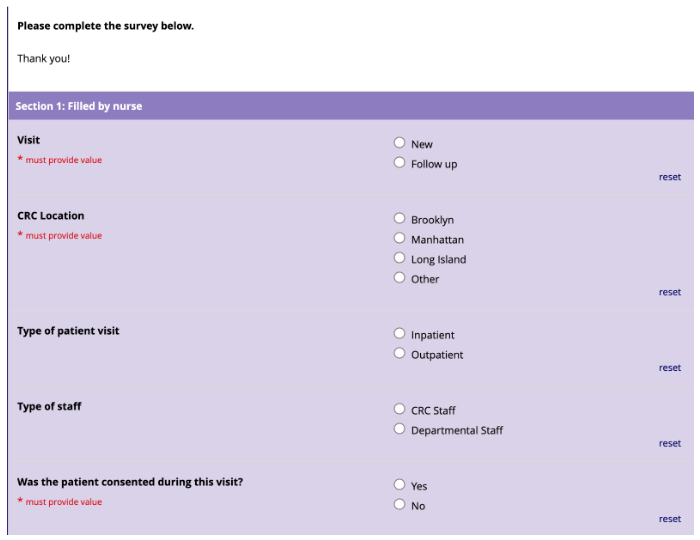
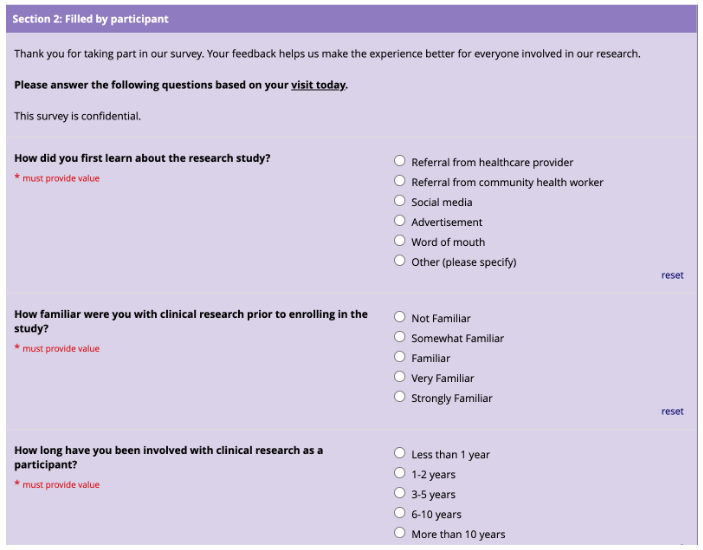
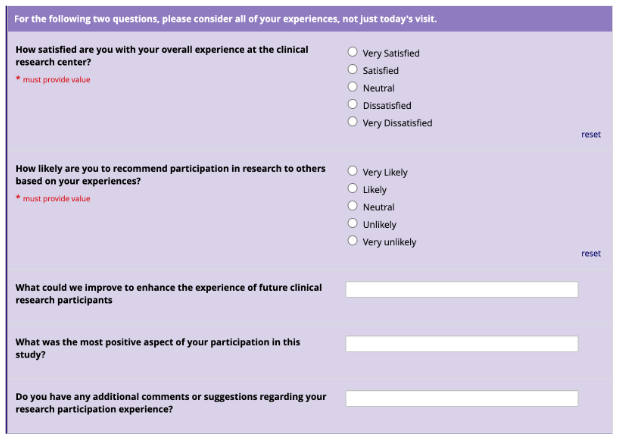
To adapt this framework to our research context, we incorporated iterative feedback from key stakeholders throughout the survey development process. Content experts in survey design and implementation were consulted for initial drafting, and input was gathered from specialized patient groups, faculty, and community stakeholders to further refine the survey. These included the Patient Advisory Council for Research (PACR), the Community Advisory Board (CAB), and the Community Engagement and Population Health Research (CEPHR) program. These groups, composed of patients, faculty, and community leaders, offered critical insights that helped tailor the survey to reflect the lived experiences of diverse populations. This collaborative, multi-stakeholder approach enhanced the inclusiveness and generalizability of the final instrument (Appendix 1 – Survey).
The inclusion criteria for survey participation were as follows:
● Participants who report English as their primary language.
● Participants older than or equal to 18 years of age.
● Participants already enrolled in a clinical research study at the NYU Manhattan,
Brooklyn, or Long Island CRC (new visit or follow up).
To more accurately reflect participants’ overall experience, the survey was administered toward the end of their visit. Medical students worked with the CRC research staff to recruit survey participants. The survey was either completed on a provided iPad with a QR code linked to the RedCap Database Survey, or completed using the QR code after their visit on their own personal devices. Chi square and t-tests were used to analyze the surveys and identify potential associations. To assess disparities in socioeconomic status and healthcare access, we incorporated two validated indices; the Area Deprivation Index (ADI) and the Health Professional Shortage Area (HPSA) score. The ADI ranks neighborhoods on a national scale from 0 to 100 (and 0 to 10 at the state level), with higher scores indicating greater socioeconomic disadvantage. The HPSA score ranges from 0 to 25, with higher scores reflecting greater shortages of primary or mental healthcare providers.
Survey data were analyzed using SPSS and Stata. Descriptive statistics were used to summarize participant demographics and survey responses. Chi-square tests were used to assess associations between categorical variables, such as participant motivations and demographic characteristics. Independent t-tests were employed to compare geographic indicators (ADI and HPSA scores) across participant groups based on reported motivations. An α level of ≤0.05 was considered statistically significant.
Results
Patient demographics
Between July 2024 and March 2025, a total of 158 survey responses were collected across NYU Clinical Research Centers (CRCs). Respondents were stratified by race/ethnicity, educational level, and neighborhood-level disadvantage using the Area Deprivation Index (ADI). Participants were recruited from all three CRC sites, with equal representation from Manhattan (40.5%) and Long Island (40.5%), and a smaller proportion from Brooklyn (19.0%). Most respondents identified as White (47%), with additional representation from Hispanic or Latino (21%), Black or African American (17%), and Asian (14%) populations.
Educational attainment was notably high: 42% of participants reported holding a graduate or professional degree, 27% held a bachelor’s degree, and only 2% had less than a high school education. Age distribution was similarly skewed toward older adults, with 43% aged 65 or older and 23% aged 55–64, indicating that two-thirds (66%) of respondents were over the age of 55. Female participants comprised 54% of the cohort, and 58% of all respondents reported being married. The vast majority were follow-up visit attendees.
Geographically, all participants resided in ZIP codes with Health Professional Shortage Area (HPSA) scores of 14 or higher, signifying federally designated provider shortages. However, none of the respondents were from ZIP codes with ADI national percentile scores of 85 or higher.
Participant motivations for study enrollment
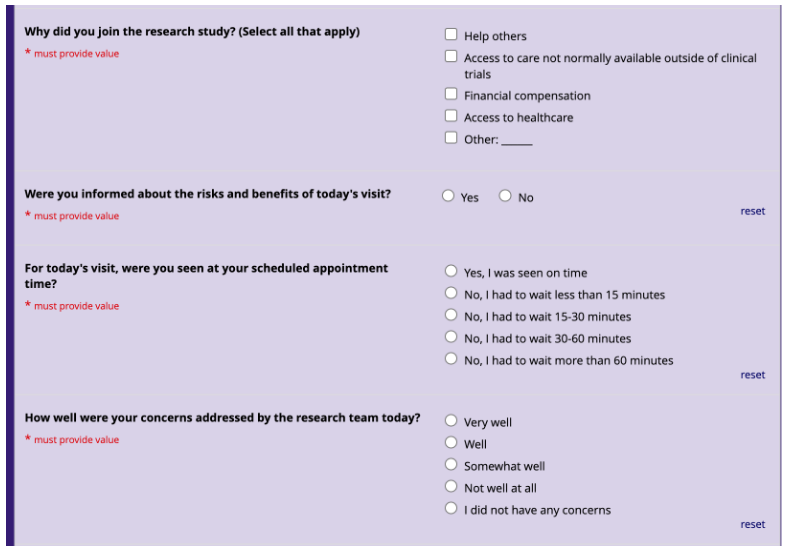
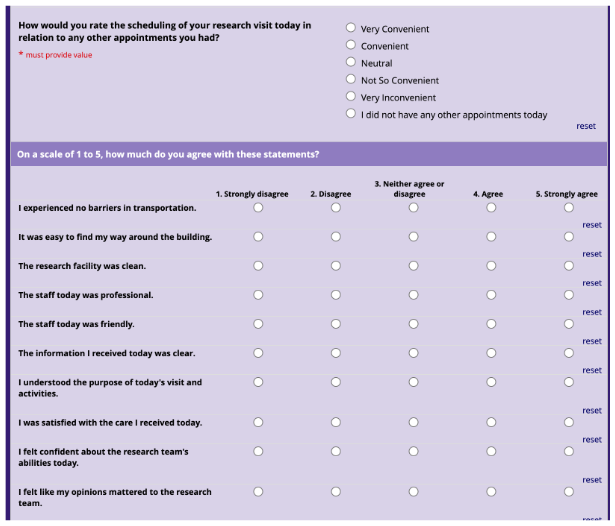
Participants (n = 158) were asked to select motivations for joining the research study (Figure 1). The most frequently reported reason was the desire to help others, followed by access to care not normally available, financial compensation, and access to healthcare. Open-ended responses highlighted areas for improvement, such as the communication style and professional boundaries of physicians and waiting times for data collection. Several participants indicated there was nothing to improve or left this section blank. Participants most frequently cited staff interaction, health benefits, and study participation as positive aspects of their experience. The majority of open-ended responses reflected favorable impressions. Of the 158 participants, 80 (50.6%) provided open-ended responses highlighting positive aspects of their experience. Common themes included appreciation for staff friendliness, professionalism, and the opportunity to contribute to research. A few open-ended responses also noted challenges with wayfinding and suggested clearer signage or directions within the research facility. Among participants who indicated financial compensation as a motivation for study participation, the most racially and ethnically diverse representation was observed: 44.4% identified as White, 22.2% as Black or African American, 19.4% as Hispanic or Latino, and 11.1% as Asian. Percentages reflect self-identified categories, with some participants selecting more than one race or ethnicity.
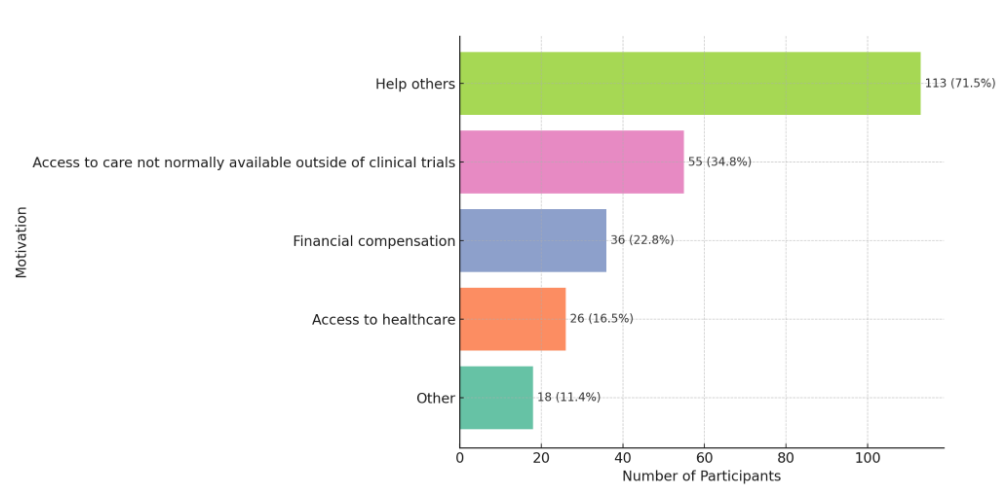
Figure 1. Participant motivations for study enrollment
Figure 1 illustrates the primary motivations selected by participants (n = 158) for enrolling in the study. Respondents were allowed to choose multiple reasons. The most commonly reported motivation was the desire to help others (71.5%), followed by access to care not normally available outside of clinical trials (34.8%), financial compensation (22.8%), access to general healthcare (16.5%), and other reasons (11.4%). These findings suggest that altruistic intent was the predominant driver of participation, though access-related and financial factors also played a role Additional chi-square analyses revealed statistically significant associations between participant motivation and both race/ethnicity and CRC site. Race/ethnicity was significantly associated with selecting “helping others” as a motivation for participating (χ²(4) = 14.81, p = 0.005), with Black and Asian participants most frequently citing altruism. Conversely, White and Hispanic participants were more likely to cite access to healthcare (χ²(4) = 10.87, p = 0.028). A significant association was also found between CRC site and selecting “access to care not normally available outside of clinical trials” as a motivation (χ²(2) = 6.43, p = 0.040), with Brooklyn participants more likely to cite this reason than those in Manhattan or Long Island.
Additional exploratory analyses found no statistically significant associations between how participants learned about the study and their race/ethnicity (χ²(5) = 7.11, p = 0.212) or Area Deprivation Index (ADI) scores. These results suggest that recruitment methods (e.g., provider referral, social media, and word of mouth) were broadly similar across demographic and socioeconomic groups.
Figure 2 highlights variation in motivational patterns across educational levels. Altruism was a consistent theme, with a high proportion of participants across all education levels indicating they joined to help others. Specifically, 70.7% of those with a graduate or professional degree, 80.8% with a bachelor’s degree, and 100% of participants with associate degrees or less than high school education cited helping others as a reason for participation.
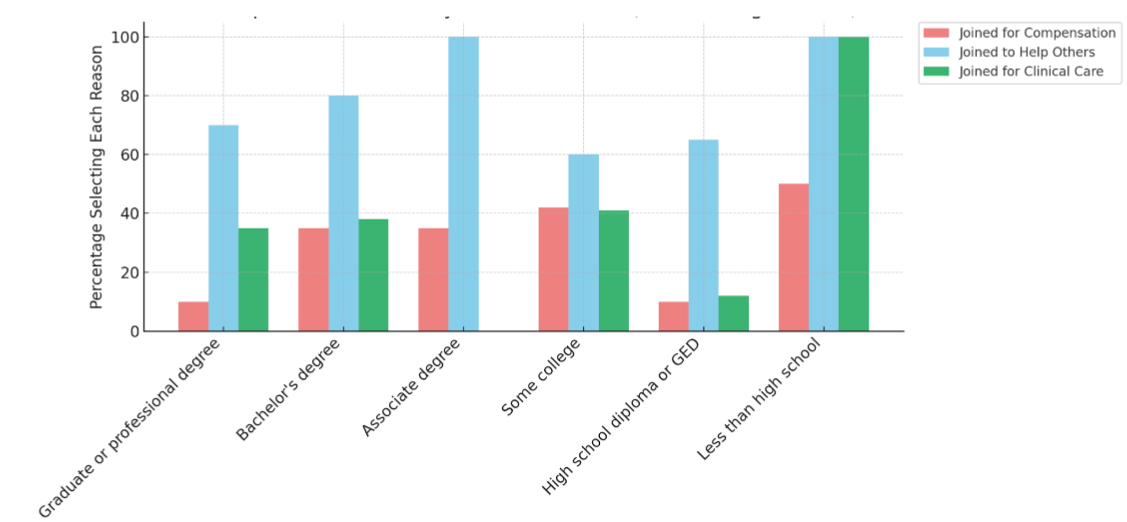
Figure 2. Participant motivations by education level
Figure 2 displays the percentage of participants selecting each primary motivation for study participation, stratified by education level: less than high school, high school diploma or GED, some college, associate degree, bachelor’s degree, and graduate or professional degree. The motivations include: joined for compensation, joined to help others, and joined for clinical care.
To explore potential associations between geographic disadvantage and participant motivations, independent t-tests and Chi-square analyses were conducted. Participants who reported enrolling to “help others” resided in areas with significantly lower socioeconomic deprivation, as reflected by lower ADI national percentiles (p = 0.0345), and were more likely to live in areas with greater provider shortages based on higher HPSA scores (p = 0.002).
Chi-square analysis also revealed significant geographic variation by clinical research center (CRC) location. Participants from the Brooklyn site were significantly more likely to report joining the study to access clinical care compared to those from Manhattan and Long Island (p = 0.040).
Educational attainment further influenced reported motivations. Among participants with less than a high school education, 100% indicated they joined to access clinical care, and 50% cited financial compensation as a motivating factor.
ADI and HPSA analysis: Analysis of socioeconomic and provider shortage data
To evaluate disparities in access to clinical research participation, ADI and HPSA scores were analyzed across participant ZIP codes, counties, and affiliated NYU CRC sites. ADI scores reflect socioeconomic disadvantage, with higher scores indicating greater deprivation (ranging from 0–10 at the state level and 0–100 at the national level). HPSA scores range from 0–25, with higher scores indicating greater shortages in access to primary or mental healthcare providers.
Using nationally recognized thresholds (ADI ≥ 85 and HPSA score ≥ 14), no participants met the criteria for experiencing both high deprivation and high provider shortage. Most participants resided in ZIP codes with low to moderate ADI scores. National ADI scores for the sample ranged from 2.0–32.5, while state-level ADI scores ranged from 1.0–5.5. In contrast, all participants lived in ZIP codes with HPSA scores above 14, indicating that the entire sample was drawn from areas officially designated as having significant provider shortages. ZIP codes with the highest HPSA scores (score of 19) were concentrated in Nassau and Suffolk counties.
County and ADI patterns
ADI scores were analyzed across eight New York counties to assess variation in socioeconomic disadvantage (Table 1). Albany County had the highest ADI scores among the counties in the dataset, with a national average of 19.88 and a state average of 4.33. Suffolk County followed with a national ADI of 18.40 and a state ADI of 3.96. Kings County (Brooklyn) reported a national ADI of 15.53 and state ADI of 3.81, while Nassau County had scores of 14.75 (national) and 3.35 (state). Queens County had a national ADI of 14.56 and a state ADI of 3.54.
|
County name |
ADI national average |
ADI state average |
0 |
Albany County, NY |
19.88 |
4.33 |
8 |
Suffolk County, NY |
18.4 |
3.96 |
2 |
Kings County, NY |
15.53 |
3.81 |
3 |
Nassau County, NY |
14.75 |
3.35 |
5 |
Queens County, NY |
14.56 |
3.54 |
1 |
Bronx County, NY |
14.22 |
3.87 |
6 |
Richmond County, NY |
12.95 |
3.51 |
7 |
Schenectady County, NY |
12.5 |
3.5 |
4 |
New York County, NY |
11.68 |
3.14 |
Table 1. County-Level ADI National and State Averages in New York State
Bronx County reported a national ADI of 14.22 and state ADI of 3.87. Richmond County (Staten Island) and Schenectady County had lower national ADI scores of 12.95 and 12.50, respectively, with state averages of 3.51 and 3.50. New York County (Manhattan) had the lowest ADI values in the dataset, with a national average of 11.68 and a state average of 3.14.
All counties analyzed fell below a national ADI threshold of 33 and a state ADI threshold of 5.5, indicating that the participant sample was drawn from areas with relatively low to moderate levels of socioeconomic deprivation.
Note: The ADI reflects socioeconomic disadvantage, with higher scores indicating greater deprivation. National ADI scores range from 0 (least disadvantaged) to 100 (most disadvantaged), while state-level ADI scores range from 1 (least disadvantaged) to 10 (most disadvantaged).
CRC site-level analysis
The number of participants each CRC recruited, along with the average ADI and HPSA scores of their corresponding ZIP codes, is shown in Table 2. While no CRC site reached individuals from areas meeting both ADI and HPSA national thresholds, the uniform presence of provider shortage ZIP codes across sites indicates consistent recruitment from medically underserved areas.
CRC location |
Participants |
Avg_ADI |
Avg_HPSA |
Brooklyn |
22 |
13.79 |
17.11 |
Long Island |
29 |
16.01 |
18.43 |
Manhattan |
44 |
14 |
17.73 |
Table 2. Clinical Research Center (CRC) ADI and HPSA Stratification
Note: Table 2 displays the number of participants recruited at each Clinical Research Center (CRC) site (Brooklyn, Long Island, and Manhattan), along with the average Area Deprivation Index (ADI) and Health Professional Shortage Area (HPSA) scores associated with participants’ ZIP codes. ADI values reflect socioeconomic disadvantage (0–100 scale), while HPSA scores represent provider shortages (0–25 scale, with higher scores indicating greater need). Only participants with valid ZIP code data (n < 159) were included in this geographic analysis.
Overlap between social and provider shortages
Figure 3 presents a scatterplot mapping participant locations by ADI national average and HPSA score. While some participants resided in areas with elevated ADI or HPSA scores, no individuals were located in the upper-right quadrant, indicative of the dual burden of high social deprivation and limited healthcare provider access based on national benchmarks.
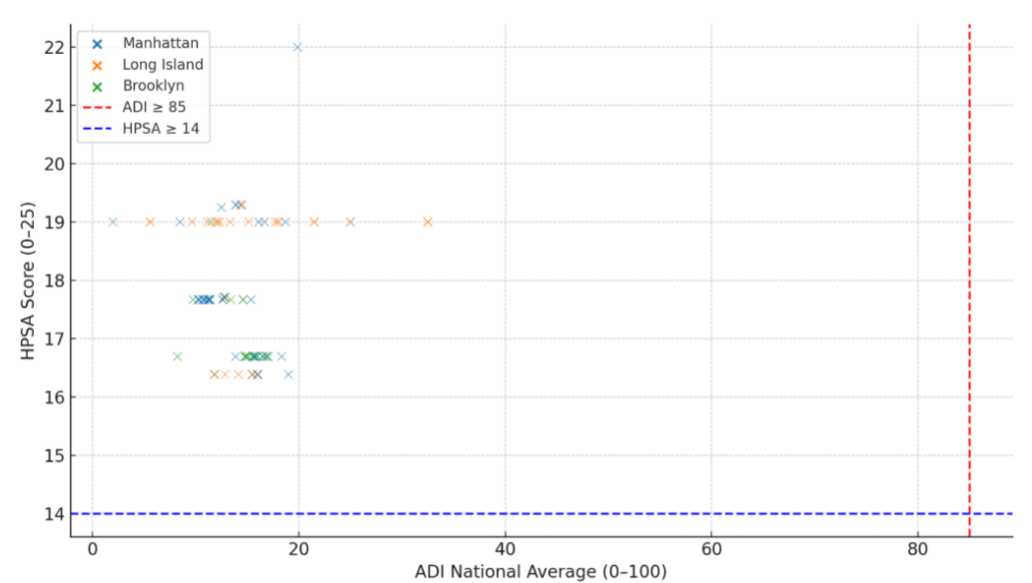
Figure 3. Participant Zip Codes by ADI and HPSA score
Figure 3 displays a scatterplot of participant ZIP codes stratified by Area Deprivation Index (ADI) national average (x-axis) and Health Professional Shortage Area (HPSA) score (y-axis). Each point represents a participant ZIP code, colored by Clinical Research Center (CRC) site: Manhattan, Long Island, or Brooklyn. The red dashed line marks the national ADI threshold for high deprivation (ADI ≥ 85), and the blue dashed line marks the HPSA threshold for provider shortage designation (HPSA ≥ 14). The absence of participants in the upper-right quadrant indicates a recruitment gap from areas with both high social and healthcare provider disadvantage
The scatter plot in Figure 4 visualizes the distribution of participants’ responses across state ADI averages, which ranged from 1 (least disadvantaged) to 5.5 (most disadvantaged) in this sample. The plot illustrates overwhelmingly positive responses across all ADI levels, with the majority of participants indicating they were “Very likely” to recommend research participation. Responses of “Likely” and “Neutral” were present but less frequent across all ADI values.
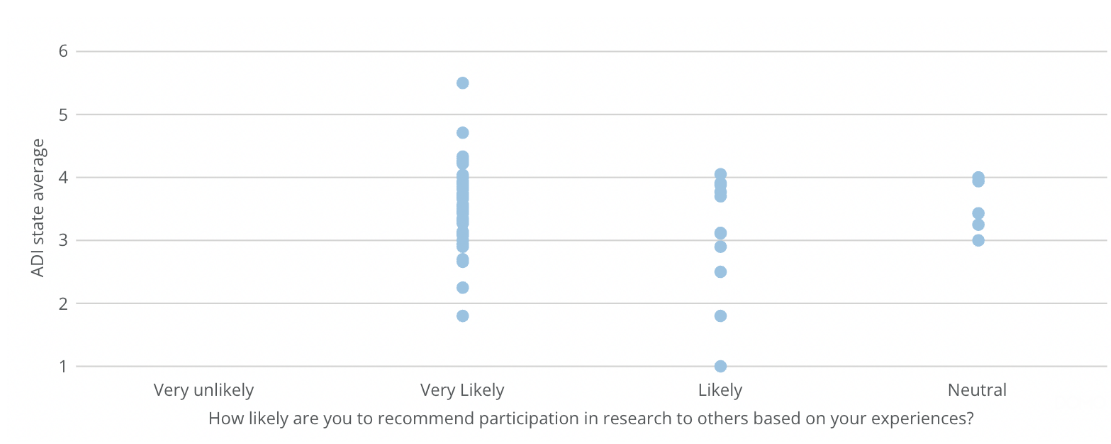
Figure 4. ADI state average and likelihood of recommending research to others
Figure 4 displays the relationship between participants’ state-level Area Deprivation Index (ADI) averages and their reported likelihood of recommending research participation to others. Each point represents an individual respondent, stratified by their answer to the question: “How likely are you to recommend participation in research to others based on your experiences?” Responses range from “Very unlikely” to “Very likely.” The state ADI score ranges from 1 (least disadvantaged) to 10 (most disadvantaged). The average state ADI among all participants was 3.57. Out of 127 responses, 100 individuals responded “Very likely,” 22 responded “Likely,” and 5 responded “Neutral”
Implications for equitable recruitment based on geography and education
Analysis of ADI and HPSA scores stratified by educational attainment revealed nuanced geographic trends. Participants with graduate or professional degrees had the highest average HPSA scores (18.2) but relatively lower ADI national percentile scores (14.96), indicating residence in areas with provider shortages yet lower levels of socioeconomic deprivation. In contrast, individuals with less than a high school education demonstrated the highest average ADI national (15.52) and state percentile scores (3.73), but lower HPSA scores (16.69), suggesting a concentration in socioeconomically disadvantaged areas that may not be federally designated as provider-shortage zones.
Discussion
Overview of participant representation and access
This study utilized the HSQM model, focusing on participant experience in clinical research interactions, physical environment, and quality improvement to examine patterns in research participant demographics, motivations, and geographic origins across the NYU CRCs. It also incorporated structural indicators such as ADI and HPSA to provide deeper insight. While participant satisfaction was high overall, deeper analysis of geographic and demographic data revealed important findings about equity and representation.
Although recruitment successfully reached participants from ZIP codes with HPSA scores ≥14, indicating federally recognized provider shortages, none were from ZIP codes with ADI scores ≥85, suggesting opportunities to strengthen engagement with communities experiencing the highest levels of socioeconomic deprivation.This finding indicates a lack of representation from the most socioeconomically disadvantaged neighborhoods. Additionally, because the survey was administered in English and conducted exclusively within ambulatory NYU CRCs across the New York Metropolitan area, future efforts could expand participation to include individuals who speak other primary languages or receive care in inpatient or community-based settings.
Motivational trends and demographic differences
Participant motivations varied significantly across demographic lines. Altruism was the most commonly cited reason for participation across all education levels, with 70.7% of graduate degree holders and 100% of those with less than a high school education citing the desire to help others. However, need-based motivations such as financial compensation and access to healthcare were more common among participants with lower educational attainment. For example, participants without a high school diploma were the most likely to join for clinical care access (100%) and had the highest rate of financial compensation motivation (50%).
Furthermore, financial need was observed across racial and ethnic groups. Among those citing compensation as a motivator, 38.9% were White, 25% African American, 19.4% Hispanic or Latino, and 11.1% Asian. These findings highlight that socioeconomic vulnerability is intersectional and extends across racial and ethnic categories.
Motivational patterns also varied by age and gender. Younger participants and those with fewer formal educational credentials were more driven by compensation, while older and more educated individuals reported altruism and access to care as primary motivators. Women were overrepresented across all motivation categories, aligning with existing literature on gendered participation in healthcare research.
These findings suggest that participation in clinical research may serve multiple purposes. While some individuals are driven by a desire to support scientific progress, others see research as a pathway to meet unmet personal or healthcare needs. In recognition of this, NYU CRCs have expanded efforts to integrate the CRAACO model, particularly for participants who cite care access or financial need as primary motivators. This approach not only meets participants where they are but also positions research participation as a viable and trusted entry point to the broader healthcare system [16,17].
Increasingly, patients and prospective participants are acting as informed healthcare consumers by engaging with clinical research through digital platforms that provide clinician information, trial listings, and peer reviews [18]. While this access empowers patients to make informed decisions, the variability in the quality of online information can create mismatches between expectations and actual research experiences [19,20]. Understanding and managing these expectations is essential to building trust and promoting long-term engagement.
In this context, CRCs not only serve as hubs for research recruitment and implementation but also act as entry points into the healthcare system for individuals seeking care, creating a much-needed space for CRAACO. By addressing both informational and access-related gaps, CRCs can strengthen their role in delivering participant-centered and socially responsive research engagement.
Implications for equitable recruitment based on geography and education
The intersection of geographic indicators and participant demographics reveals a complex, and at times inconsistent, landscape of structural inequity. Notably, among the 158 participants surveyed, those with higher educational attainment tended to reside in areas with greater provider shortages (high HPSA scores) but lower socioeconomic deprivation (low ADI scores). While limited in sample size, this observation may indicate that federally designated HPSAs do not always capture localized disparities in healthcare access. In regions such as New York City and its surrounding areas, individual ZIP codes may contain both advantaged and underserved neighborhoods. As a result, HPSA designations applied at the ZIP code level may obscure within-area variation in access to care.
Conversely, participants with lower educational attainment were frequently located in areas with higher ADI scores, suggesting greater socioeconomic disadvantage, though many of these areas lacked corresponding HPSA designations. This may reflect limitations in federal metrics, which could underrepresent certain underserved populations when provider shortages are assessed using broader geographic units.
Racial and ethnic differences in geographic context further illustrate this mismatch. White participants had the highest average national ADI scores (15.63), whereas Hispanic/Latino participants came from areas with the lowest ADI scores (13.65) but moderate HPSA scores (17.61). These preliminary findings suggest that structural indicators like ADI and HPSA may not always align with participants’ lived experiences or perceived barriers to care. Further investigation with a larger sample is warranted to explore these relationships more robustly.
This highlights the value of integrating geographic data with participant-reported motivations and experiences to inform equitable recruitment strategies. Relying solely on structural indices may overlook communities that are underserved in less visible or measurable ways.
Finally, Figure 3 illustrates a notable gap in recruitment from the most underserved areas. However, the presence of participants in the upper-left quadrant (low ADI, high HPSA) indicates that barriers to healthcare access can persist even in communities with relative socioeconomic advantage—further complicating assumptions based on structural metrics alone.
Implications for recruitment and equity
Current recruitment strategies at NYU CRCs appear effective in engaging participants from medically underserved areas based on HPSA designations. However, they are less effective in reaching individuals from ZIP codes with high ADI scores, which reflect greater socioeconomic disadvantage. This discrepancy underscores the need to align structural outreach with more nuanced understandings of community-level deprivation.
Enhancing participant experience serves both ethical and institutional purposes. Prior research has demonstrated that high-quality participant experiences are associated with improved adherence, better health outcomes, and reduced legal risk for healthcare institutions [21-23]. This reinforces the importance of designing inclusive, patient-centered, and trust-building research environments.
Targeting recruitment in high-ADI communities presents specific challenges. Individuals in these areas may face disproportionate barriers to participation, including limited transportation options, language access, and lower health literacy. Addressing these barriers is essential to promoting equity in clinical research and ensuring that participant pools reflect the diversity of those most impacted by health disparities.
Beyond equity, improving participant experience can yield strategic institutional benefits. Studies show that high patient experience ratings are associated with increased retention, improved satisfaction, and a greater likelihood of participants joining future studies [22,24]. Publicly available metrics, such as communication quality, medication education, and cleanliness, as seen on Medicare’s Care Compare, now influence how patients evaluate both clinical and research services. Incorporating participant feedback and transparently reporting experience data fosters “patient activation,” a measure of individuals' knowledge, skills, and confidence in managing their care, which has been linked to improved outcomes across settings [25].
Finally, the demographic profile of this sample reflects both strengths and areas for improvement. Hispanic participants were well represented, but lower proportions of Black and Asian respondents may indicate ongoing structural barriers or limitations in outreach. Additionally, the high concentration of participants with graduate degrees suggests the sample may skew toward individuals with higher health literacy and institutional trust. This points to the need for enhanced efforts to reach individuals with lower educational attainment, who may face greater informational, logistical, and cultural barriers to research participation.
Participant advocacy and future engagement
Participants from higher-ADI areas who reported being “very likely” to recommend clinical research participation may represent a valuable resource for community-based recruitment. These individuals could serve as informal ambassadors, helping expand outreach in underserved neighborhoods by sharing their experiences and encouraging peer engagement. Partnering with such participants in future recruitment campaigns may support more organic, grassroots expansion of clinical research access.
Figure 4 shows a slight clustering of “Likely” and “Neutral” recommendation responses among participants from lower-ADI ZIP codes. This pattern may indicate that individuals from more socioeconomically advantaged areas were slightly less enthusiastic about endorsing research participation, although overall attitudes remained supportive. These differences could reflect variations in perceived benefits, exposure to clinical research, or community-level norms around participation.
Additionally, statistically significant associations between altruistic motivations and both ADI (p = 0.0345) and HPSA (p = 0.002) scores suggest that participants from disadvantaged areas are often driven by a desire to contribute to the greater good. Acknowledging and amplifying this altruistic intent in recruitment materials and institutional messaging may strengthen trust and long-term engagement, particularly among populations that have historically been underrepresented in research.
Limitations
A key limitation of this analysis is the incomplete availability of ZIP code data that limits the complete analysis of the relationship between socioeconomic deprivation (ADI) and patient satisfaction and potentially introduces enrollment bias. Of the 159 participants, 27 did not provide their ZIP code, preventing the calculation of ADI for these individuals. This missing data is distributed across various demographic groups, with 7 participants each from the 18-29 and 30-45 age ranges, 5 from the 46-54 range, 4 from the 55-64 range, and 3 aged 65 and older. Additionally, 10 of these individuals held a graduate or professional degree, 7 had a bachelor’s degree, 4 had a high school diploma or GED, 4 had some college education, and 1 did not respond. Furthermore, to maintain anonymity, we did not measure quality outcomes per respondent thus hindering our ability to evaluate other safety and quality metrics and generate follow up queries. Additionally, self-reported data may introduce potential responder bias that can affect internal validity. As mentioned, the survey was administered exclusively in English that likely skewed the demographic representation, underrepresenting non-English-speaking populations who participate in research at the NYU clinical research centers. At our Brooklyn clinical research center, 30% of our population are non-English speaking.
Next steps
Several opportunities identified here are actionable. First, translating surveys into languages other than English, particularly those commonly spoken by patient populations at each CRC site will help gather more inclusive feedback, especially from non-English speaking participants. Offering incentives or promotion for survey completion may significantly increase response rates and ensure a more robust dataset. These incentives can be in the form of monetary rewards, gift cards, or other forms of recognition for their time and contribution to the research. Providing research patients with more frequent updates about study findings will keep them engaged and informed. Regular communication about the progress and outcomes of the study can enhance participants’ sense of involvement and trust, making them feel like active members in the research process. This can be supported through accessible platforms, such as social media posts or newsletters, to keep participants and the broader community informed and engaged.
In parallel, targeted recruitment efforts focused on ZIP codes characterized by both high Area Deprivation Index (ADI) and high Health Professional Shortage Area (HPSA) scores may help address observed gaps in geographic and demographic representation. Collaborating with local organizations, faith-based institutions, and trusted community leaders can enhance outreach effectiveness and foster trust within underrepresented populations. In addition, adapting outreach materials and logistical support such as providing transportation assistance, offering multilingual survey instruments, and accommodating flexible visit schedules may improve accessibility for structurally disadvantaged individuals.
It is also essential that engagement strategies reflect the diverse motivations of potential participants. Messaging that emphasizes community benefit and improved access to care may be particularly compelling in underserved areas, whereas campaigns highlighting innovation and altruistic impact may resonate more strongly with individuals of higher educational attainment. Aligning recruitment approaches with participant values and community context can enhance inclusivity and effectiveness in clinical research enrollment.
Finally, partnering with Press Ganey to administer an institution-wide research patient experience survey can standardize the feedback process across all research activities. This collaboration can ensure consistent data collection and provide a comprehensive view of research patient experience across the institution. Standardized data collection on the research participant experience is vital in developing a bidirectional relationship working to optimize the participant experience while continuously receiving feedback. By implementing these recommendations, the research team can improve the quality and inclusivity of their surveys, ultimately leading to better patient experiences and more reliable data.
Conclusion
This quality improvement initiative offers one of the first formal assessments of research participant experience in a unique urban setting. Findings from the participant survey conducted at the NYU CTSI CRCs demonstrate high levels of satisfaction across key domains such as staff professionalism, clarity of communication, and perceived value of participation. Demographic and geographic analyses revealed opportunities for improvement, particularly in reaching participants from socioeconomically disadvantaged ZIP codes, those who report primary language other than English, and those with lower educational attainment.
Despite universal recruitment from provider-shortage areas as defined by HPSA scores, individuals from the most socially deprived ZIP codes, indicated by high ADI scores, and were notably absent from the sample. This geographic gap highlights an important limitation in current recruitment strategies. Motivational patterns varied by education, age, race/ethnicity, and socioeconomic background, underscoring the importance of tailoring outreach and engagement strategies to reflect participants’ lived experiences and diverse reasons for participating in research.
These findings carry significant implications for the design of more inclusive and equitable clinical research environments. By integrating structural metrics like ADI and HPSA with participant-reported motivations and barriers, institutions can better target outreach, reduce access gaps, and improve participant diversity. Future steps such as multilingual survey administration, logistical support, and community-based partnerships will enhance both the inclusivity of feedback and the equity of clinical research participation.
Ultimately, standardizing participant experience assessment across research activities through partnerships with tools like Press Ganey can strengthen institutional learning and responsiveness. This initiative lays the groundwork for a nationally adaptable model of participant-centered research engagement, one that advances both scientific rigor and health equity.
Ethics approval and consent to participate
This study was reviewed and deemed exempt from IRB oversight. IRB Study Number: Not applicable.
Consent for publication
Not applicable.
Availability of data and materials
The datasets generated and/or analyzed during the current study are available from the corresponding author upon reasonable request.
Conflicts of interest
The authors declare that they have no competing interests.
Funding
This work was supported by:
1. The Robert A. Winn Excellence in Clinical Trials: Clinical Investigator Pathway Program, Virginia Commonwealth University (VCU)
2. The NYU Grossman School of Medicine Clinical and Translational Science Award (CTSA) grant UL1 TR001445 from the National Center for Advancing Translational Sciences, National Institutes of Health.
Authors’ contributions
VR conducted data analysis, assisted with survey development and distribution, and led multiple rounds of manuscript revision. NB contributed to manuscript drafting. CO contributed to data analysis and participated in survey design and refinement. WG supported survey development. AY, JH, EB, and GG provided feedback on survey implementation and substantive manuscript revisions. All authors reviewed and approved the final manuscript.
Acknowledgements
The authors thank the VCU Massey Comprehensive Cancer Center, Bristol Myers Squibb Foundation, and the Winn CIPP Program and coordinators for their support. We acknowledge Dr. Gabrielle Von Gold Simpson for her leadership, and Emily Beato, James Holahan, and Amin Yakubov for their operational contributions. We also thank the NYU CTSI staff, Survey Evaluation Team, and Patient Advisory Board for their collaboration on this project.
References
- Tantoy IY, Bright AN, Paelmo E, Moreland EI, Trost AN, et al. (2021) Patient satisfaction while enrolled in clinical trials: A literature review. Patient Exp J 8: 125-135.
- Pflugeisen BM, Rebar S, Reedy A, Pierce R, Amoroso PJ (2016) Assessment of clinical trial participant patient satisfaction: A call to action. Trials 17: 483. [Crossref]
- Agency for healthcare research and quality. What is patient experience? Updated September 2023. Accessed June 9, 2024.
- Lee GE, Kim S, Chu SH, Seok JH, Kim SY, Kim S, et al. (2024) Improving patient satisfaction based on service quality in clinical trials: A cross-sectional study. PLoS One 19: e0313340. [Crossref]
- Sloan JA, Mahoney MR, Sargent DJ, Hubbard JM, Liu H, et al. (2011) Was it worth it (WIWI)? Patient satisfaction with clinical trial participation: Results from North Central Cancer Treatment Group (NCCTG) phase III trial N0147. J Clin Oncol 29: 6122.
- Kost RG, Lee LM, Yessis J, Coller BS, Henderson DK, et al. (2011) Assessing research participants’ perceptions of their clinical research experiences. Clin Transl Sci 4: 403-413. [Crossref]
- Kost RG, Lee LN, Yessis JL, Wesley R, Alfano S, et al. (2014) Research participant‐centered outcomes at NIH‐supported clinical research centers. Clin Transl Sci 6: 430-440. [Crossref]
- Hareendran A, Gnanasakthy A, Winnette R, Revicki D (2012) Capturing patients' perspectives of treatment in clinical trials/drug development. Contemp Clin Trials. 33: 23-28. [Crossref]
- Sano M, Egelko S, Zhu CW, Li C, Donohue MC, Ferris S, et al. (2018) Participant satisfaction with dementia prevention research: Results from home-based assessment trial. Alzheimers Dement 14: 1397-1405. [Crossref]
- Yessis JL, Kost RG, Lee LM, Coller BS, Henderson DK (2012) Development of a research participants’ perception survey to improve clinical research. Clin Transl Sci 5: 452-460. [Crossref]
- Wiklund I (2004) Assessment of patient‐reported outcomes in clinical trials: The example of health‐related quality of life. Fundam Clin Pharmacol 18: 351-363. [Crossref]
- Brady MK, Cronin Jr JJ (2001) Some new thoughts on conceptualizing perceived service quality: A hierarchical approach. J Marketing 65: 34-49.
- Freundlich RE, Prasad S (2020) Clinical research as a care option: A disruptive yet transformative concept. Contemporary Clinical Trials Communications 20: 100683.
- Presson AP, Zhang C, Abtahi AM, Kean J, Hung M, et al. (2017) Psychometric properties of the Press Ganey® outpatient medical practice survey. Health Qual Life Outcomes 15: 32. [Crossref]
- JDMS I (2024) Patient Satisfaction survey based on standard Press Ganey questionnaire at Emergency dept of Nizams Institute of Medical sciences, a tertiary care institute at Hyderabad. Accessed June 9.
- Johnson EA, Marsh LY (2025) Clinical research as a care option. Am J Nurs 125: 48-51. [Crossref]
- Getz K (2022) Clinical research as a care option: Optimizing approaches. Appl Clin Trials.
- Kozikowski A, Morton-Rias D, Mauldin S, Jeffery C, Kavanaugh K, et al. (2022) Choosing a provider: What factors matter most to consumers and patients?. J Patient Exp 9: 23743735221074175. [Crossref]
- Mulgund P, Sharman R, Anand P, Shekhar S, Karadi P (2020) Data quality issues with physician-rating websites: Systematic review. J Med Internet Res 22: e15916. [Crossref]
- Sun Y, Yu J, Chiu YL, Hsu YT (2022) Can online health information sources really improve patient satisfaction?. Front Public Health 10: 940800. [Crossref]
- Marzban S, Najafi M, Agolli A, Ashrafi E (2022) Impact of patient engagement on healthcare quality: A scoping review. J Patient Exp 9: 23743735221125439. [Crossref]
- Quigley DD, Reynolds K, Dellva S, Price RA (2021) Examining the business case for patient experience: A systematic review. J Healthc Manag 66: 200-224. [Crossref]
- Montminy S, Icenhower M, Bennett P, Brem K (2023) The importance of patient engagement: From noncompliance to activation. A dose of insight. Coverys.
- Friedel AL, Siegel S, Kirstein CF, Gerigk M, Bingel U, et al. (2023) Measuring patient experience and patient satisfaction—how are we doing it and why does it matter? A comparison of European and US American approaches. Healthcare 11: 797. [Crossref]
- Oben P, Corliss M (2021) The difference between HCAHPS and the patient experience and its implications for physicians, experience leaders, and health executives. J Patient Exp 8: 23743735211034026. [Crossref]