Psychiatric inpatient population within the correctional system is different from psychiatric inpatient facilities in the community. This study aimed to better understand the trends and causes of deaths among inpatients in a secure forensic psychiatric centre. Data collected on all deaths during a ten-year period revealed that there were 18 natural deaths (Crude Mortality Rate (CMR) of 9.6 per 1000 per year) and one death due to suicide (CMR = 0.6 per 1000 per year) constituting an overall CMR of 10.2 per 1000 per year. Among the 19 deaths during the study period, 18 (94.7%) were pre-mature (< 75 years of age). The average potential years of life lost was 22.3 years (SD = 10.8, n = 18, 95% CI = 16.9 – 27.6). Respiratory diseases (44.4%, n = 8) were a leading cause of natural deaths followed by gastrointestinal diseases (38.9%, n = 7), cardiovascular diseases (11.1%, n = 2), and renal diseases (5.6%, n = 1). Nurses attended to the deceased patients on the day of their deaths in all cases and the interval in terms of the number of days a patient was seen by clinical staff prior to death was least for the nursing staff compared to other staff categories (Mean = 1.1, SD = 1.4, n = 19). In conclusion, most of the deaths were pre-mature, due to natural causes and death by suicide was extremely uncommon at the study site. Similar studies need to be conducted in other centres.
forensic psychiatry, prisoners, mortality rate, death, life lost, pre-mature death
Forensic psychiatric inpatient population in secure settings is different from general inpatient psychiatric population in the community with respect to the prevalence of mental disorders, history of substance abuse and other criminogenic factors [1,2]. Inmates have multiple health issues due to their social, economic, environmental, and behavioural risk factors. Substance abuse, infectious diseases such as tuberculosis, sexually transmitted diseases, Human Immunodeficiency Virus/Acquired Immune Deficiency Syndrome, and mental/psychological problems are known to be prevalent in this population [3,4]. Increasing global prison population [5] is associated with increased rates of morbidity, in particular, serious mental disorders [6], tuberculosis [3], hepatitis and other infectious diseases among prisoners [7]. Many previous mortality studies in correctional settings often focused on suicide deaths, partly because suicide has been one of the most frequent and often preventable causes of death in incarcerated populations [8]. In contrast, other reports showed that natural diseases were a leading cause of death [9]. Some risk factors for inmate suicides identified in earlier studies were the number of days following incarceration [10,11], overcrowding [12], isolation [13], long sentences after high violent offences [14], psychiatric disorders, alcohol and drug abuse [15,16], and depression [16]. Deaths other than those due to suicide could be as a result of physical disease processes, homicide, accidents and misadventures.
Persons with chronic mental illness die 25 years earlier than the general population and smoking is the major contributor to that premature mortality [17]. During recent years there have been many analyses of the factors associated with higher mortality rate among psychiatric inpatients than in the general population [18,19]. In prison psychiatric hospitals such factors are aggravated by antisocial behaviour of the inmates. Numerous studies have pointed to the high percentage of violent deaths in such institutions, with suicide being the principal cause [20]. Suicide, which is considered an unnatural event [21], has also been found to be 11–14 times more prevalent in prison population than in the general population [22]. In previous studies, increased mortality among psychiatric inpatients has partly been linked to the abuse of cocaine, which is known to increase the risk of coronary artery disease and myocardial infarction [23]. In Ontario correctional systems, cardiovascular diseases were the most frequent non-violent cause of death among inmates between 1990 and 1999 [24]. In another study conducted in New York, heart diseases were the most common cause of death other than suicide, followed by cerebrovascular diseases [8]. In Maryland state prisons, for the period of 1979–1987, circulatory system diseases were the most frequent cause of death. Some researchers argue that one of the reasons for high mortality rate for heart disease is that a disproportionately high number of inmates abuse substances such as alcohol, tobacco and predominantly cocaine [25]. Forensic mental health treatment centres operate with a variety of professional staff (Psychiatrists, psychologists, nurses, social workers and security staff, etc.) delivering a wide array of services [26].
There is a lot published on suicides and other deaths among inmates in prisons yet not many studies were conducted on the trends and causes of death in secure forensic psychiatric settings, and on the level and quality of contacts between the professionals and the deceased patients during the period preceding their deaths.
The aim of this study, therefore, is to provide a better understanding of the trends and causes of deaths and to find out the mortality rates and potential years of life lost among inpatients in a secure forensic psychiatric setting.
All the patients who died during the ten-year period at Regional Psychiatric Centre (RPC) were identified. The deceased patients reported in this study passed away whilst still on admission at the study site. The study centre, though a psychiatric facility, has standard medical services for the patients. The patients in need of additional medical services are referred to the nearby university hospital for care either as emergencies or for specialist medical care. The study site has a medical doctor on-call 24 hours for medical services in addition to on-call psychiatrist. The Regional Psychiatric Centre located in Saskatoon, Saskatchewan, Canada is a multi-level secure psychiatric hospital established with a capacity of 206 beds consisting of 194 for men and 12 for women. The hospital provides acute psychiatric care and rehabilitation programs for two years or more federally sentenced offenders. In addition, the Centre admits Saskatchewan provincial inmates in need of psychiatric services in a maximum-security environment, individuals admitted for pre-trial psychiatric assessment and those found not to be criminally responsible on account of mental disorders. The RPC qualifies as a high-level secure hospital according to Thomson's criteria [27]. The medical records of all those who died during the study period were identified and perused in order to complete the information sheet developed specifically for this study. Data on clinical and demographic variables were collected from the patients’ files. The deceased patients were further classified according to their age at death, ethnic origin, marital status and educational level. Elementary education level included education from grade one to eight and high school education from grade 9 to 12. Aboriginal patients included patients from first nation, inuit and metis origin [28]. The information on clinical diagnoses was obtained from the discharge summaries according to the DSM-IV-TR categorization [29]. The final cause of death was obtained from the Coroner’s verdict. The crude mortality rates (CMR) were calculated as the number of deaths in a given population during a given time period divided by the total population and multiplied by one thousand [30]. Patient population in this study was complicated due to the high rate of admissions and discharges of patients at RPC, therefore, mid-year, mid-month patient population for each year was taken for the calculation of crude mortality rates. Age specific death rates were calculated for each ten-year age group. The number of deaths in each age group was summed and divided by the population in that age group and multiplied by one thousand to express per 1000 population [31].
Potential Years of Life Lost (PYLL) as an indicator of premature mortality was calculated using individual level data. It was calculated as:
PYLL = Predetermined end point age [75 years] – Age of decedent prior to end point age
Age of 75 years [32] was used for the PYLL calculation based on the life expectancy of the Canadian population at birth [33]. The gap between the life expectancy of Aboriginal and non-Aboriginal is approximately seven years [34], but the calculations made in this study are based on the life expectancy of Canadian population at birth (75 years). Statistical analysis of the data were performed using different options available in the SPSS [35].
Patients and demographics
During the study period total number of yearly admissions ranged from 232 to 345 (Mean = 280.1, SD = 35.4) and discharges were from 212 to 328 (Mean = 262.6, SD = 36.6). There were 19 deaths (All males: 18 natural and 1 suicide) at the RPC during ten years of the study period. Compared with other age groups, more deaths occurred in the 51 to 60 age group (42.1%, n = 8). There were 4 deaths (21.1%) each in the age groups of 41 to 50 and 61 to 70 years. Only one (5.3%) patient died each in the age groups of 21 to 30, 31 to 40 and 81 to 90 years. More deaths occurred among Caucasians (68.4%, n = 13) compared to the Aboriginals (31.6%, n = 6). Among the deceased, nine (47.4%) were single, four (21.1%) divorced and three (15.8%) married or in common law relationships. Ten (52.6%) had high school education, six (31.6%) with elementary school, two (10.5%) with university education and one (5.3%) was without any formal education. Age at the time of death ranged from 23 to 85 years (Mean = 54.5, SD = 12.8, 95% CI = 48.3 – 60.6) and it was 54.9 years for Aboriginals (n = 6) and 54.3 for Caucasians (n = 13) patients. Married patients had higher mean age at death (Mean = 59.23, n = 3) followed by single (Mean = 54.68, n = 9), divorced (Mean = 53.81, n = 4) and those in common law relationship (Mean = 49.84, n = 3). Most of the deceased were incarcerated for more than one offence. Robbery was the most frequent offence among the deceased patients (28.5%, n = 8) followed by assault (17.9%, n = 5), sexual offence (17.9%, n = 5), murder (14.3%, n = 4), weapon (14.3%, n = 4) and kidnapping (7.1%, n = 2).
Clinical diagnoses
Multiple diagnoses were recorded for most of the patients according to the DSM-IV of diagnostic categories. All the deceased patients shared amongst them 36 (31%) diagnoses on axis-III, 31 (26.7%) on axis-I, 28 (24.1%) on axis-IV and 21 (18.1%) on axis-II. Polysubstance abuse was the major axis-I diagnosis (42.1%, n = 8), followed by Schizophrenia (26.3%, n = 5), paraphilia (10.5%, n = 2), dementia (10.5%, n = 2) and depression (10.5%, n = 2)
The medical diagnoses (Axis-III) amongst the deceased patients were related to lung diseases (36.8%, n = 7), hepatitis (31.6%, n = 6), renal diseases (31.6%, n = 6) and each of the coronary artery diseases, liver carcinoma and diabetes (10.5%, n = 2).
Causes of natural deaths
There were 18 natural deaths and one death due to suicide during the study period. Pulmonary diseases were the leading cause of natural deaths (44.4%, n = 8) followed by gastrointestinal diseases (38.9%, n = 7), cardiovascular diseases (11.1%, n = 2) and renal diseases (5.6%, n = 1). Deaths due to pulmonary diseases were more in patients in the age groups of 41 to 50 and 61 to 70 years compared to patients in other age groups (Table 1). Gastrointestinal diseases were the major cause of deaths in patients from 51 to 60 years old (Table 1). Patients who died due to cardiovascular diseases were more between the age of 50 and 70 years (Table 1).
Table 1: Natural deaths and causes in different age groups at RPC (n(%)) during ten years.
Age categories |
Natural deaths |
Causes of natural deaths |
Cardiovascular diseases |
Respiratory diseases |
Gastrointestinal diseases |
Renal diseases |
21 – 30 |
0(0) |
0 |
0 |
0 |
0 |
31 – 40 |
1(5.6) |
0 |
0 |
1(14.3) |
0 |
41 – 50 |
4(22.2) |
1(50) |
3(37.5) |
1(14.3) |
0 |
51 – 60 |
8(44.4) |
1(50) |
1(12.5) |
5(71.4) |
1(100) |
61 - 70 |
4(22.2) |
0 |
3(37.5) |
0 |
0 |
71 - 80 |
0 |
0 |
0 |
0 |
0 |
81 - 90 |
1(5.6) |
0 |
1(12.5) |
0 |
0 |
Total |
18 |
2 |
8 |
7 |
1 |
Percent |
100 |
11.1 |
44.4 |
38.9 |
5.6 |
Mortality rates and life lost
Crude mortality rates (CMR) and age specific mortality rates were calculated based on the patient population on 15th of June each year. The CMR ranged from 0 to 21.9 per 1000 per year (Mean = 10.2, 95% CI = 4.6 – 15.7, Table 2). The CMR due to 18 natural deaths was 9.6 and 0.6 for one death due to suicide constituting an overall CMR of 10.2 per 1000 per year. Deaths at RPC were more (42.1%, n = 8) in winter season (December to February) followed by 31.6% (n = 6) in autumn (September to November), 15.8% (n = 3) in summer (June to August) and 10.5% (n = 2) in spring (March to May) [19]. Data on seasonality revealed that 73.7% (n = 14) of the patients died during autumn and winter (Figure 1). Age specific mortality rate (1000 per year) increased from 1.8 to 250 with advancing age of the patients from 23 to 85 years. Among the 19 deaths during the study period, 18 (94.7%) were premature deaths. The average potential years of life lost was 22.3 years (SD = 10.8, n = 18, 95% CI = 16.9 – 27.6) for patients who died during the study period due to natural causes and suicide excluding one patient who died at the age of 85 years. There was a decrease in the potential years of life lost from an average of 29 years during initial five years to 20 years in last five years of the study.
Table 2: Crude mortality rates during different years at RPC.
Years |
Patient population (n) |
Mortality (n) |
Crude mortality rates (Per 1000 per year) |
Natural |
Suicide |
Natural |
Suicide |
Overall |
1997 |
94 |
0 |
0 |
0 |
0 |
0 |
1998 |
99 |
0 |
0 |
0 |
0 |
0 |
1999 |
194 |
1 |
0 |
5.2 |
0 |
5.2 |
2000 |
181 |
1 |
1 |
5.5 |
5.5 |
11.0 |
2001 |
188 |
3 |
0 |
16.0 |
0 |
16.0 |
2002 |
194 |
2 |
0 |
10.3 |
0 |
10.3 |
2003 |
190 |
4 |
0 |
21.1 |
0 |
21.1 |
2004 |
185 |
2 |
0 |
10.8 |
0 |
10.8 |
2005 |
182 |
1 |
0 |
5.5 |
0 |
5.5 |
2006 |
183 |
4 |
0 |
21.9 |
0 |
21.9 |
Total |
1690 |
18 |
1 |
9.6 (Mean) |
0.6 (Mean) |
10.2 (Mean) |
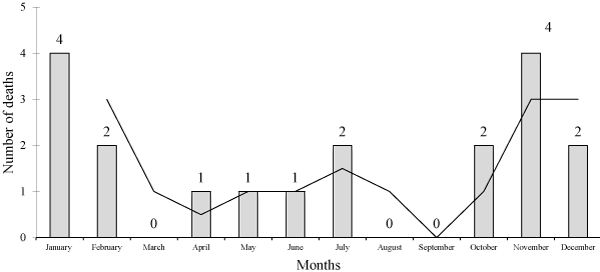
Figure 1. Mortality trends of the patients died during different months of the year at RPC.
History of suicide attempts
There was a history of self injury and suicide attempts in 47.4 % (n = 9) of the patients who died during the study period. The one patient who committed suicide also had history of suicide attempts. Suicide attempts and self injury history was more for the patients that died in the age group of 41 to 50 years (33.3%, n = 3) than those in other age groups namely; 51 to 60 and 61 to 70 years (22.2%, n = 2), 21 to 30 and 31 to 40 years (11.1, n = 1). History of suicide attempts was more in Caucasians (55.6%, n = 5) than in Aboriginals (44.4%, n = 4). Patients who were single had more history of suicidal attempts (66.7%, n = 6) than divorced (22.2%, n = 2) and common law (11.1%, n = 1). Patients with high school education had more suicidal attempts (55.6%, n = 5) than patients who had elementary (33.3%, n = 3) or no formal education (11.1%, n = 1).
Contact with health professionals
Deceased patients were seen regularly by health professionals during the period preceding their deaths. Nurses attended to the deceased patients on the day of their deaths in all cases (Figure 2) and the number of days a patient was seen by a nurse before death was the least when compared with other health professionals (Mean = 1.1, SD = 1.4, n = 19). The intervals between the last contact of the deceased with different professionals and the date of death were 206.6 days (SD = 191.4, n = 15) for psychologists, psychiatrists 21.8 (SD = 18.5, n = 18), family doctors 17.6 (SD = 44.2, n = 19), social workers 17.4 (SD = 25.7, n = 14), parole officers 71.4 (SD = 102.8, n = 18) and program facilitators 165 days (SD = 129.5, n = 12).
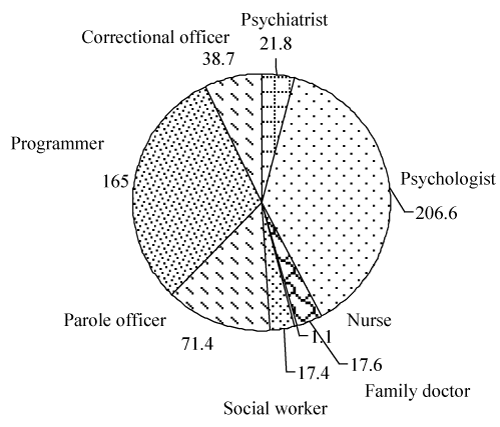
Figure 2. The interval between patients’ death and last visit by different staff members during ten years at RPC (days).
A crude mortality rate of 10.2 per 1000 recorded in this study is higher than the rates reported for inmates in the federal (4.2 per 1000) and provincial institutions (2.1 per 1000) in Ontario, Canada (24). It could be due to the difference in inmate population profile at the RPC and other federal and provincial institutions in Canada. Being a psychiatric treatment centre, the inmate population at RPC mainly comprised people with significant mental disorders and other physical diseases thus leading to a higher mortality rate. Inmates in the other federal and provincial institutions are not necessarily all psychotic or suffering from other physical diseases. Therefore, a different inmate profile at RPC might have contributed to comparatively higher crude mortality rate. Another study [36] also reported that mortality in mentally ill inpatients was three times higher than that in the general population. In this study, 95% (n = 18) of deaths were due to natural causes and only one (5%) was due to suicide. However, the crude mortality rate for deaths due to suicide reported in this study (0.6 per 1000) is lower than the rates reported from the year 1991 to 1997 (2.4 to 0.7 per 1000) for the Canadian federal institutions [37] and during the period from 1998 to 2008 (0.84 per 1000) [38]. Such a lower suicide rate at RPC in spite of an anticipated higher suicide risk could be attributed to the maintenance of hospital standards through regular psychiatric care, suicide prevention strategies and psychological interventions for the suicidal patients. The close monitoring of patients by nursing staff as show in the length of interval between the time of death and last contact suggests a high level of vigilance on the dying mentally ill. In this study there was no death in the female population. This could be due to the significantly lower number of women patients in RPC. However, research studies conducted earlier indicated that women are more likely to engage in self harm behaviour [39] and should therefore not be considered low risk for suicide.
Most of the deaths (95%, n = 18) in this study were premature (< 75 years of age). Another study also reported higher rates of premature deaths occurring in custody [40]. This was not unexpected given that 86% of the patients’ population was between 21 and 50 years of age and there were only a few patients beyond the age of 75 years at the study site. In spite of the limited data a noticeable decrease in the potential years of life lost was observed over the years in this study period, efforts should be made to decrease it further. A study conducted in Australia also highlighted that there is a 10-year difference between the health of inmates and that of the general population, making inmates’ physical health resemble that of someone approximately 10 years older than their chronological age [41]. Incarcerated patients after the age of 50 are at greater risk of having health complications [39]. However, another study conducted earlier in South Africa reported that the highest number of custody related deaths occurred in the age group of 21 to 40 years [42]. Such a difference could be due to the reason that the study conducted in South Africa included more of the police custody and pre-trial cases where suicide and violent acts were more pronounced. The influences of socio-demographic factors like race, marital status and educational level contributed little in explaining the death rates. Seasonality in the deaths observed in this study revealed that 74% of the deaths were in the months of autumn and winter. A five years review of violent incidents from the same institution also found a spike in incidents during the autumn and winter months [43]. Another study conducted in Canada also reported that higher number of deaths have occurred in winter months [44]. Reduced outside activities during winter months might have contributed to higher deaths reported during these months.
Mortality in psychiatric hospitals was reportedly associated with suicide but was also found to be due to natural causes such as respiratory diseases, cardiovascular and cerebrovascular diseases [45]. In this study respiratory diseases were the leading cause of natural deaths followed by gastrointestinal diseases, cardiovascular diseases and renal diseases. Higher rate of deaths due to respiratory diseases noted in this study could likely be due to the presence of smoking habits at higher rates among this population and probably air quality in the confined staying area. A study conducted by Fazel and Benning [46] on the natural deaths in male prisoners also revealed higher standardized mortality ratios from the respiratory diseases. Cardiovascular disease was the most common cause of natural deaths in another study [42]. Possible explanation for the deaths associated with heart and cerebrovascular diseases has been suspected to be the overall aging of jail inmates [47]. With high smoking rates and other risk factors likely to increase cardiovascular and respiratory diseases, policies supporting healthy behaviours and minimization of cardiovascular risk factors can be advanced as measures to reduce the increasing trends towards natural deaths. No conclusions could be drawn between the type of offence and causes of deaths due to insufficient numbers.
There was a history of self-injury and suicide attempts in 47.4 % patients who died during the study period. The one patient who committed suicide had a history of suicide as well. Previous self injury and suicide attempts by the inmates who committed suicide were also reported in other studies [37]. In the context of the number of deaths among the inmates during the study period and particularly those due to suicide, it is noteworthy that managing patients with mental health problems at RPC is most likely to reduce and possibly prevent suicide among inmates. However, the policy on a system of early identification of patients at risk and prompt referral to the treatment centers needs further review.
Over time, it has been established that that effective and individualized care of terminally ill prisoners requires a multidisciplinary team that includes, at minimum, a physician, nurse, and psychologist [45,48]. At the study site, all patients had access to psychological and psychiatric services ditto all other supportive services, the question though is how readily were these services available to them and to what extent did patients utilized them. As expected, the nurses saw the patients most frequently and the interval between their last visit and time of death was the shortest. The frequency of visit and the interval between the last visit and time of death is an indicator of the quality of care provided to patients in hospital settings. Since majority of the deaths in this study were not sudden and were due to physical causes, psychological services provided by professionals were more likely very helpful to the patients. The importance of professional contact for dying patients in the period leading to their death especially in a hospital setting can be a policy issue which, if adhered to, will ultimately improve the quality of clinical services.
This study highlighted the trends and causes of deaths among inpatients in a high-security psychiatric centre of Canada during a period of ten years. Most of the deaths were premature, due to natural causes mainly by respiratory diseases and death by suicide was extremely uncommon at the study site. However, it was a one-site and one-country study, similar studies should be conducted in other similar treatment facilities. Future research should also be conducted to minimize potential years of life lost in the secure psychiatric treatment facilities.
- Teplin LA (1990) The prevalence of severe mental disorder among male urban jail detainees: comparison with the Epidemiologic Catchment Area Program. Am J Public Health 80: 663-669. [Crossref]
- Fazel S, Baillargeon J (2011) The health of prisoners. Lancet 377: 956-965. [Crossref]
- Hammett TM, Harmon MP, Rhodes W (2002) The burden of infectious disease among inmates of and releasees from US correctional facilities, 1997. Am J Public Health 92: 1789-1794. [Crossref]
- Wu Z, Baillargeon J, Grady JJ, Black SA, Dunn K (2001) HIV seroprevalence among newly incarcerated inmates in the Texas correctional system. Ann Epidemiol 11: 342-346. [Crossref]
- Walmsley R (2004) World prison population list (5th edition). London.
- Fazel S, Danesh J (2002) Serious mental disorder in 23 000 prisoners: a systematic review of 62 surveys. Lancet 359: 545-550. [Crossref]
- Rotily M, Weilandt C, Bird S (2001) Surveilance of HIV infection and related risk behaviour in European prisons: A multiculture pilot study. Eur J Public Health 11: 243-50. [Crossref]
- Novick LF, Remmlinger E (1978) A study of 128 deaths in New York City correctional facilities (1971-1976): implications for prisoner health care. Med Care 16: 749-756. [Crossref]
- Salive ME, Smith GS, Brewer TF (1990) Death in prison: changing mortality patterns among male prisoners in Maryland, 1979-87. Am J Public Health 80: 1479-1480. [Crossref]
- Backett SA (1987) Suicide in Scottish prisons.2021 Copyright OAT. All rights reserv1. [Crossref]
- DuRand C, Burtka GJ, Federman EJ, Haycock JA, Smith JW (1995) A quarter century of suicide in a major urban jail: implications for community psychiatry. Am J Psychiatry 152: 1077-1080. [Crossref]
- Marcus P, Alcabes P (1993) Characteristics of suicides by inmates in an urban jail. Hosp Community Psychiatry 44: 256-261. [Crossref]
- Liebling A (1993) Suicide in young prisoners: a summary. Death Studies. 17: 381-409.
- Bogue J, Power K (1995) Suicide in Scottish prisons, 1976-1993. J Forens Psychiatry 6: 527-540.
- Gore SM (1999) Suicide in prisons. Reflection of the communities served, or exacerbated risk? Br J Psychiatry 175: 50-55. [Crossref]
- Hayes LM (1993) Jail suicide--prevention through written protocol (Part 1) Crisis 14: 11-13. [Crossref]
- Schroeder SA, Morris CD (2009) Confronting a neglected epidemic: tobacco cessation for persons with mental illnesses and substance abuse problems. Annu Rev Public Health 31: 297-314 1p following [Crossref]
- Morgan H, Priest P (1991) Suicide and other unexpected deaths among psychiatric inpatients. The Bristol confidential inquiry. Br J Psychiatry 158: 78-82.
- Bjorkenstam E, Ljung R, Burstrom B, Mittendorfer-Rutz E, Hallqvist J, et al. (2012) Quality of medical care and excess mortality in psychiatric patients--a. BMJ Open 24(2): 2011-000778. [Crossref]
- Shah A, Ganesvaran T (1997) Inpatient suicides in an Australian mental hospital. Aust New Zealand J Psychiatry. 31: 291-298. [Crossref]
- Lloyd G (1995) Suicide in hospital: guidelines for prevention. J R Soc Med 88: 344-346. [Crossref]
- McKee GR (1998) Lethal versus nonlethal suicide attempts in jail. Psychol Rep 82: 611-614. [Crossref]
- Lange R, Hillis LD (2001) Cardiovascular complications of cocaine use. N Engl J Med 2(345(5)): 351-358. [Crossref]
- Wobeser WL, Datema J, Bechard B, Ford P (2002) Causes of death among people in custody in Ontario, 1990-1999. CMAJ 167: 1109-1113. [Crossref]
- Hollander JE (1996) Cocaine-associated myocardial infarction. J R Soc Med 89: 443-447. [Crossref]
- Livingston J (2006) A statistical survey of Canadian forensic mental health inpatient programs. Healthc Q. 9(2): 56-61. [Crossref]
- Thomson LDG (2000) Management of schizophrenia in conditions of high security. Advances in psychiatric treatment 6: 252-260.
- Aboriginal Peoples in Canada in 2006: Inuit, Métis and First Nations [Internet]. Statistics Canada.
- American Psychiatric Association A (2000) Diagnostic and Statistical Manual of Mental Disorders Text Revision (DSM-IV-TR). 4 ed. Wilson Boulevard Arlington, VA 22209-3901.
- Pagano MaKG (1993) Principles of Biostatistics: California.
- Erhardt CL, Berlin JE (1973) Mortality and Morbidity in the U.S., Cambridge, Mass: Harvard University Press.
- Statistics Canada (2006) Report on the Demographic Situation in Canada: 2005 and 2006. 2008 91-209-X.
- Statistics Canada. Health indicators. 2002.
- Health Canada (2007) First Nations Comparable Health Indicators. Ottawa.
- SPSS (2008) Statistical Package for Social Sciences for Windows, Rel. 17.0.1. SPSS Inc. Chicago, USA.
- Casadebaig F, Quemada N (1989) Mortality in psychiatric inpatients. Acta Psychiatr Scand 79: 257-264. [Crossref]
- Michel AS (1997) The correctional Services of Canada 1996-97 retrospective report on inmate suicides. Saskatoon: Correctional Services of Canada.
- Correctional investigator Canada (2010) Annual report of the office of the correctional investigator 2009-2010. Ottawa, Canada: The correctional invetigator Canada.
- Kawas C, Gray S, Brookmeyer R, Fozard J, Zonderman A (2000) Age-specific incidence rates of Alzheimer's disease: the Baltimore Longitudinal Study of Aging. Neurology 54: 2072-2077. [Crossref]
- Wendy L, Wobeser, Jason Datema, Benoit Bechard, Peter Ford, et al. (2002) Causes of death among people in custody in Ontario, 1990-1999. CMAJ 167(10):1109-1113. [Crossref]
- Dawes J (2002) Dying with dignity: Prisoners and terminal illness. Illness, Crisis & Loss. 10: 188-203.
- Bhana BD (2003) Custody-Related Deaths in Durban, South Africa 1998-2000. Am J Forensic Med Pathol 24: 202-207. [Crossref]
- Peluola A, Mela M, Adelugba O (2013) A review of violent incidents in a multilevel secure forensic psychiatric. Med Sci Law 53(2): 72-79. [Crossref]
- Trudeau R (1997) Monthly and daily patterns of death. Ottawa: Statistics Canada.
- Casadebaig AP (1999) Mortality in schizophrenic patients Three years follow-up of a cohort,. Encephale 25: 329-37. [Crossref]
- Fazel S, Benning R (2006) Natural deaths in male prisoners: a 20-year mortality study. Eur J Public Health 16(4): 441-444.
- Anno J GC, Lawrence JE, Shansky R (2004) Correctional Health Care: Addressing the Needs of Elderly, Chronically Ill, and Terminally Ill Inmates. Washington, DC: National Institute of Corrections, Contract No.: NIC Accession No. 018735.
- Laishes J (1997) Inmate Suicides in the Correctional Service of Canada. Crisis 18(4): 157-162. [Crossref]