To evaluate the effect of tofogliflozin on diabetic complications in Spontaneously Diabetic Torii (SDT) rats. Methods. The rats were classified as untreated SDT rats, tofogliflozin-treated SDT rats, and normal Sprague-Dawley (SD) rats. We evaluated the urinary albumin (24 hours), crystalline lens opacity (cataract), and diabetic retinopathy (DR) 20 and 40 weeks after diabetes onset. Cataracts were classified as minimal, moderate, or severe. The retinal thickness 500 µm from the optic nerve disc was measured to evaluate the DR. Results. The urinary albumin was significantly (p<0.05) higher in untreated SDT rats than treated SDT rats and normal rats at 20 weeks: untreated eyes, 48.5 (range, 18.2-79.2); treated eyes, 13.4 (range, 7.2-15.8); and normal eyes, 0.4 (range, 0.2-0.5). Severe cataracts developed in all untreated SDT rats; minimal or no crystalline lens opacity developed in all normal rats. Severe cataracts developed significantly less in treated SDT rats than in untreated SDT rats at 20 and 40 weeks. Severe opacities developed in all untreated eyes at 20 and 40 weeks (p<0.01). Minimal opacities developed in all normal eyes (p<0.01). Severe opacities did not develop in any treated eyes at 20 and 40 weeks (p<0.01, p<0.05, respectively); moderate opacities developed in three eyes at 20 weeks (p<0.05) and four eyes at 40 weeks (p<0.01). The retinas in untreated SDT rats were significantly thicker than in normal rats at 20 and 40 weeks. The retinas in treated SDT rats were significantly (p<0.05) thinner than in untreated SDT rats at 20 weeks: untreated eyes, 157.5 microns (range, 128-190); treated eyes, 138.5 microns (range, 107-157); and normal eyes, 119 microns (range, 76.2-131). Significant differences in the retinal thicknesses were not seen at 40 weeks. Conclusion. Tofogliflozin might have an effect on diabetic complications in SDT rats.
Glycemic control is important to suppress diabetic retinopathy (DR) [1,2], but it is difficult to control blood glucose in some patients for various reasons. Recently, sodium glucose cotransporter 2 (SGLT2) inhibitors, which have a new mechanism of action, have begun to be used to treat diabetes. This therapeutic agent acts on the proximal tubules and promotes the release of sugar into the urine without a relationship to insulin. SGLT2 differs from conventional drugs used to treat diabetes, such as insulin and agents that improve insulin secretion, which have hypoglycemia as a side effect. Kaku et al. reported that administration of tofogliflozin, an SGLT2 inhibitor, to patients with type 2 diabetes provided good glycemic control and minimal hypoglycemia [3]. In addition, tofogliflozin caused weight loss, lowering of blood pressure, and improved blood cholesterol levels [3]. It also was reported that SGLT2 inhibitors prevent diabetic complications. Zinman et al. reported that empagliflozin, an SGLT2 inhibitor, reduced the risk of cardiovascular death, death from any cause, and hospitalization from heart failure in patients with type 2 diabetes [4]. Cherney et al. reported that empagliflozin provided renal protection in patients with type 1 diabetes [5]. Thus, SGLT2 inhibitors not only lower blood glucose but also suppress diabetic complications. However, the effect of a SGLT2 inhibitor on diabetic ocular complications has not been reported in great detail. The purpose of the current study was to clarify if the SGLT2 inhibitor tofogliflozin effectively suppressed diabetic ocular complications in Spontaneously Diabetic Torii (SDT) rats.
Animals
The care and handling of the animals were in accordance with the Association for Research in Vision and Ophthalmology Statement for the Use of Animals in Ophthalmic and Vision Research and the Jichi Medical University Animal Care and Use Committee. We obtained 9-week-old SDT rats (n=22) and normal Sprague-Dawley (SD) rats (n=12). The blood glucose levels were measured biweekly with a glucometer, and all SDT rats were confirmed to be diabetic based on two consecutive non-fasting blood glucose concentrations exceeding 350 mg/dL. The SDT rats with diabetes then were divided into treated and untreated groups. The normal SD rats of similar age were defined as the normal group. We started this experiment when the three types of rats were divided into three respective groups. The untreated and normal groups were fed standard rat chow (CRF-1, Oriental Yeast, Inc., Tokyo, Japan), and the treated group was fed the same chow with tofogliflozin (0.005%).
Cataract examination
Crystalline lens opacities (cataracts) were evaluated by slit-lamp biomicroscopy 20 and 40 weeks after starting the experiment. The cataracts were classified as minimal with no or little opacity, moderate with opacity and fundus visibility, or severe with a mature cataract and no fundus visibility.
Urinary albumin evaluation
The rats were placed in a metabolic gauge for 24 hours, and urine was collected 20 and 40 weeks after the start of the experiment to measure the 24-hour urinary albumin.
Blood biochemical examination, measurement of blood glucose and glycated hemoglobin (HbA1c)
The rats were dissected at 20 (n=10 in untreated group; n=10 in treated group; n=10 in normal group) and 40 weeks (n=8 in untreated group; n=12 in treated group; n=14 in normal group) after anesthesia was induced by an intraperitoneal injection of pentobarbital sodium. Blood samples were collected from the abdominal aorta of the rats for examination (blood glucose, HbA1c, BUN, CRE, AST, ALT, T-CHO, TG, HDL-CHO, total ketone body).
Retinal thickness measurement
We reported previously that retinal edema developed in SDT rats, and we judged the therapeutic effects of drugs by measuring the retinal thickness [6,7]. In the current study, the retinal thicknesses were measured at 20 (n=10 in untreated group; n=10 in treated group; n=10 in normal group) and 40 weeks (n=8 in untreated group; n=12 in treated group; n=14 in normal group). After euthanasia, both eyes were enucleated for conventional histopathologic studies, placed in a fixative (Super Fix KY-500, Kurabo, Japan), and embedded in paraffin. The paraffin block was sectioned to 4 µm, stained with hematoxylin and eosin for conventional histopathologic examination using a polarizing microscope, and the images were recorded by virtual slide scanner NanoZoomer (Hamamatsu Photonics, Hamamatsu City, Japan). The retinal thickness in both eyes was measured 500 µm from the optic nerve disc using the NanoZoomer system.
Statistical analysis
All values are expressed as medians (ranges). Steel’s test was used for comparisons among the three groups. The chi-square test and residual analysis were used to compare the distributions of the lens opacities. p<0.05 was considered statistically significant.
The SDT rats were diagnosed with diabetes between 13 and 23 weeks of age. Two untreated SDT rats died between 20 and 40 weeks after starting the experiment.
Blood biochemical examination, measurement of blood glucose and HbA1c
Tables 1 and 2 show the results of blood chemistry examinations and measurements of the blood glucose and HbA1c at 20 and 40 weeks, respectively. Tofogliflozin significantly suppressed (p<0.05) the blood glucose and HbA1c at both time points. The total cholesterol was suppressed significantly (p<0.05) only at 40 weeks.
Table 1. Table 1. Results of blood chemical examination 20 weeks after starting this experiment
Parameter |
Untreated group
(n=5) |
Treated group
(n=5) |
Normal group
(n=5) |
Blood glucose
(mg/dl) (range) |
758 (741-940) |
497* (368-625) |
182* (172-205) |
HbA1c (%) (range) |
12.2 (10.3-13.2) |
8.9* (7.7-9.3) |
5.0* (4.8-5.8) |
BUN (mg/dl) (range) |
33.0 (26.8-39.0) |
32.1 (27.6-34.1) |
19.7* (15.3-23.8) |
CRE (mg/dl) (range) |
0.32 (0.27-0.57) |
0.33 (0.27-0.37) |
0.52 (0.44-0.58) |
AST (IU/L) (range) |
168 (86-842) |
211 (141-348) |
71 (59-160) |
ALT (IU/L) (range) |
156 (105-503) |
146 (109-233) |
33* (29-84) |
T-CHO (mg/dl) (range) |
94 (74-138) |
75 (70-87) |
85 (74-93) |
TG (mg/dl) (range) |
263 (238-974) |
175 (89-416) |
147 (105-297) |
HDL-CHO (mg/dl) (range) |
37 (30-42) |
34 (31-39) |
23* (23-30) |
Total ketone body
(µmol/L) (range) |
1262 (424-1601) |
822 (508-1657) |
224* (199-378) |
All values are expressed as the median (range)
*p<0.05 compared with the untreated group
BUN = blood urea nitrogen; CRE = creatinine; AST =aspartate aminotransferase; ALT = alanine aminotransferase; T-CHO = total cholesterol; TG = triglyceride; HDL-CHO = high-density lipoprotein cholesterol
Table 2. Results of blood chemistry examination, blood glucose, and glycated hemoglobin (HbA1c) 40 weeks after the start of this experiment
Parameter |
Untreated group
(n=4) |
Treated group
(n=6) |
Normal group
(n=7) |
Blood glucose
(mg/dl) (range) |
924 (888-1000) |
617* (403-663) |
160* (141-173) |
HbA1c (%)(range) |
9.4 (7.6-10.5) |
7.3* (6.5-7.9) |
4.5* (4.4-4.7) |
BUN (mg/dl) (range) |
39.7 (37.0-41.8) |
37.5 (27.8-40.3) |
17.6* (9.6-22.6) |
CRE (mg/dl) (range) |
0.26 (0.15-0.33) |
0.33 (0.28-0.38) |
0.50 (0.44-0.62) |
AST (IU/L) |
132 (76-202) |
186.5 (107-434) |
74 (59-171) |
ALT (IU/L) (range) |
112 (95-171) |
143 (78-274) |
35* (30-138) |
T-CHO (mg/dl) |
121 (99-178) |
87.5* (71-108) |
91* (57-99) |
TG (mg/dl) (range) |
933 (684-2250) |
238.5 (92-677) |
123* (85-181) |
HDL-CHO (mg/dl) (range) |
37 (31-42) |
38.5 (36-48) |
28* (16-29) |
Total ketone body
(µmol/L) (range) |
629.5 (359-1687) |
731.5 (428-1079) |
220* (171-487) |
All values are expressed as the median (range)
*p<0.05 compared with the untreated group
BUN = blood urea nitrogen; CRE = creatinine; AST =aspartate aminotransferase; ALT = alanine aminotransferase; T-CHO = total cholesterol; TG = triglyceride; HDL-CHO = high-density lipoprotein cholesterol
Cataract evaluation
Figure 1 shows the results of the evaluation in each group. Figure 2 shows the cataract grades at 20 and 40 weeks. Severe opacities were found in all untreated eyes at 20 and 40 weeks (22/22 eyes, 8/8 eyes, p<0.01, residual analysis). Minimal opacities developed in all normal eyes (24/24 eyes, 14/14 eyes, p<0.01, residual analysis). Severe opacities were not found in any treated eyes at 20 and 40 weeks (0/22 eyes, 0/12 eyes, p<0.01, p<0.05, residual analysis). Moderate opacities were found in three treated eyes at 20 weeks (3/22 eyes, p<0.05, residual analysis) and four treated eyes at 40 weeks (4/12 eyes, p<0.01, residual analysis). Cataract development was suppressed significantly in the treated group.

Figure 1. The crystalline lens opacities in each group. Minimal and moderate opacities are seen in the treated group
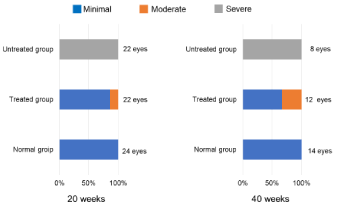
Figure 2. The grades of the crystalline lens opacities in each group at 20 and 40 weeks after starting this experiment (p<0.01 at both time points, chi-square test). Severe opacities are seen in all untreated eyes at 20 and 40 weeks (p<0.01, residual analysis). Minimal opacities are seen in all normal eyes (p<0.01, residual analysis). Severe opacities are not seen in any treated eyes at 20 and 40 weeks (p<0.01, p<0.05, residual analysis); moderate opacities are seen in three treated eyes at 20 weeks (p<0.05, residual analysis) and in four treated eyes at 40 weeks (p<0.01, residual analysis)
Urinary albumin analysis
Figure 3 shows the results of urinary albumin (mg/day). The urinary albumin value in the untreated group was significantly (p<0.05) higher than in the normal group. The urinary albumin value in the treated group was suppressed significantly at 20 weeks but did not reach significance at 40 weeks. The values at 20 weeks were 48.5 (range, 18.2-79.2) (n=5) in the untreated group, 13.4 (range, 7.2-15.8) (n=5) in the treated group, and 0.4 (range, 0.2-0.5) (n=5) in the normal group. The values at 40 weeks were 92.4 (range, 60.9-107.2) (n=4), 47.8 (range, 32.7-97.4) (n=6) in the untreated group, and 0.5 (0.2-2.2) (n=7) in the normal group. Tofogliflozin significantly suppressed the urinary albumin value at 20 weeks but not at 40 weeks.
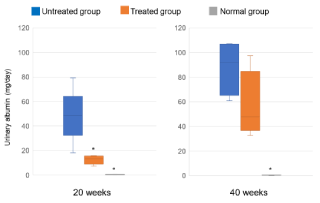
Figure 3. The urinary albumin values at 20 and 40 weeks after starting this experiment. The values at 20 weeks are 48.5 (mg/day) (range, 18.2-79.2) (n=5) in the untreated group, 13.4 (mg/day) (range, 7.2-15.8) (n=5) in the treated group, and 0.4 (mg/day) (range, 0.2-0.5) (n=5) in the normal group. The values at 40 weeks are 92.4 (mg/day) (range, 60.9-107.2) (n=4), 47.8 (mg/day) (range, 32.7-97.4) (n=6) in the untreated group, and 0.5 (mg/day) (range, 0.2-2.2) (n=7) in the normal group. Tofogliflozin significantly suppressed the urinary albumin values at 20 weeks (*p<0.05 compared with the untreated group, Steel’s test) but not at 40 weeks
Retinal thickness measurement
Figures 4 and 5, respectively, show the retinal thickness measurements and the retinas in each group. The values after 20 weeks were 157.5 µm (range, 128-190) (n=10 eyes) in the untreated group, 138.5 µm (range, 107-157) (n=10 eyes) in the treated group, and 119 µm (range, 76.2-131) (n=10 eyes) in the normal group (p<0.05). The values at 40 weeks were 162 µm (range, 139-213) (n=8 eyes) in the untreated group, 159 µm (range, 120-176) (n=12 eyes) in the treated group, and 94.1 µm (range, 87-144) (n=14 eyes) in the normal group. Tofogliflozin decreased the retinal thickness at 20 weeks but not at 40 weeks (Figures 5a to 5c).
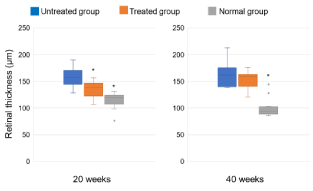
Figure 4. The retinal thicknesses at 20 and 40 weeks after starting this experiment. The values at 20 weeks are 157.5 µm (range, 128-190) (n=10 eyes) in the untreated group, 138.5 µm (range, 107-157) (n=10 eyes) in the treated group, and 119 µm (range, 76.2-131) (n=10 eyes) in the normal group. The values at 40 weeks are 162 µm (range, 139-213) (n=8 eyes) in the untreated group, 159 µm (range, 120-176) (n=12 eyes) in the treated group, and 94.1 µm (range, 87-144) (n=14 eyes) in the normal group. Tofogliflozin decreased the retinal thickness at 20 weeks (*p<0.05 compared with the untreated group, Steel’s test) but not at 40 weeks
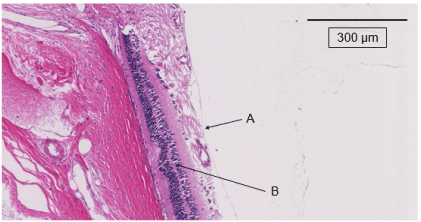
Figure 5a. The retinas in the untreated group at 20 weeks after starting this experiment. A indicates 500 µm from the optic nerve disc. Retinal thickening is observed and curvature of the outer nuclear layer is seen (B)
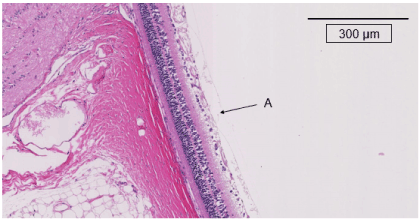
Figure 5b. The retinas in the treated group at 20 weeks after starting this experiment. A indicates 500 µm from the optic nerve disc. No retinal thickening and no curvature of the outer nuclear layer are seen
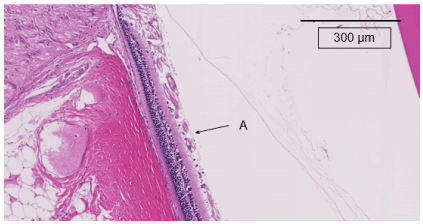
Figure 5c. The retinas in the normal non-diabetic group at 20 weeks after starting this experiment. A indicates 500 µm from the optic nerve disc. No retinal thickening and no curvature of the outer nuclear layer are seen
The current study, which evaluated the effect of tofogliflozin on diabetic complications in SDT rats, showed that the drug significantly suppressed the blood glucose and HbA1c values and cataract development at 20 and 40 weeks. However, the urinary albumin and retinal thickness values were suppressed significantly only at 20 weeks. This finding may have been the result of the small number of laboratory animals, but it suggested that the drug suppressed cataract development more strongly than the other effects.
Takakura et al. who reported the effect of ipragliflozin, a SGLT2 inhibitor, on diabetic complications in SDT fatty rats aged 18 to 24 weeks [8], found that the drug suppressed the urinary albumin, crystalline lens opacity, and the latency extension of the oscillatory potential (OP) wave in the electroretinography (ERG) recordings. Although the investigators used a different model animal, our experimental results showed a longer-term effect than theirs. We judged the effect on retinopathy by measuring the retinal thickness, not the ERG. We reported previously that ranirestat, an aldose reductase inhibitor, suppressed retinal edema and glial fibrillary acidic protein, a marker of neuropathy, in DR in SDT rats [6]. A neuroprotective effect might be demonstrated by suppressing the retinal edema. The same change in the OP might have been obtained in the current study if ERG had been performed.
Although the result of the current experiment is thought to be mainly due to improved blood glycemic control, the SGLT2 inhibitor did not completely normalize the blood glucose. SGLT2 has been reported to be present in renal mesangial cells and retinal pericytes, which use SGLT2 to take up glucose into the cells [9-11]. Mesangial cells and retinal pericytes were not confirmed histologically or cytologically in this experiment. However, SGLT2 inhibitors may directly protect these cells and help to suppress diabetic nephropathy and DR. However, we have never found a report concerning the presence of SGLT2 in the crystalline lens, so we cannot explain precisely why mature diabetic cataracts were mostly suppressed in this study. Mature cataracts appear the earliest and are the most frequent complication in SDT rats [12]. Perhaps mature cataracts are the complication that is affected most by hyperglycemia among the complications in SDT rats. In addition to hyperglycemia, lipid disorders and hypertension were reported to be risk factors for diabetic microvascular complications including DR [13-16]. Tofogliflozin might have had a beneficial effect on both the diabetic microvascular complications and diabetic cataract because of its effect on lowering glycemia, blood pressure, and cholesterol levels and causing weight loss.
The results suggested that tofogliflozin may protect against diabetic complications. Further studies of SGLT2 inhibitors should be undertaken that focus specifically on their effects on diabetic ocular complications.
The data used to support the findings of this study are available from the corresponding author upon request.
Akihiro Kakehashi, Kowa Pharmaceutical Co. Ltd. (Financial Support); Fumihiko Toyoda, None; Hodaka Yamada, None; Mina Kobayashi, None; Rina Takagi, None; Yoshiaki Tanaka, None; Machiko Shimmura, None; Hiroko Takano, None; Hodaka Yamada, None; Masanobu Kawakami, None.
The authors are grateful to research assistants Yoko Noguchi and Tomie Sakamoto for supporting this experiment.
- Jefford M, Moore R (2008) Improvement of informed consent and the quality of consent documents. Lancet Oncol 9: 485-493. [Crossref]
- Seeking patients' consent: The ethical considerations. London: General Medical Council; 1998.
- Butow PN, Brown RF, Tattersall MH (2000) Ethics of clinical trials. N Engl J Med 342: 978. [Crossref]
- Chandrasekharan DP, Taggart DP (2011) Informed consent for interventions in stable coronary artery disease: problems, etiologies, and solutions. Eur J Cardiothorac Surg 39: 912-917. [Crossref]
- Larobina ME, Merry CJ, Negri JC, Pick AW (2007) Is informed consent in cardiac surgery and percutaneous coronary intervention achievable? ANZ J Surg 77: 530-534. [Crossref]
- Price DD, McGrath PA, Rafii A, Buckingham B (1983) The validation of visual analogue scales as ratio scale measures for chronic and experimental pain. Pain 17: 45-56. [Crossref]
- Childers R, Lipsett PA, Pawlik TM (2009) Informed consent and the surgeon. J Am Coll Surg 208: 627-634. [Crossref]
- Carle C, Ashworth A, Roscoe A (2009) A survey of post-sternotomy chronic pain following cardiac surgery. Anaesthesia 64: 1387. [Crossref]
- Uzzaman MM, Tayeh S, Sinha S, Ratnasingham K, Stoker DL (2011) Consenting practice for laparoscopic cholecystectomy - are we doing enough to warn patients about their operation? Int J Surg 9: 643-647. [Crossref]
- Hoosein MM, Towse H, Conn G, Stoker DL (2008) Consenting practice for open inguinal hernia repairs - are we failing to warn patients of serious complications? Ann R Coll Surg Engl 90: 643-646. [Crossref]


