Abstract
Objectives
To compare the effects of two clinically relevant airborne-particle abrasion protocols on the surface free energy (SFE), morphology, and chemical composition of zirconia.
Methods
Zenostar zirconia specimens were allocated into three groups: untreated control, airborne-particle abrasion with 110 µm alumina particles followed by 3-day storage before analysis (laboratory protocol), and airborne-particle abrasion with 50 µm alumina particles evaluated immediately after treatment (chairside protocol). Surface free energy was measured using the sessile-drop method with distilled water at 60 s and 180 s. Data were analyzed using two-way ANOVA and Tukey’s HSD post-hoc test (α = 0.05). Surface morphology and elemental composition were characterized using field-emission scanning electron microscopy (FEG-SEM) and energy-dispersive X-ray spectroscopy (EDX).
Results
Airborne-particle abrasion significantly increased surface free energy compared with untreated zirconia (p < 0.001). The highest SFE values were observed in the chairside protocol (50 µm alumina, immediate analysis), followed by the laboratory protocol (110 µm alumina, 3-day storage), with the control group showing the lowest values. No significant effect of measurement time (60 s vs 180 s) was detected. SEM and quantitative image analysis revealed marked surface roughening in both sandblasted groups, with significantly larger and more extensive impact craters in the 110 µm condition. EDX confirmed the presence of zirconium, oxygen, and yttrium in all groups, while aluminum traces were detected only after airborne-particle abrasion.
Significance
Zirconia surface free energy is significantly influenced by clinically relevant airborne-particle abrasion protocols. Higher surface free energy was observed immediately after chairside-type preparation compared with delayed laboratory-type processing. These findings highlight the importance of clinically relevant surface preparation workflow in determining zirconia surface properties relevant with adhesive bonding.
Keywords
Zirconia; Airborne-particle abrasion; Surface free energy; Surface aging; Adhesion; SEM/EDX
Introduction
Zirconia has become a widely used material in contemporary prosthodontics due to its excellent mechanical properties, biocompatibility, and improved optical performance. Recent developments have further expanded its clinical indications, particularly in esthetic dentistry [1]. The common zirconia material used in dentistry is a yttria-stabilized tetragonal zirconia polycrystal (Y-TZP) which exhibits a dense chemically inert, non-porous surface without any glass matrix and cannot be etched using hydrofluoric acid. Bonding to this surface is a challenging procedure [2].
To overcome these limitations, several surface treatment strategies have been proposed, including airborne-particle abrasion, silica coating, and the use of functional monomers such as 10-methacryloyloxydecyl dihydrogen phosphate (10-MDP). Among these approaches, the combination of air abrasion and MDP-based adhesives has shown promising results [3–7].
Nevertheless, the bonding performance of zirconia remains highly variable and strongly dependent on surface condition, treatment protocol, and material composition. In particular, surface contamination by saliva or biological fluids has been shown to significantly impair adhesion by modifying surface chemistry and blocking reactive bonding sites [8–11].
Wettability of the conditioned adherent surface is important for the bonding of ceramics regardless of the mechanism of bonding, either chemical, micromechanical interlocking, or both [12]. One of the ways to enhance wettability and thus free surface energy of zirconia inner surface is through sandblasting/air particle abrasion. Sandblasting is a surface treatment that projects abrasive particles onto a surface under pressure to increase surface roughness and modify surface topography. It cleans the zirconia surface, improves bonding values with the adhesive due to the increase in its surface energy, wettability, and roughness. Furthermore, sandblasting performed with alumina (Al₂O₃) particles promotes hydroxylation on the surface of the zirconia, which facilitate bonding with adhesives and thereby cause a chemical activation by introducing hydroxyl groups that plays a positive role in increasing interfacial adhesion. This increase in surface energy improves the spreading of resin-based materials and facilitates interaction with functional monomers such as 10-MDP [13,14].
Sandblasting can be carried out either in the prosthetics laboratory after the prosthesis has been made or directly in the dental office by the practitioner using a mini sandblaster. These two clinical workflows differ not only in the timing of bonding but also in the sandblasting devices and abrasive particle sizes commonly used. Laboratory procedures are typically performed using larger alumina particles and are followed by a period of storage or transportation before cementation, whereas chairside procedures generally involve finer particles delivered by intraoral micro-sandblasting devices immediately before bonding. The influence of these clinically relevant preparation protocols on zirconia surface characteristics remains insufficiently documented. Contemporary studies have significantly contributed to the understanding of zirconia surface modification and bonding performance. Previous studies demonstrated that airborne-particle abrasion parameters, particularly particle size and pressure, influence surface modification and bonding behaviour through mechanical and morphological effects [15]. Similarly, other investigations provided valuable data on the effect of different surface treatments on zirconia bonding performance, mainly through mechanical testing and surface morphological characterization [16].
Research highlights that the behaviour of the zirconia surface cannot be explained solely by roughness, but rather by a complex interplay between surface morphology, phase transformation, and surface chemistry [17,18].
In this context, a more comprehensive understanding of zirconia surface behavior requires an integrated evaluation combining surface thermodynamics, morphology, and chemical composition within a time-dependent experimental framework.
The aim of this study was to evaluate zirconia surface characteristics following two clinically relevant airborne-particle abrasion protocols representative of laboratory and chairside procedures. Surface free energy (SFE) measurements were combined with scanning electron microscopy (SEM) and energy-dispersive X-ray spectroscopy (EDX) analyses to provide a comprehensive physicochemical and topographical assessment of the treated surfaces. Although zirconia surface morphology, chemical composition, and wettability after airborne-particle abrasion have been extensively investigated, these parameters are generally studied independently. A comprehensive approach integrating surface free energy measurements with SEM/EDX characterization of clinically relevant zirconia surface preparation protocols remains underexplored.
The null hypothesis was that the different airborne-particle abrasion protocols would have no effect on surface free energy (SFE) or surface morphology, and that airborne-particle abrasion would not induce detectable morphological or compositional changes as assessed by SEM and EDX.
Materials a Methods
The zirconia investigated was Zenostar (Ivoclar-Vivadent), a yttria-stabilized zirconia (Y-TZP) containing zirconium oxide, aluminum oxide, and yttrium oxide (6.5–8%). Discs (13 mm in diameter and 2 mm in thickness) were fabricated by dry machining using a 5-axis milling unit (Select Hybrid, Ivoclar-Vivadent / Wieland). No additional surface treatment was applied after machining.
2.1. Surface free energy measurement
Sample preparation and experimental groups
A total of 30 Zenostar discs were allocated into three groups (n = 10 per group):
Group I (control): no surface treatment
Group II (laboratory protocol): airborne-particle abrasion with 110 µm Al₂O₃ particles (1.5 bar, 15 mm distance, 10 s), followed by rinsing with distilled water (60 s), drying, and storage for 3 days prior to analysis
Group III (chairside protocol): airborne-particle abrasion with 50 µm Al₂O₃ particles (RONDOflex Plus 360; 1.5 bar, 15 mm distance, 10 s), followed by rinsing with distilled water (60 s), drying, and immediate analysis
The two sandblasting protocols were selected to reproduce clinically relevant workflows. Group II simulated a laboratory procedure performed prior to cementation with delayed bonding, whereas Group III simulated a chairside procedure performed immediately before adhesive cementation using a micro-sandblasting device with finer particles. These protocols were designed as integrated clinical treatment strategies, in which particle size and post-treatment timing are inherent components of each workflow and were not treated as independent clinical variables, but rather as constituents of two clinically distinct protocols.
Surface Energy Measurement
Surface free energy was determined using contact angle measurements via the sessile drop technique, in which a droplet of liquid is deposited onto the surface and allowed to reach equilibrium. This method is widely used for ceramic materials due to its simplicity, reproducibility, and suitability for rough or treated surfaces [19].
Contact angles were measured using a Digidrop system (GBX, France) with image acquisition software. Droplets of 10 µL were dispensed using a calibrated microsyringe. Drop profiles were analyzed using GBX software, which determines contact angles through image-based contour fitting. Surface free energy (WA) and the spreading coefficient (S) were calculated from these measurements.
For each specimen, contact angles were measured ten times per liquid at 60 s and 180 s after droplet deposition.
Distilled water was used as the probe liquid due to its suitability for comparative wettability analysis of ceramic surfaces [20]. Water is a polar protic solvent capable of hydrogen bonding with surface functional groups.
Statistical analysis
Statistical analysis was performed using two-way analysis of variance (ANOVA) to evaluate the effects of surface treatment protocol (Groups I–III) and measurement time (60 s and 180 s) on surface free energy (WA, mJ/m²). This test is selected because it allows simultaneous assessment of two independent factors and their potential interaction, while comparing mean values across multiple groups.
Assumptions of normal distribution and homogeneity of variance were considered acceptable. The significance level was set at α = 0.05.
Tukey’s HSD (Honestly Significant Difference) post-hoc test was used for multiple pairwise comparisons to control the family-wise error rate and identify significant differences between groups.
Scanning electron microscopy and energy-dispersive X-ray spectroscopy (SEM/EDX) analysis
Surface morphology was evaluated by scanning electron microscopy coupled with energy-dispersive X-ray spectroscopy (SEM/EDX). Three discs per group (Zenostar) were prepared and analyzed (n = 3 per group), with the disc considered as the statistical unit. For each specimen, five distinct areas were selected and analyzed. Measurements obtained from these areas were averaged to yield a single value per disc. Images were acquired at magnifications of ×500, ×2,500, ×5,000, and ×10,000 using a FEI Quanta 250 FEG Scanning Electron Microscope (Thermo Fisher Scientific) operated in low-vacuum mode (100 Pa) at an accelerating voltage of 20 kV, using a backscattered electron detector. Prior to imaging, specimens were sputter-coated with a 6 nm platinum layer under vacuum using a LEICA EM MED020 sputter coater and a JEE-420T vacuum evaporator (JEOL Ltd., Tokyo, Japan).
Elemental composition was analyzed using an EDAX Octane Elect Plus detector (EDAX Inc., Mahwah, NJ, USA) with EDAX Genesis software. Results were expressed in weight percent (wt%) and atomic percent (at%). For EDX analysis, the disc was considered the experimental unit, whereas for morphometric SEM image analysis, each SEM field was considered the unit of analysis.
Quantitative SEM image analysis
SEM images were quantitatively analyzed using Amira software (Thermo Fisher Scientific). Initially, several SEM magnifications were examined to identify the most appropriate field of view for crater visualization and quantitative assessment. A magnification of ×2500 was selected as it provided optimal visualization of abrasion-induced impact craters while maintaining a representative analyzed surface area.
Only the sandblasted groups (Group II and Group III) were included in the morphometric analysis, as the untreated control specimens exhibited a smooth and homogeneous surface without identifiable impact craters. Ten SEM images per group were selected and calibrated using the SEM scale bar prior to analysis.
Crater segmentation was performed manually by delineating the contour of each visible impact crater. For each segmented crater, the surface area was measured in µm². The relative crater area was calculated and expressed as the percentage of the total SEM image area occupied by the individual crater.
For each SEM image, the number of identified craters, the mean crater area, and the cumulative crater area were calculated. The cumulative crater area was obtained by summing the surface areas of all segmented craters within each image and was expressed as the percentage of the total image surface, providing an estimation of the fraction of zirconia surface affected by airborne-particle abrasion.
The SEM image was considered the unit of analysis. Morphometric parameters were averaged per image and subsequently compared between groups to characterize differences in surface modification induced by the two airborne-particle abrasion protocols.
Results
Surface free energy analysis
Surface free energy (WA) values for the three groups at 60 s and 180 s are presented in (Table1). Group III (50 µm alumina, immediate analysis) showed the highest surface free energy values at both time points, followed by Group II (110 µm alumina, 3-day storage), whereas the untreated control group (Group I) showed the lowest values. No relevant differences were observed between measurements at 60 s and 180 s within each group, indicating stability of the sessile-drop measurements over time. Higher surface free energy values were observed in both sandblasted groups compared with the control group.
Table 1. Surface free energy (WA, mJ/m²) of zirconia specimens at 60 s and 180 s
Mean surface free energy values (± standard deviation) measured at 60 s and 180 s for the three experimental zirconia groups. Group I represents untreated zirconia (control). Group II corresponds to zirconia treated with 110 µm alumina airborne-particle abrasion (1.5 bar, 15 mm distance, 10 s exposure) followed by a 3-day storage period before analysis. Group III corresponds to zirconia treated with 50 µm alumina airborne-particle abrasion (1.5 bar, 15 mm distance, 10 s exposure) and analyzed immediately after treatment.
Group |
Surface condition |
60 s (mean ± SD) |
180 s (mean ± SD) |
I |
Untreated control |
101.8 ± 7.40 |
104.5 ± 7.81 |
II |
110 µm Al₂O₃ sandblasting (1.5 bar, 15 mm, 10 s)
+ 3-day storage before analysis |
129.3 ± 6.38 |
130.1 ± 6.03 |
III |
50 µm Al₂O₃ sandblasting (1.5 bar, 15 mm, 10 s)
+ 3-day storage before analysis |
136.7 ± 4.80 |
136.8 ± 4.50 |
Table 2. Two-way ANOVA evaluating the effects of surface condition and measurement time on surface free energy (WA)
Two-way analysis of variance assessing the effects of surface condition (Groups I, II, III), measurement time (60 s and 180 s), and their interaction on surface free energy values. A significance level of α = 0.05 was applied. The model includes the main effects and their interaction (surface condition × time). A significant effect of surface condition was observed (p < 0.001), whereas measurement time and the interaction term were not statistically significant (p > 0.05).
Source of variation |
df |
Sum of squares |
Mean square |
F-value |
p-value |
Surface condition |
2 |
6763.4 |
3381.7 |
94.3 |
< 0.001 |
Measurement time |
1 |
39.8 |
39.8 |
1.11 |
0.3 |
Surface condition × Time |
2 |
18.2 |
9.1 |
0.25 |
0.78 |
Error |
54 |
1032.5 |
19.1 |
— |
— |
Statistical analysis
Statistical analyses were performed using IBM SPSS Statistics (Version 29, IBM Corp., Armonk, NY, USA). Two-way ANOVA and Tukey’s HSD post-hoc test were conducted with a significance level set at α = 0.05.
The two-way ANOVA revealed a significant effect of surface condition on surface free energy (p < 0.001). The effect of measurement time was not significant (p = 0.30), and no interaction between factors was observed. Tukey’s HSD post-hoc comparisons of surface free energy are presented in (Table 3). All pairwise comparisons between groups were statistically significant. Group I vs Group II showed a mean difference of 26.55 mJ/m² (p < 0.001), Group I vs Group III showed a mean difference of 33.60 mJ/m² (p < 0.001), and Group II vs Group III showed a mean difference of 7.05 mJ/m² (p < 0.01). Group III exhibited the highest surface free energy values, followed by Group II, while Group I showed the lowest values.
Scanning electron microscopy and energy-dispersive X-ray spectroscopy (SEM/EDX)
Table 3. Tukey’s HSD post-hoc comparisons of surface free energy (WA, mJ/m²) between experimental zirconia groups
Pairwise comparisons of surface free energy between experimental groups using Tukey’s HSD post-hoc test. Group I represents untreated zirconia (control). Group II corresponds to zirconia treated with 110 µm alumina airborne-particle abrasion (1.5 bar, 15 mm distance, 10 s) followed by 3-day storage before analysis. Group III corresponds to zirconia treated with 50 µm alumina airborne-particle abrasion (1.5 bar, 15 mm distance, 10 s) and analyzed immediately after treatment.
Comparison |
Mean difference (mj/m2) |
p-value |
Significance |
Group I (Untreated control) vs Group II (110 µm Al₂O₃ sandblasting + 3-day storage) |
26.55 |
< 0.001 |
*** |
Group I (Untreated control) vs Group III (50 µm Al₂O₃ sandblasting + immediate analysis) |
33.6 |
< 0.001 |
*** |
Group II (110 µm Al₂O₃ sandblasting + 3-day storage) vs Group III (50 µm Al₂O₃ sandblasting + immediate analysis) |
7.05 |
< 0.01 |
** |
SEM observations
SEM analysis revealed clear differences in surface morphology between groups (Figure 1). The control group (Zenostar I) exhibited a relative smooth and homogeneous surface. In contrast, both airborne-particle abrasion protocols produced markedly topographical alterations. These morphological differences were consistently observed across all specimens, indicating a substantial modification of the zirconia surface following treatment.
The surface alterations appeared more pronounced in Zenostar II, treated with 110 µm alumina particles, with larger impact features and more extensive surface disruption compared with Zenostar III treated with 50 µm alumina particles. The latter displayed a more homogeneous micro-roughened surface pattern with smaller and more uniformly distributed surface defects. Higher-magnification SEM examination (Figure 2) revealed localized granular-like surface features in several regions of Zenostar II specimens suggesting superficial material removal and partial exposure of the underlying zirconia microstructural organization, whereas comparable structures were not observed in Zenostar III, which showed a more uniform abrasion pattern.
Quantitative SEM image analysis
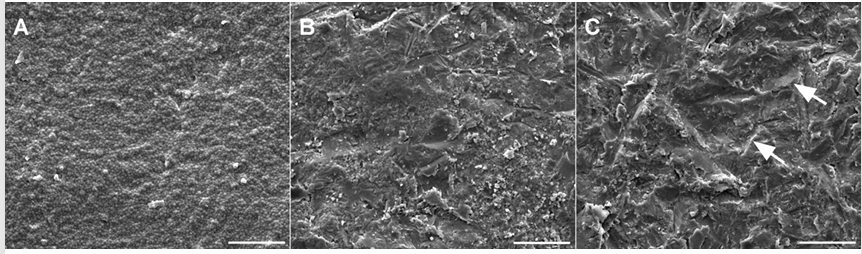
Figure 1. Representative SEM micrographs of zirconia surfaces before and after airborne-particle abrasion
(A) Untreated zirconia (control group) showing a relatively smooth and homogeneous topography.
(B) Zirconia surface after airborne-particle abrasion with 110 µm Al₂O₃ particles (Zenostar II), exhibiting extensive surface disruption, impact craters and localized areas displaying a granular microstructural appearance.
(C) Zirconia surface after airborne-particle abrasion with 50 µm Al₂O₃ particles (Zenostar III), showing a more homogeneous surface modification with smaller and more uniformly distributed surface defects. Arrows indicate representative small-sized impact craters observed in chairside protocol specimens.
Original magnification ×2500
Scale bars = 10 µm.
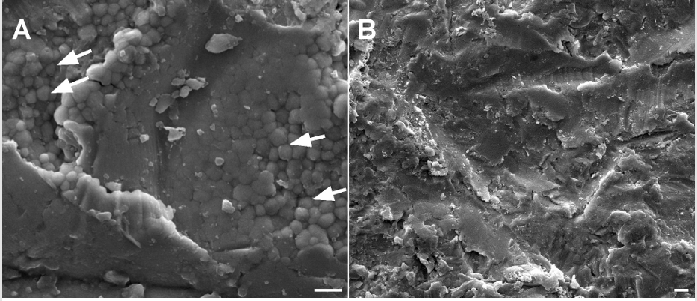
Figure 2. High-magnification SEM images illustrating distinct surface alteration patterns induced by airborne-particle abrasion
(A) Zirconia surface treated with 110 µm Al₂O₃ particles (Zenostar II), showing localized granular-like surface features (arrows) associated with extensive surface disruption and suggestive of partial exposure of the underlying zirconia microstructural organization.
(B) Zirconia surface treated with 50 µm Al₂O₃ particles (Zenostar III), exhibiting a more homogeneous abrasion pattern without comparable granular-like features.
Original magnifications: ×10,000 (A) and ×5,000 (B).
Scale bars = 1 µm.
Because crack dimensions and depth cannot be reliably quantified from two-dimensional SEM surface images, quantitative morphometric analysis was focused on measurable impact craters. Crater number and crater area were therefore selected as reproducible parameters to characterize the extent of surface modification induced by airborne-particle abrasion.
Quantitative morphometric analysis performed using Amira software confirmed the differences observed by SEM. The greater crater dimensions observed in Group II indicate that the use of larger alumina particles generated a more energetic impact pattern, resulting in larger localized surface defects and a greater proportion of affected zirconia surface.
Zenostar II showed higher mean crater area values and increased impacted surface coverage, whereas Zenostar III exhibited smaller crater dimensions, reflecting a more controlled surface modification pattern.
These results demonstrate that abrasive particle size strongly influences the morphology and extent of zirconia surface alterations induced by airborne-particle abrasion. Statistical analysis using the Mann–Whitney U test confirmed significant differences between Zenostar II and Zenostar III for all evaluated morphometric parameters (p < 0.05).
EDX analysis
The elemental composition of Zenostar specimens is presented in (Table 5). Oxygen (O), yttrium (Y), and zirconium (Zr) were the main elements detected in all groups.
Table 4. Quantitative SEM image analysis of impact craters generated by airborne-particle abrasion
Quantitative morphometric analysis of impact craters observed on SEM fields obtained at ×2500 magnification and analyzed using Amira software. Craters were manually segmented, and crater number, crater area, total crater area, and impacted surface area were calculated for each SEM field. The SEM field was considered the unit of analysis. Data are expressed as mean ± standard deviation. Zenostar II corresponds to zirconia treated with 110 µm alumina particles, whereas Zenostar III corresponds to zirconia treated with 50 µm alumina particles. The impacted surface area (%) was calculated as the percentage of the total SEM image area occupied by all segmented craters. Statistical comparisons between groups were performed using the Mann–Whitney U test.
Morphometric parameter |
Zenostar II (110 µm Al₂O₃ airborne-particle abrasion) |
Zenostar III (50 µm Al₂O₃ airborne-particle abrasion) |
p-value |
Number of craters per SEM field |
6.7 ± 1.6 |
4.0 ± 1.1 |
0.002 |
Mean crater area (µm²) |
147.1 ± 52.3 |
55.8 ± 22.0 |
<0.001 |
Total crater area per image (µm²) |
928.8 ± 223.1 |
218.1 ± 86.8 |
<0.001 |
Impacted surface area (%) |
0.423 ± 0.099 |
0.100 ± 0.036 |
<0.001 |
| Table 5. Elemental composition (wt%) of Zenostar Groups.
Mean elemental composition (wt%) determined by SEM/EDX analysis. Values represent the mean composition per disc (n = 3 per group). The disc was considered the experimental unit, and measurements obtained from five analyzed areas per specimen were averaged. Aluminum (Al) was considered detected when present above the detection threshold and was not detected (ND) in the control group.
Element |
Zenostar I (control) |
Zenostar II |
Zenostar III |
O |
30.78 |
32.51 |
32.03 |
Y |
5.47 |
4.67 |
4.55 |
Zr |
63.75 |
61.75 |
62.47 |
Al |
ND |
1.06 |
0.96 |
Zenostar I (control) showed a composition of 30.78 wt% O, 5.47 wt% Y, and 63.75 wt% Zr, with no detectable aluminum (Al).
In contrast, Zenostar II and III exhibited the presence of aluminum (1.06 wt% and 0.96 wt%, respectively), which was not detected in the control group. Minor variations in O, Y, and Zr contents were also observed between groups.
Discussion
The present study demonstrated that clinically relevant airborne-particle abrasion protocols significantly influence zirconia surface properties, as shown by surface free energy (SFE), SEM, and EDX analyses. Rather than evaluating isolated variables, the study compared two clinical workflows representative of laboratory and chairside procedures, differing in both abrasive particle size and post-treatment conditions.
Importantly, the experimental groups were designed to simulate two distinct clinical workflows: a laboratory-based protocol using larger alumina particles followed by a delayed evaluation period, and a chairside protocol using finer particles with immediate analysis. This distinction allows for a direct comparison of surface behavior under clinically relevant timing and procedural constraints.
Specifically, airborne-particle abrasion significantly increased surface free energy compared with untreated zirconia. These findings are consistent with previous studies reporting improved wettability and surface reactivity following airborne-particle abrasion due to increased surface roughness and surface cleaning effects [15, 21]. These results suggest that surface free energy is more strongly influenced by the post-abrasion condition (immediate vs 3-day storage) than by short-term measurement time or its interaction with particle size.
The highest SFE values were observed in the chairside protocol (50 µm particles, immediate analysis), whereas lower values were recorded in the laboratory protocol (110 µm particles, 3-day storage). These results confirm clear differences between clinically relevant workflows, as supported by post-hoc analysis showing significant differences between all groups. Similar trends have been reported in studies highlighting the sensitivity of zirconia bonding performance to surface condition and timing of adhesive procedures [22].
Interestingly, the laboratory protocol, despite involving larger abrasive particles, resulted in lower SFE values than the chairside protocol. This suggests that surface roughness alone does not determine surface energy and that time-dependent surface alterations may play a significant role. Similar dissociations between roughness and adhesion-related properties have been previously reported [15,23,12].
Taken together, the results consistently identify post-abrasion aging as the dominant factor influencing zirconia surface free energy.
Surface contamination by hydrocarbons and environmental exposure has been identified as a key factor contributing to the reduction of zirconia surface energy over time. Previous studies have demonstrated that carbon adsorption decreases surface reactivity and may impair bonding performance, while surface cleaning or reactivation procedures can partially restore it [24–27]. XPS analyses reported in the literature further support increased carbon contamination after exposure, leading to a reduction in polar components of surface energy [26].
While contact angle measurements at 60 s and 180 s were included to assess wettability stability, no significant time effect was observed. This suggests that surface free energy measurements reach equilibrium rapidly after droplet deposition, in agreement with previous studies using dynamic contact angle methods [26].
From a clinical perspective, the significant differences observed between protocols have direct implications. Immediate bonding after airborne-particle abrasion appears favorable for maintaining higher surface free energy. When delays are unavoidable, additional surface cleaning or reactivation procedures may be required to restore zirconia surface reactivity, as supported by previous studies on decontamination strategies [25,14,27]. This finding is consistent with studies showing improved wettability and adhesion when zirconia is bonded immediately after sandblasting [16].
Surface free energy measurements provide valuable insight into the wettability and surface reactivity of zirconia; however, they do not directly reflect the underlying morphological and chemical modifications induced by airborne-particle abrasion. Accordingly, SEM and EDX analyses were performed to provide a complementary characterization of the treated zirconia surfaces and to better understand the mechanisms underlying the observed differences in SFE.
SEM analysis revealed substantial differences in surface morphology between protocols. The untreated zirconia exhibited a smooth and homogeneous surface, whereas both sandblasted groups showed pronounced surface modifications, including impact craters, micro-irregularities, and localized granular-like surface features. These morphological alterations were more evident in the 110 µm protocol, suggesting that larger particles generate higher impact energy and more extensive surface damage compared with 50 µm particles [15,22].
Quantitative SEM image analysis further supported these observations. The 110 µm abrasion protocol produced significantly larger craters, greater cumulative crater area, and a substantially higher proportion of impacted surface than the 50 µm protocol. These findings indicate that increasing abrasive particle size does not simply increase surface roughness but profoundly modifies the extent and nature of the surface damage generated by particle impact. In addition, localized areas displaying a granular microstructural appearance were observed in some specimens treated with 110 µm alumina particles. These features may reflect partial exposure of the underlying zirconia microstructural organization following superficial material removal. Similar observations of subsurface damage and microstructural alteration after airborne-particle abrasion have been reported in Y-TZP ceramics [23]. The absence of such features in the 50 µm group suggests that the chairside protocol induced a more superficial and homogeneous surface modification.
This morphology may be advantageous for adhesive procedures, as it could promote micromechanical interlocking while limiting excessive structural damage.
Airborne-particle abrasion has also been reported to generate crack-related defects and subsurface discontinuities that may act as stress concentration sites. In the present study, the larger alumina particle protocol also produced visible crack-like surface defects and areas displaying a granular microstructural appearance on SEM images. Although these features were not included in the quantitative analysis due to the limitations of two-dimensional imaging for assessing crack depth and morphology, their presence suggests a more extensive surface alteration compared with the finer particle protocol. This highlights the dual effect of airborne-particle abrasion, which enhances surface roughness but may also introduce structural defects depending on treatment severity [23].
EDX analysis confirmed zirconium, oxygen, and yttrium as the main elements in all groups, while aluminum was detected only in sandblasted specimens, indicating partial incorporation of alumina particles during airborne-particle abrasion. This finding is consistent with previous reports describing alumina residues after sandblasting [23,26], which may contribute to modifications in surface chemistry and energy.
Overall, SEM/EDX findings confirm that airborne-particle abrasion induces both morphological and chemical modifications. However, these changes alone do not fully account for the differences observed in surface free energy, suggesting that additional time-dependent chemical changes at the outermost surface may contribute to this effect.
Within the limitations of this study, airborne-particle abrasion modified zirconia surface morphology, chemistry, and surface free energy. The observed differences between clinically relevant protocols suggest that surface reactivity is influenced not only by the abrasion procedure itself but also by post-treatment conditions, highlighting the importance of controlling timing in adhesive workflows.
From a mechanistic standpoint, zirconia surface behavior appears to involve an interplay between surface morphology and time-dependent chemical processes rather than surface roughness alone.
In summary, the null hypothesis was rejected, as both clinically relevant airborne-particle abrasion protocols resulted in significant differences in zirconia surface free energy and surface characteristics.
Conclusion
Airborne-particle abrasion significantly increased the surface free energy of zirconia compared with untreated specimens. The chairside protocol using 50 µm alumina particles and immediate analysis produced the highest surface free energy values, whereas the laboratory protocol using 110 µm particles resulted in more pronounced surface alterations and larger impact craters. These findings indicate that zirconia surface free energy is influenced not only by abrasion-induced topographical modifications but also by the clinical workflow applied after surface treatment. The timing between airborne-particle abrasions and bonding procedures may therefore represent an important factor in optimizing zirconia surface properties relevant to adhesive bonding.
Conflict of Interest
The authors declare that they have no conflicts of interest related to this study.
Acknowledgements
The authors gratefully acknowledge the support and hospitality provided by the laboratory that facilitated access to the facilities required for surface free energy measurements. The authors also sincerely thank the staff of the microscopy platform for their assistance with scanning electron microscopy (SEM) and energy-dispersive X-ray spectroscopy (EDX) analyses. Their technical expertise and support were essential to the completion of this study.
References
- Y, Lawn BR (2018) Novel zirconia materials in dentistry. J Dent Res 97: 140–147. [Crossref]
- Türp L, Lehmann F, Wille S, Kern M (2025) Influence of airborne-particle abrasion parameters on zirconia bonding. J Prosthet Dent 134: 230-236. [Crossref]
- Ozkan Ata S, Okur R (2025) Enhancing resin-zirconia bonding. Am J Dent 38: 208-216. [Crossref]
- Samran A, Al-Ammari A, El Bahra S, Halboub E, Wille S, et al. (2019) Bond strength durability of self-adhesive resin cements to zirconia. J Prosthet Dent 121: 477-484. [Crossref]
- Inokoshi M, De Munck J, Minakuchi S, Van Meerbeek B (2020) Meta-analysis of bonding to zirconia. J Dent Res 99: 16-25. [Crossref]
- Yoshida K, Tsuo Y, Atsuta M (2021) Bonding of resin cement to zirconia using MDP. Dent Mater J 40: 110.
- Koizumi H, Nakayama D, Komine F, Blatz MB (2022) Bonding to zirconia ceramics. Dent Mater J 41: 123-134.
- Thammajaruk P, Guazzato M, Naorungroj S (2023) Cleaning methods of contaminated zirconia. Dent Mater 39: 235-245. [Crossref]
- Hajjaj MS, Alzahrani SJ (2022) Cleaning methods and bond strength. Materials (Basel) 15: 5068. [Crossref]
- Tian F, Londono J, Villalobos V, et al. (2022) Cleaning measures on contaminated zirconia. J Dent 120: 104084. [Crossref]
- Phark JH, Duarte S Jr, Kahn H, Blatz MB, Sadan A (2009) Influence of contamination and cleaning. Dent Mater 25: 1541-1550. [Crossref]
- Comino-Garayoa R, Peláez J, Tobar C, Rodríguez V, Suárez MJ (2021) Adhesion to zirconia: A systematic review. Materials (Basel) 14: 2751. [Crossref]
- Su N, Yue L, Liao Y, et al. (2015) Effect of sandblasting conditions on zirconia. J Adv Prosthodont 7: 214-223. [Crossref]
- Sulaiman TA, Suliman AA, Abdulmajeed AA, Zhang Y (2024) Zirconia restorations: A review. J Esthet Restor Dent 36: 78-84. [Crossref]
- Kwon SM, Min BK, Kim YK, Kwon TY (2020) Sandblasting particle size and bonding durability. Materials (Basel) 13: 5629. [Crossref]
- Kim SH, Lim YJ, Kim DJ, et al. (2024) Surface treatments and bond strength. Bioengineering (Basel) 11: 1003. [Crossref]
- Cesar PF, Miranda RBP, Santos KF, Scherrer SS, Zhang Y (2024) Advances in dental zirconia. Dent Mater 40: 824-836. [Crossref]
- Huang B, Chen M, Wang J, Zhang X (2024) Zirconia-based dental materials. J Dent 147: 105111. [Crossref]
- Yuan Y, Lee TR (2025) Contact angle and wetting properties. In: Surface Science Techniques. Springer.
- Mittal KL (2024) Contact Angle, Wettability and Adhesion. Boca Raton: CRC Press.
- Aita H, Hattori M, Yoshinari M, Kawada E, Oda Y (2022) Surface energy and wettability changes of zirconia after airborne-particle abrasion. J Prosthodont Res 66: 345-352.
- Al-Akhali M, Al-Dobaei E, Wille S, Mourshed B, Kern M (2021) Influence of elapsed time between airborne-particle abrasion and bonding to zirconia on bond strength. Dent Mater 37: 516-522.
- Kim HK, Ahn B (2021) Effect of Al₂O₃ sandblasting particle size on surface topography and residual stresses of dental zirconia. Materials (Basel) 14: 610. [Crossref]
- Yang B, Wolfart S, Scharnberg M, Ludwig K, Adelung R, et al. (2022) Influence of contamination on zirconia ceramic bonding. Dent Mater 38: e45-e54.
- Sulaiman TA, Altak A, Abdulmajeed A, Rodgers B, Lawson N (2022) Cleaning zirconia surface prior to bonding. J Prosthodont 31: 239-244. [Crossref]
- Xie H, Li Q, Zhang F, Lu Y, Tay FR, et al. (2021) Surface characterization of zirconia subjected to airborne-particle abrasion. Dent Mater 37: 210-220.
- Essam N, Abo-Elfarag SA, Attia A (2024) Bonding super translucent multilayered monolithic zirconia. BMC Oral Health 24: 1486. [Crossref]