Abstract
We describe an 81-year-old woman suffering from impaired consciousness due to non-convulsive status epilepticus (NCSE), which was investigated by means of magnetic resonance imaging (MRI), Electroencephalography (EEG), and N-isopropyl-p-[I123] iodoamphetamine single-photon emission computed tomography (IMP-SPECT).
After head injury from a traumatic accident, the patient had been in a continuous comatose state. An EEG performed at 28 hours after the seizure onset, showed generalized periodic epileptiform discharges, compatible with NCSE. Hyperperfusion in the right hemisphere was observed by IMP-SPECT in the acute phase. In the subacute phase, fluid-attenuated inversion recovery (FLAIR) image and an apparent diffusion coefficient (ADC) map indicated high signal intensity, suggesting predominant vasogenic edema. Simultaneously, diffusion weighted imaging (DWI) showed high signal intensity suggesting the coexistence of cytotoxic edema.
On follow-up, irreversible neuronal damage was evident by permanent left hemiplegia, impaired consciousness, and a localized slowing in the right fronto-parietal area on the follow-up EEG. A follow-up FLAIR image showed an enlargement of the lateral ventricle with increased signal intensity in the deep white matter, indicative of regional neuronal loss. Furthermore, IMP-SPECT showed nearly 20% lower accumulation of tracer in the corresponding area than in the contralateral brain tissue, indicating functional neuronal damage.
This case demonstrates the clinical usefulness of MRI and SPECT as complementary tools to accurately define the neuropathological transitions in a patient with NCSE following head trauma.
Key words
non-convulsive status epilepticus, magnetic resonance imaging, single-photon emission computed tomography
Introduction
There have been many case reports describing reversible and irreversible magnetic resonance imaging (MRI) findings following status epilepticus (SE) [1-10]. In addition to localized hyperperfusion, they also report changes including increased signal intensity on fluid-attenuated inversion recovery (FLAIR) and diffusion weighted (DW) imaging, and a variable degree of reduction in the apparent diffusion coefficient (ADC). The imaging findings associated with SE may reflect many physiologic changes, including cerebral edema, hyperperfusion, and an alteration of the blood–brain barrier as a consequence of ictal activity. However, the pathophysiology underlying seizure-induced signal changes on MRI is not clearly understood.
Herein, we report a case of long-term episodes of non-convulsive status epilepticus (NCSE), in which the MRI showed transitional abnormalities to focal brain atrophy, and discuss the clinical and therapeutic consequences. We carefully studied the transition of MRI signal changes on DWI, ADC maps and FLAIR images from the acute to the chronic phases. Follow-up N-isopropyl-p-[I123] iodoamphetamine single-photon emission computed tomography (IMP-SPECT) imaging supported the diagnosis of irreversible neuronal damage. This case demonstrates the clinical utility of MRI and SPECT as complementary tools to accurately detect the neuropathological transitions occurring during prolonged epileptic activities.
Case report
An 81-year-old woman accidentally fell and hit her head on the floor. Immediately after the accident, she developed generalized tonic-clonic seizures and was admitted to our hospital urgently. Although the generalized seizures were alleviated after administering 5mg of diazepam, she had been in a prolonged comatose state.
The initial MRI performed on the day after the epileptic seizure showed no remarkable traumatic or epileptogenetic findings (Figures 1(A-N) (A-C). The electroencephalography (EEG) performed at 28 hours after seizure onset showed generalized periodic epileptiform discharges with brief runs of high voltage, which was compatible with NCSE (Figure 2A). At five days after the seizure onset, IMP-SPECT showed an extremely high accumulation of tracer in the right fronto-parietal region, which was nearly 30% increased in comparison to the contralateral region (Fig 1M). From the MRI obtained at seven days after the seizure onset, the DW and FLAIR images showed abnormally high signal intensity along the gyri in the right parietal region (Figures 1D and 1F). In contrast, the ADC map indicated low signal intensity in the corresponding region (Figure 1E). From the MRI obtained at 14 days after the seizure onset, the ADC map and FLAIR image showed remarkably high signal intensity in the white matter of the right parietal region (arrows in Figures 1H and 1I). Simultaneously, the gray matter of the right parietal region had high signal intensity on the DW image without increased signal on the ADC map (arrowheads in Figures 1G and 1H).
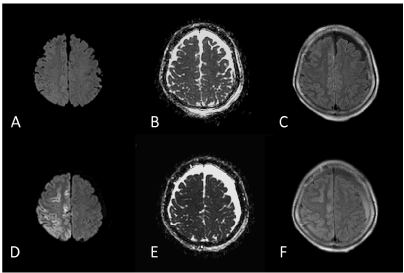
Figure 1 (A-F).(A-C) An initial MRI performed on the day after the epileptic seizure was unremarkable. (D-F) An MRI obtained at 7 days after the seizure onset. FLAIR and DWI showed abnormal signal intensity in the right parietal region. A very thin cortical region had high signal intensity on DWI with decreased signals on the ADC map, suggesting cytotoxic edema
For an antiepileptic regimen, the patient was given 400 mg of carbamazepine (CBZ) and 500 mg of levetiracetam (LEV) in the acute phase and 5 mg of clobazam (CLB) was added in the subacute phase. Subsequently, the CBZ, LEV and CLB doses were increased to 600mg, 1000mg and 8mg, respectively. She recovered gradually from the comatose state over several weeks. However, she had persistent left hemiplegia and impaired consciousness.
The patient received a follow-up MRI, IMP-SPECT, and EEG three months later. The FLAIR image showed brain atrophy with lateral ventricular dilatation in the right fronto-parietal region, and high signal intensity in the deep white matter (Figures 1L). The previous abnormality of the signal intensity in the right parietal region on the DWI, ADC map and the FLAIR imaging had disappeared completely (Figures 1J, 1K, and 1L). The EEG showed localized slowing in the right fronto-parietal region (Figure 2B). The IMP-SPECT showed nearly 20% lower accumulation of tracer in the right fronto-parietal region compared to the contralateral side (Figures 1M and 1N). Neurologically, she had persistent left hemiplegia and impaired consciousness, remained with only a little verbal response such as a greeting.
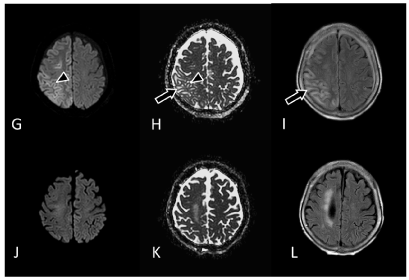
Figure 1 (G-L). An MRI obtained at 14 days after the seizure onset. The FLAIR image and ADC map showed high signal intensity in the subcortical gray/ white matter of the right parietal region, suggesting vasogenic edema (arrows). Simultaneously, a very thin cortical region had high signal intensity on the DWI without increased signal intensity on the ADC map, suggesting cytotoxic edema (arrowheads). (J-L) A follow-up MRI performed 3 months after the seizure onset. The abnormal signal intensity in the right parietal area on the DWI, ADC map and FLAIR images had completely disappeared. The FLAIR image showed atrophic changes with ventricular dilatation, in the right fronto-parietal region and high signal intensity in the deep white matter
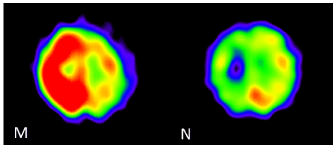
Figure 1 (M and N). (M) At 5 days after the seizure onset, N-isopropyl-p-[I123] iodoamphetamine single-photon emission computed tomography (IMP-SPECT) showed very high accumulation of the tracer in the right fronto-parietal region, which was nearly 30% higher than contralateral brain tissue. (N) At 3 months after the seizure onset, IMP-SPECT showed nearly 20% lower accumulation of tracer in the right fronto-parietal region compared to the contralateral brain tissue. DWI (A, D, G, J); ADC map (B, E, H, K); FLAIR (C, F, I, L); IMP-SPECT (M, N); R, right; L, left
Discussion
Recently, many clinical studies and case reports have demonstrated various MRI abnormalities due to SE [1-10]. Experimental models and several human cases with partial SE have demonstrated a decrease of ADC values in the epileptogenic foci, indicating cytotoxic edema [1]. However, some reports indicated the presence of vasogenic edema in partial SE [2], which proposed a mechanism for the reversibility of the lesions [3]. The seizure-induced metabolic demand and the ensuing hyperperfusion could cause vasogenic edema [4,11,12]. In contrast, coexistent cytotoxic edema may lead to the irreversible neuronal damage [4].
In our case, the marked high signal intensity in the right parietal gyrus on the DW image during the acute phase at seven days after seizure onset might suggest cytotoxic edema (Figures 1D and 1E). However, in the subacute phase at 14 days after seizure onset, the ADC map and FLAIR image showed high signal intensity in the white matter of the right parietal region (arrows in Figures 1H and 1I), suggesting predominant vasogenic edema [2]. In contrast, a very small area in the parietal gray matter showed high signal intensity on the same DW image without increased signal intensity on the ADC map (arrowheads in Figures 1G and 1H), suggesting the co-existence of cytotoxic edema.
Thus, the predominant MRI abnormalities in the epileptogenic area could be either vasogenic or cytotoxic edema, dependent on the interval after seizure onset. Vasogenic edema is usually considered reversible in comparison to cytotoxic edema [5]. However, in our case, some irreversible neuronal damage was indicated despite the prominent vasogenic edema in the subacute phase, because the patient’s left hemiplegia and impaired consciousness was persistent, and the follow-up EEG showed localized slow waves in the right fronto-parietal region (Figure 2B). Also, the follow-up FLAIR image showed an enlargement of the lateral ventricle with high signal intensity in the deep white matter (Figure 1L), indicating regional neuronal damage. Furthermore, the IMP-SPECT showed nearly 20% lower accumulation of tracer in the corresponding area compared to the contralateral region (Figure 1N). This finding indicates severe neuronal damage, because the tissue could no longer take up the radiotracer, even if the cerebral blood flow was preserved [12].
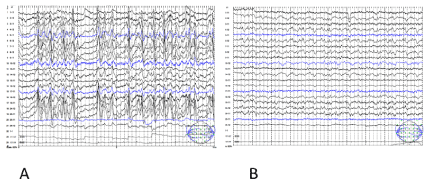
Figure 2. (A) During NCSE, the EEG documented the ictal discharges, which consisted of generalized periodic epileptiform discharges with intermittent runs of low voltage. (B) A follow-up EEG 3 months later showed slowing in the right fronto-parietal region
The possible mechanisms leading to irreversible neuronal damage were considered, as follows. First, the patient might have had continuous seizures resulting in further neuronal damage, because she suffered from long episodes in a comatose state for several weeks. Second, as a result, the irreversible damage might have been induced by the coexistent cytotoxic edema, which was largely masked by the prominent vasogenic edema, as seen in the small, thin cortical layer (arrowheads in Figures 1G and 1H). The follow-up FLAIR image and ADC map in the subacute phase showed newly developed high signal intensity in the underlying white matter, which was regarded as vasogenic edema (arrows in Figures 1H and 1I). As the change in the signal intensity on MRI in the underlying gray matter was observed only in the limited area of the preexistent cytotoxic edema, it would seem to be related to the NCSE per se, rather than another pathology such as ischemia, gliosis or inflammation. That is, the change of the signal intensity in the white matter on MRI could be an indication of seizure-induced irreversible damage. This hypothesis was supported by the additional SPECT study in the acute phase confirming extreme hyperperfusion (Figure 1M), which was regarded as continuing ictal activity [11,12].
In summary, the transition of MRI signal intensity with DWI, ADC maps, and FLAIR may be observed as vasogenic edema as well as cytotoxic edema in the subacute phase of NCSE and the recognition of these differences may be important for the diagnosis and understanding of the pathogenic mechanisms of NCSE. Also, functional imaging such as SPECT might be a useful tool for complementary information.
Conclusion
Irreversible brain damage in NCSE may be induced by cytotoxic edema following vasogenic edema. Follow-up MRI showed focal brain atrophy, which may be related to neurological sequelae. Decreased tracer uptake on SPECT in the chronic phase suggests irreversible neuronal damage. Although this is only a case report, it demonstrates the clinical usefulness of MRI and SPECT as complementary tools for accurately defining the neuropathological transitions that occur during prolonged epileptic activities. Prospective studies are warranted to meet the lack of data for this application of MRI and SPECT and to shed more light on the potential role in clinical practice.
Conflicts of interest
The authors have declared that no competing interests exist.
References
- Di Bonaventura C, Bonini F, Fattouch J, Mari F, Petrucci S, et al. (2009) Diffusion-weighted magnetic resonance imaging in patients with partial status epilepticus. Epilepsia 50 Suppl 1: 45-52. [Crossref]
- Hong KS, Cho YJ, Lee SK, Jeong SW, Kim WK, et al. (2004) Diffusion changes suggesting predominant vasogenic oedema during partial status epilepticus. Seizure 13: 317-321.
- Yaffe K, Ferriero D, Barkovich AJ, Rowley H (1995) Reversible MRI abnormalities following seizures. Neurology 45: 104-108. [Crossref]
- Szabo K, Poepel A, Pohlmann-Eden B, Hirsch J, Back T, et al. (2005) Diffusion-weighted and perfusion MRI demonstrates parenchymal changes in complex partial status epilepticus. Brain 128: 1369-1376.
- Mendes A1, Sampaio L2 (2016) Brain magnetic resonance in status epilepticus: A focused review. Seizure 38: 63-67. [Crossref]
- Bauer G, Gotwald T, Dobesberger J, Embacher N, Felber S, et al. (2006) Transient and permanent magnetic resonance imaging abnormalities after complex partial status epilepticus. Epilepsy Behav 8: 666-671.
- Kim JA, Chung JI, Yoon PH, Kim DI, Chung TS, et al. (2001) Transient MR signal changes in patients with generalized tonicoclonic seizure or status epilepticus: periictal diffusion-weighted imaging. AJNR Am J Neuroradiol 22: 1149-1160. [Crossref]
- Milligan TA, Zamani A, Bromfield E (2009) Frequency and patterns of MRI abnormalities due to status epilepticus. Seizure 18: 104-108. [Crossref]
- Kim SE, Lee BI, Shin KJ, Ha SY, Park J, et al. (2017) Characteristics of seizure-induced signal changes on MRI in patients with first seizures. Seizure 48: 62-68. [Crossref]
- Cole AJ (2004) Status epilepticus and periictal imaging. Epilepsia 45 Suppl 4: 72-77. [Crossref]
- Assal F, Papazyan JP, Slosman DO, Jallon P, Goerres GW. (2001) SPECT in periodic lateralized epileptiform discharges (PLEDs): a form of partial status epilepticus? Seizure 10: 260-265.
- la Fougère C, Rominger A, Förster S, Geisler J, Bartenstein P (2009) PET and SPECT in epilepsy: a critical review. Epilepsy Behav 15: 50-55. [Crossref]