Abstract
Objectives. The purpose of this study was to investigate respectively the effect of microwave irradiation post polymerization treatment, filling the repair resin with 2%wt. pretreated silica nanoparticles and the combined effect of nano-silica addition and microwave irradiation on the flexural strength and the linear dimensional stability of repaired Polymethyl Methcrylate denture base resin after accelerated aging.
Methods. Sixty specimens, fabricated with heat-polymerized resin, were cut in the middle with a 3 mm gap between the cut-shorts. The cut-edges were prepared with one of the following designs: Round, Ogee or Lap. For repair, an autopolymerizing resin was used. In the first group, the repair-resin was used alone. In the second, the repaired specimens were additionally subjected to microwave irradiation after polymerization. In the third group, the repair-resin was filled with 2%wt. pretreated nano-silica. In the fourth group the repair-method combined the use of silica nanoparticles and microwave irradiation post treatment. After aging in artificial saliva, dimensional variation rates were calculated and a three point bending test was performed to investigate the flexural strength. Then, Specimens were observed in a stereooptical microscope to determine the fracture mode. Data were analyzed by one-way-ANOVA followed by Tukey’s tests (a = 0.05).
Results. Statistically Significant differences were noted in the flexural strength mean-values between the four repair-methods. The dimensional variation rates were under 0.03% for all the groups. A dominant cohesive fracture mode was noted when silica nanoparticles were used.
Significance. The combination of autopolymerizing resin filled with 2%wt silica nanoparticles and post polymerization treatment with microwave irradiation showed the highest flexural strength mean-values without affecting the dimensional stability of the repaired specimens. Since the repair executed with silica nanoparticles’ filled resin proved to offer a sufficient bonding to the old resin, focus should be on the amelioration of the strength of the nano-filled repair-resin itself in order to further improve the mechanical properties of the repair.
Key words
denture base acrylic resin, dimensional stability; fracture mode; flexural strength; microwave irradiation; repair; silica nanoparticles.
Introduction
Acrylic resin is a well known material in the dental removable restorations field. It has been for decades the material of choice for dentures manufacture and it managed to keep a strong position to date despite the ceaseless evolutions in the dental biomaterials field. Being the material of choice does not mean that acrylic resin has the gold medal as a denture material. But, it achieved a wide acceptance by both patients and dental professionals through a combination of many desirable properties accredited to it which helped to overcome its shortcomings as a denture material. The imperfect side of this material opened a road to researches attempting to ameliorate it. In fact, the denture fracture problem is as old as the acrylic resin dentures themselves. A look in the literature could demonstrate the concerns about this lack of mechanical resistance of acrylic resin dentures resulting in its current fracture and fatigue failures. It created an inconvenience to both the denture wearer and the dentist. Thus, it could be considered as a failure of the executed treatment. Although a fractured denture could indicate that the patient’s oral situation dictates more than a simple reunion of fractured fragments, even so, the dentist must in most instances effect a repair until a more definitive treatment is scheduled. In addition to further consequences that are sometimes unnoticed regarding the incurred costs to the community of these repairs. We state as an example that “ in 1994 the National Health Service of England and Wales pays for approximately 0.7 million denture repairs each year at a cost of 6.6 million Euros” [1]
All the researchers adopting this problem have a common ultimate goal which is finding a repair solution that restore or reinforce the denture’s strength in order to avoid recurrent fracture. “At the same time, the repair procedure has to be rapid, easy to perform, inexpensive and must preserve the dimensions of the denture” and match its color.
Despite the wide range of suggested solutions to repair the damaged denture and to avoid further fracture, a consensus seemed not to be established yet. Many studies were carried out in attempt to reach these requirements; they are mainly summarized in two approaches.
The first approach considered the joint between the old and new resin. Some researchers, who advocate this approach, focused on chemical pre-treatments of the fracture-edges using, for example, the acrylic resin monomer, methyl chloride, ethyl acetate or acetone [2-5]. Others suggested a preparation of the fracture edge in a predetermined profile. The effect of changing the fractured edge profile on the properties of the repaired resin has been confirmed by several studies [6-7]. Several joint designs were advocated but not all of them were investigated [8].
The second approach aimed to ameliorate the used repair material properties by its modification or reinforcement. Various reinforcement attempts have been reported throughout literature including those of metal wires, metals nets, meshes and different types of fibers like Glass fibers, Aramid, Carbon and Polyethylene fibers [9,10] Another part of researchers in this second approach attempted to modify the composition of the repair material by adding micro-fillers and more recently nano-fillers like metal oxides and silica. Nanosilica addition has recently attracted researchers thus it showed encouraging results in different studies [11-14] but its efficiency as a repair resin’s filler need to be further investigated.
The current study was conducted to examine the effect of Microwave irradiation post polymerization treatment and the addition of silica nanoparticles to the resin’s matrix on the flexural strength and the dimensional stability of specimens after aging.
The null Hypotheses were that Microwave irradiation post-polymerization treatment; the addition of 2%wt silica nanparticles to the repair-resin would improve the flexural strength without affecting the dimensional stability. The combination of the two procedures would have a potentiation effect on the investigated properties
Materials and methods
Two types of Polymethyl Methacrylate resins and a powder of silica nanoparticles’ powder were used in this study. The materials and their chemical identification, Batch numbers, manufacturers together with the mixing proportions of monomer to polymer (when applicable) are shown in (Table-1).
Table 1. Materials used in this study
Materials |
Chemical identification |
Manufacturer and Batch numbers |
Mixing proportions |
Major.base .20 Powder/ Liquid |
Powder:Methylmethacrylate Polymers, Benzoil Peroxide.
Liquid: Methylmethacrylate (>97%), Ethylene glycol dimethacrylate (<3%) |
MAJOR Prodotti Dentari S.p.A. 23, via Einaudi I - 10024 MONCALIERI. Italy. Batch numbers 7E2094 / 801812 |
33g of powder to 15 mL of monomer |
Veracril® Self-cure Acrylic Powder/ Liquid |
Powder: Methylmethacrylate polymers (90 to 99%), Pigments, Polyester (If a veined reference is required).
Liquid: Methylmethacrylate, Ethylene Glycol Dimethacrylate, Chemical initiator (Tertiary Amine) |
New Stetic S.A.
Cr 53 No. 50-09 Guarne, Antioquia. Batch numbers: 1502HT/ 1400VT |
Powder /monomer= 1/3 |
Hdk® n20
Hydrophilic pyrogenic silica |
Pyrogenic micro-dispersed silica,
synthetic X-ray amorphous silicon dioxide (SiO2) >99.8% |
Wacker Chemie AG
Hanns-Seidel-Platz 4
81737 München, Germany |
(not applicable) |
Specimens’ preparation
Sixty specimens were fabricated using the heat-polymerized resin (Table-1) measuring in millimeters (Length= 64.0 mm; Width= 10.0 mm; Height= 3.3 mm) as required by ISO standards 20795-1:2013 [15].
Plexiglas-patterns were used for the specimens’ manufacture because this eliminated many of the variables present in attempting to make uniform wax-patterns of the specimens. For precise fabrication regarding polymerization shrinkage of the resin and regarding specimens’ grinding during finishing, we designed these Plexiglas patterns in larger dimensions than required. They were directly invested in the denture flask using a triple pour technique.
The heat-polymerized resin was mixed following the manufacturer’s instructions employing a mixing ratio of 33g of powder to 15 ml of monomer. After 2minutes and 30 seconds from the start of the mix, the material reached the dough stage and was packed into the molds. During packing two trials closure were performed to expel the excess material before the final closure of the flask under pressure of 160 bars. Clamps were used to hold the flask under pressure during the curing cycle. Then, the specimens were proceeded with a long curing cycle at 70°C for 7hrs then at 100°C for 1 hrs. The flask was then allowed to cool down in the curing recipient to room temperature. After deflasking, specimens were slightly oversized compared to the finished strips. Three measurements of the specimens’ height along the long axis were taken using a digital caliper (with an accuracy of 0.01 mm). All surfaces were wet-grinded smooth and flat with silicone-carbide grinding papers from 600 to 1000 grit until the required dimensions were reached.
On one of the two large surfaces of the specimens, marks were made using a cylindrical acrylic trimmer. They were 2mm away from specimens’ edges. These marks served for the exact repositioning of the Digital Caliper during the dimensional measuring.
Thereafter, the finished specimens were stored in water at ambient temperature for 48 hours simulating the interval of time before the denture’s delivery to a patient.
Repair indexes preparation and the specimens’ cut procedure
Specimens were removed out of water and they were vaselined. Plaster-indexes were made by investing them in Type III dental plaster.
Then, they were inserted in a specially designed stainless steel holding device used during the cut and the edge preparation steps (Figure-1). This holding device has 5 recesses that fit the specimens with 3mm central groove. A double sided diamond disc was used to cut the specimens, creating a 3 mm gap between the shorelines of the freshly-fractured specimen.
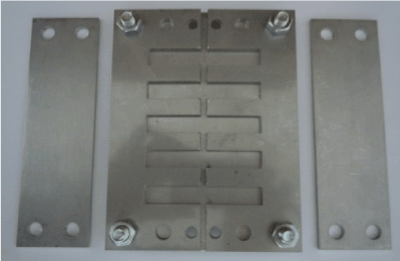
Figure 1. The designed holding device used in this study
Edge-profile preparation
The sixty specimens were divided in 3 groups according to the edge-profiles: Round (R), Ogee (O) and Lap (L) respectively shown in (Figure-2,3,4)
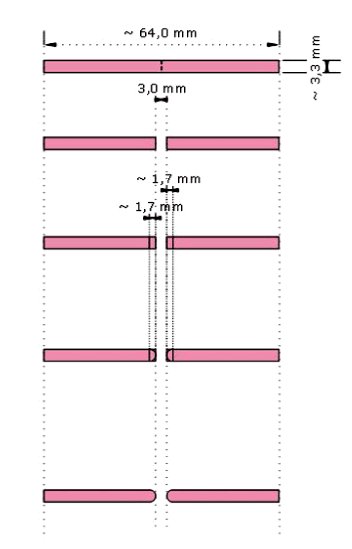
Figure 2. Schematic illustration of Round edge-profile preparation
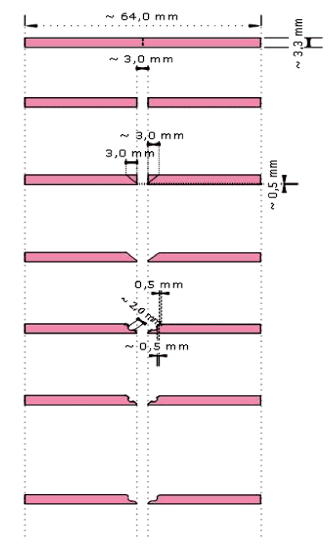
Figure 3. Schematic illustration of Ogee edge-profile preparation
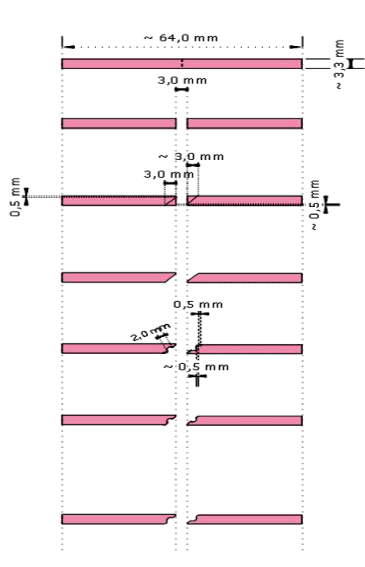
Figure 4. Schematic illustration of Lap edge-profile preparation
Specimens’ repair
Each edge-profile group was divided in 4 similar subgroups of 5 specimens named respectively (C, Mw, S and Sw).
Subgroup C was repaired using autopolymerizing resin in a conventional manner. A separating medium was applied in the interior of the corresponding plaster-indexes. The 2 parts of each specimen were inserted in their right position. The auto-polymerizing resin was mixed with a powder/monomer mixing ratio 1/3 and was added into the gap gradually in its free flowing stage. The space was intentionally slightly overfilled in order to ensure a complete joint and to allow for polymerization shrinkage and for finishing. When the repair material lost its surface glaze (3 minutes from the mixture’s start), the repaired samples were coated with Vaseline and the whole set was placed in a pressure vessel containing water at 35°C under 2.3 bars (± 2 bars) pressure for 25 minutes. Then, the specimens were retrieved and finished.
For subgroup Mw the repair was executed in the same manner as Subgroup C. Except after finishing, the specimens were subjected to an additional step of post-polymerization treatment by microwave irradiation in a domestic adjustable wattage microwave oven at the settings of 600W continuously for 3 min. During the process, specimens were not immersed into water and a glass with 150 ml of water was kept inside the oven.
For Subgroups S, the resin used for the repair was filled with 2wt% silica nanoparticles. These nanoparticles were subjected to a pretreatment step before their use. The initial powder was subjected to a surface treatment procedure with a silane coupling agent. Thereafter, it was subjected to a coating step with a polymerizable monomer (which was in our case the monomer of the used autopolymerizing repair-resin). The resulting product was then subjected to a final step of pretreatment with heat at 110 °C for 2 hours in an electric oven.
For both subgroups S and Sw, the mixing of the repair material was performed in two steps: solution pre-polymerization and a final mixing step. A pre-mixture of the repair-resin was made of a syrup consistency (powder/liquid ratio = 2/5 by volume). Then, the predetermined quantity of pretreated silica powder (2wt%) was added with vigorous stirring using a magnetic stirrer for about 1 minute. In the final step, the remaining polymer’s powder portion was added to the stirred mixture. This produced a doughy mixture, added gradually in its free flowing stage in the gap between the specimens’ halves. When it had lost its glaze, the repaired specimens were coated with Vaseline. Then they were processed in the Pressure Pot and finished with the same parameters as described for subgroup C.
Subgroup Sw was repaired in the same way as subgroup S. Except after finishing, specimens of subgroup Sw underwent an additional step of post-polymerization treatment by microwave irradiations with the same settings and parameters as described for subgroup Mw.
The accelerated Aging
All the specimens underwent a simplified protocol of accelerated aging according to the 10 degree rule applied to polymers. This rule states that the rate of a chemical reaction will increase by a factor Q10 for every 10°C increase in temperature. The typical value selected for commonly used polymers in dentistry is Q10=2 [16]. The aging approach in this study considered the application of an elevated temperature for a relatively short period of time in order to predict the real aging level in a more extended period of time at lower temperature in oral environment. It was assumed that the rate of accelerated aging “AF (aging factor)” respects the following mathematical relationship (Eq-1-):
(Eq-1-):AF= Xr / Xt = Q10 .exp (DT°.10-1),
(with DT° = T°(age) - T°(ref) )
We carried the accelerated aging of specimens in a water bath set with artificial saliva heated to a constant aging temperature T°(age)=60°C for a test time interval Xt=312 Hours(± 2 Hrs). The reference temperature T°(ref) selected was the average oral temperature of 37°C (thermal fluctuations in the oral environment caused by extrinsic factors such as food were excluded). This leaded to a simulated natural aging time interval Xr=1538 Hours.
Dimensional stability investigation
A numerical distance vector was defined for each specimen by the following relation (Eq-2-) [17]:

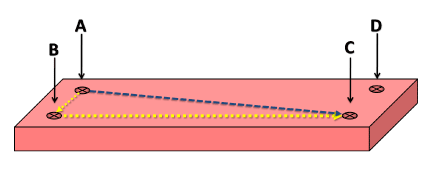
Figure 5. The performed marks on the specimens for the dimensional measurements designated by letters
The dimensions were measured using an electronic digital caliper with an accuracy of ±0.01 mm at two stages, before the specimen’s cut(Initial specimen’s dimensions) and after aging (final specimen’s dimensions). The distances were measured 3 times and the average of these 3 readings was considered for the calculation of the dimensional variation rates in percentages as follow (Eq-3-):

The flexural strength
The flexural strength test was a 3 point bending test. It was performed according to ISO standards [15] using an universal testing machine (Tinius Oslen®, H5KS, model HTE 5000N) with metal flexural test rig. The distance between the supports was fixed at (50mm ±0.1). The force on the loading plunger was increased uniformly from zero, using a constant displacement rate of 5mm.min-1 (±1mm.min-1) until the specimen broke. The maximum load “F” exerted on the specimen was noted and the ultimate flexural strength was calculated in Mega Pascal (MPa).
Fractography
A stereomicroscope (ZUZI serie 240, Model 50240002, manufactured by AUXILAB, S.L.Poligono Morea Norte, Spain) was used for fractograchic observations. After the flexural strength test, the fracture surfaces were observed and the fracture mode was specified whether it was an adhesive, cohesive or a mix fracture.
Statistical analyses method
Data were analyzed by one-way ANOVA analysis of variances between the groups followed by multiple comparisons Post Hoc Tukey’s test to analyse the variances within the groups. The chosen level of significance was a = 0.05.
Results
The mean-values and standard deviations of the flexural strength and the dimensional variation rates are seen graphically respectively in (Figure 6,7)
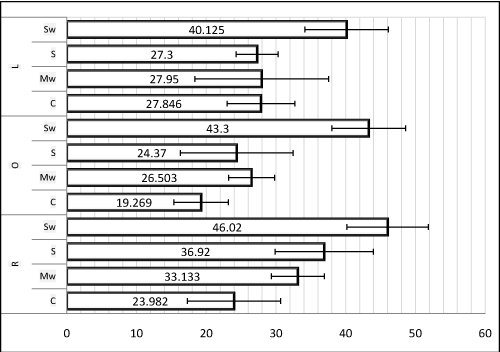
Figure 6. Mean-values and standard deviations of the flexural strength (Unit: MPa)
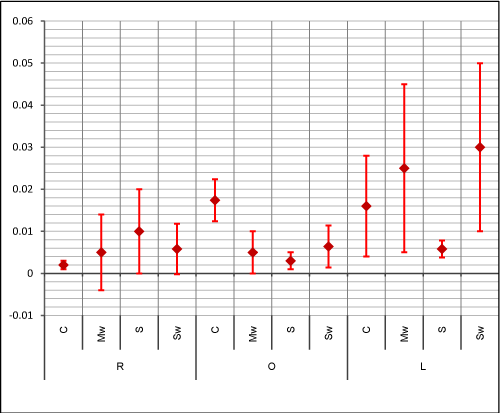
Figure 7. Mean-values and standard deviations of the dimensional variation rates (Unit: %)
The One-Way-ANOVA test’s results (a=0.05) for the dimensional variation rates were only significant for the Ogee profile group (p=0.012). For the other edge profile’s groups the noted values were respectively (p= 0.076) for the round profile and (p=0.287) for lap profile group. Results of the One-Way-ANOVA analysis for the flexural strength are shown in (Table-2).
Table 2. One-Way-ANOVA analysis of variance of the flexural strength for each profile-group
Profile |
Source of variation |
D.f.¶ |
Sum of Square |
Mean Square |
F test |
P Value* |
Round |
Inter-groupes |
3 |
1249.460 |
416.487 |
10.319 |
0.001 |
Intra-groupes |
16 |
645.758 |
40.360 |
|
|
Total |
19 |
1895.218 |
|
|
|
Ogee |
Inter-groupes |
3 |
1625.736 |
541.912 |
17.804 |
0.000 |
Intra-groupes |
16 |
0487.001 |
30.438 |
|
|
Total |
19 |
2112.737 |
|
|
|
Lap |
Inter-groupes |
3 |
0579.917 |
193.306 |
5.351 |
0.010 |
Intra-groupes |
16 |
0577.983 |
36.124 |
|
|
Total |
19 |
1157.899 |
|
|
|
* Level of significance p< 0.05 ; ¶ Degree of freedom. |
Multiple comparisons Tukey’s test showed statistically significant differences for the flexural strength between the subgroups (p<0.05). For the dimensional variation rates we noted significant differences only in Ogee profile group between subgroup C and respectively Subgroups S and Mw. The founded p-Values of this test were summarized in (Table-3).
Table 3. Summary of Tukey’s test analyses of the flexural strength’s results (Table 3A) and the dimensional stability (Table 3B)
Table 3A |
Table 3B |
Round Profile (R) |
Round Profile (R) |
|
C |
Mw |
S |
|
C |
Mw |
S |
Sw |
0.000* |
0.025* |
0.148 |
Sw |
0.746 |
1.000 |
0.307 |
S |
0.025* |
0.783 |
|
S |
0.055 |
0.284 |
|
Mw |
0.145 |
|
|
Mw |
0.776 |
|
|
Ogee Profile (O) |
Ogee Profile (O) |
|
C |
Mw |
S |
|
C |
Mw |
S |
Sw |
0.000* |
0.001* |
0.000* |
Sw |
0.058 |
0.994 |
0.871 |
S |
0.480 |
0.928 |
|
S |
0.013* |
0.956 |
|
Mw |
0.204 |
|
|
Mw |
0.036* |
|
|
Lap profile (L) |
Lap profile (L) |
|
C |
Mw |
S |
|
C |
Mw |
S |
Sw |
0.024* |
0.026* |
0.018* |
Sw |
0.636 |
0.951 |
0.263 |
S |
0.999 |
0.998 |
|
S |
0.891 |
0.529 |
|
Mw |
1.000 |
|
|
Mw |
0.907 |
|
|
* Significant difference (p< 0.05) |
In (Figure-8), modes of fracture were presented by percentages as a function of the four repair subgroups. We claim that no correlation was found between the fracture mode and the variation of the edge-profile.
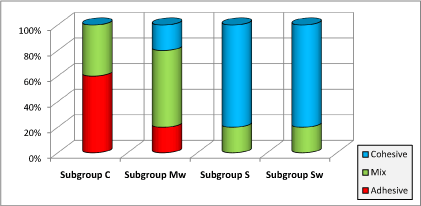
Figure 8. Fracture mode results for the four repair subgroups by percentages
Discussion
The dimensional stability of a denture base resin is not only related clinically to the adaptation of the denture base to the associated oral tissues but also to the water absorption of the denture’s material in the mouth .This water absorption ,besides its effect on the denture’s dimensions, would also interfere with its mechanical qualities in the long term due to the plasticizing effect of the water on the resin. So, a material with greater dimensional stability in time would result in a greater survivability of the dental prosthesis. The choice of the repair material and repair method must take in consideration in addition to the other required properties, that the dimensional changes of the repaired specimens are of a degree that would not be detected clinically even in a relatively long term. In our study the dimensional stability was not significantly influenced by varying the repair method except for the Ogee profile group where we noted a significant differences between subgroup C and respectively Subgroup Mw (p= 0.036) and subgroup S (p= 0.013). These findings disagreed with ElBahra et al study [18] that reported statistically significant differences for all the tested autopolymerizing resins after aging in water. In some points our results agreed with Dixon et al study [19] that compared the linear dimensional rates after aging in water claiming that the changes were not significant and not clinically detectable although their rates were superior to our dimensional rates. Our maximum noted dimensional variation rate was of 0.03%. Further investigations are required to reveal whether these values are of a clinical relevance.
Results of the flexural strength showed an overall improvement when the resin was reinforced with the pretreated silica nanoparticles without showing in overall significant changes in the dimensional stability. The null hypothesis that Addition of 2wt% pretreated silica to the repair-resin would improve the flexural strength of the repaired specimens compared to specimens repaired with unfilled resin was confirmed. These results are in agreement with Alnamel et al. [11] and Chladek et al. [12] researches. Chladek et al. reported an enhancement in the mechanical properties and a decrease of the water sorption. In their study, the highest flexural strength results were noted for resin with 2wt% silica after aging in ethanol. They suggested a protective effect of the nano-silica during aging particularly in extreme conditions. A possible explanation for our findings is that the protective role of nano-silica permitted to keep a bigger amount of the prior to aging-mechanical properties than the other subgroups (C and Mw). Meanwhile, our results disagreed with Mc Nally [20] who reported no beneficial effects of silica-nanoparticles on the mechanical properties. But it should be noted that their experiment considered the use of resins with silica contents below 1%. Hong et al. [21] claimed that the unique effects of these fillers “can be effective only when the nanoparticles are well dispersed in the surrounding polymer matrix”. This claim was proven by the major part of the studies that we considered. Balos et al. [13] correlated the enhancement of properties is related to the homogeneity of the filled resin. The agglomeration of the filler nanoparticles is proportional to the resin’s filler contents. According to their research 0.91% silica resulted in a decrease in the mechanical properties which contraversed our results thus 2% of silica resulted in an overall better flexural strength than subgroup C . We might correlate this contraversion to the effect of the silica powder pre-treatment used in our protocol in an attempt to obtain a homogeneous filled resin and to minimize the agglomeration between the nanoparticles
We attempted to obtain a good dispersion of the nanoparticles in the repair-resin by adding them to a resin’s premixture during magnetic stirring. This would foster the interaction of the nanoparticles/resin at the expense of nanoparticles with each other that would result in their agglomeration. Sodagar et al. [14] claimed that one of the ways attempting to prohibit association of small particles is the use of silane as coupling agent between nano-sized silica particles and resin. In our protocol the nanosilica’ pretreatement included their silanization. Hong et al. [21] recommended the use of a coupling agent to increase the compatibility between the resin and the nanoparticles. This compatibility has a major influence on the resulting resin properties. Several studies confirmed this recommendation and reported that the silane pretreatment showed much better results than the use of bare nanoparticles to reinforce the resin. The polymers’ properties are in general associated to the interface between the inorganic and the organic phases presented respectively by the nano-silica and the resin’s matrix [22]. If this interface is strong enough, the applied external forces will be transferred from the resin’s matrix to the inorganic phase which had in most cases a much better mechanical properties. This would result in the reinforcement of the whole material. In contrast, if the interface is not strong enough, it would break down first under applied external forces. And so, the inorganic phase became the weak point in the material and further deteriorates the mechanical properties.
The improvement of the flexural strength in our experiment might be explained by the fact that a good coupling between the filler and the matrix thus the silane promoted the mechanical forces’ transfer to the nano-filler which presented a stronger field than the resin’s matrix.
Subgroup Mw showed better results than Subgroup C regardless the edge-profile. The null hypothesis that the microwave irradiation improved the flexural strength was retained.. This finding agreed with Blagojević et al. [23] results who used the same (power/exposure time) settings. However, we should note that in their protocol, the specimens were put in water during irradiation. The immersion of resin in water during irradiation could influence the results since in addition to the microwave irradiation effect; the reduction of the residual monomer level could be accounted to the leaching action of monomer into water [24] which is known to be enhanced by the water temperature [25]. In our experiment we “microwaved” the specimens in dry conditions in order to put out the effect of diffusion into water and hydrolysis mechanisms on the physical and mechanical properties of the specimens [26,27]. Since acrylic denture resins are transparent to microwaves i.e. they neither absorb nor reflect, a bowl of water was placed inside the oven parallel to the resin blocks to absorb the generated heat, prevent the overheating and protect the magnetron of the microwave machine.
Improvement in mechanical properties due to a further polymerization by microwave irradiation has been proven by several researchers [1,25,26]. Yunus et al. [1] correlated the mechanical strength of the resin to the level of its residual monomer content suggesting that the microwave irradiation reduced the residual monomer level as a result of a higher degree of polymerization. Urban et al. [27] advocated that in addition to the further polymerization degree, the reduction of residual monomer level could result from the evaporation of the monomer by the generated heat in the microwave oven. This explanation needs to be further investigated because the monomer’s evaporation would lead to internal micro-porosity that would logically decline the mechanical strength.
Several researchers agreed on the potentially beneficial effect of the microwave irradiation on the resin’s mechanical properties, but they disagreed about the needed (power/exposure time) settings to reach the maximum benefits. In fact the same (power/exposure time) setting in the same experiment could significantly improve the mechanical properties of one resin and have no effect on the others [25]. This variability might be referred to the concentration of longer lived radicals in the resin that are essential for the post-polymerization reaction. The concentration of these radicals is directly dependent of the difference in composition and in the concentration of peroxide and amine of the resin. Lamb [28] related the ratio of peroxide/amine directly to the powder/liquid ratio of the resin. Patil et al. [29] suggested also that the residual monomer level is related to the content of cross-linking agents in the resin as well.
We suggest that the variability of mechanical properties of the resin with the different (power/exposure time) settings can be referred to the dominant mechanism of residual monomer level’s reduction. At a specific, inappropriately high (power/exposure time) settings, the monomer’s reduction mechanism by evaporation of the monomer will be more dominant than its reduction by the mechanism of further polymerization. This dominating mechanism would result in internal micro porosities that would alter the resin’s properties. For another (power/exposure time) settings the reduction of the monomer by evaporation might be insignificant and the major parts of the residual monomer would be used for further polymerization reaction. We suggest that this increase of the polymerization degree would lead to better mechanical properties of the resin.
The null hypothesis claiming that combined use of 2wt% pretreated silica and microwave irradiation post-polymerization treatment has a potentiation effect was retained since subgroup Sw showed the highest flexural strength values for all the edge profiles. We suggest that in addition to the effect on the resin matrix, microwave irradiations influenced the interfacial layer between the nano-filler and the resin’smatrix. De Rosatto et al. [30] claimed that one factor that may influence the silane effectiveness is incomplete solvent evaporation. Da Silva et al. [31] reported in their research that the silane coupling agent is sensitive to water. Ishida and Koenig [32] reported a reduction in the amount of bonded silane during soaking in hot water due to hydrolytic degradation.
We suggest that the effect of microwave irradiations on the interfacial layer consisted in the residual solvent’s elimination and the entrapped humidity evaporation leading to further reaction of the coupling layer with the two bonded fields. This improvement in the bond between nano-silica particles and the resin’s matrix might consequently result in a better transfer of the applied forces to the nano-filler that presents the stronger field leading to an enhancement of the mechanical properties of the entire material.
The results of the fractographic observations showed that adhesive fractures were reported only in subgroups C and Mw. For the subgroups including 2%wt pretreated silica filler the dominant fracture mode was cohesive. An advocated explanation for these results is that the addition of silica resulted in a better bonding between the repair and old resins. An advantage of the use of 2% pretreated nano-silica is to shift the mode of fracture from a weak adhesive fracture to a stronger cohesive one. Ward et al. claimed that “cohesive failure of the repair material indicates that a sufficient bonding to the repair surface has been achieved. Since the repair executed with the nano-silica filled resin proved to offer a sufficient bonding to the old resin, focus should be on the amelioration of the strength of the nano-filled repair-resin itself in order to further improve the mechanical properties of the repair.
Regarding the complexity of the oral environment, results of this in vitro study could only give a partial prediction of the possible behavior of the investigated repair-options in vivo. The used rectangular shaped specimens provided data which cannot be fully attributed to the clinical scenario because this shape is far from the dentures’ real shape. In fact, the founded values cannot be considered as characteristic for the dentures because even under stringent testing conditions these values are influenced by the thickness and form of the tested-resin.
Conclusion
Within the limitations of this study the following conclusions were drown:
The dimensional stability was not significantly influenced by varying the repair method except for the Ogee profile group. The maximum noted dimensional variation rate was of 0.03%. Further studies are required to reveal whether this value is of a clinical relevance.
The combination of autopolymerizing resin filled with 2% silica nanoparticles and post polymerization treatment with microwave irradiation at 600W continuously for 3 minutes showed the highest flexural strength mean-values without affecting the dimensional stability of the repaired specimens.
Since the repair executed with the nano-silica filled resin proved to offer a sufficient bonding to the old resin, focus should be on the amelioration of the strength of the nano-filled repair-resin itself in order to further improve the mechanical properties of the repair.
Acknowledgements
None
Funding informations
This research did not receive any specific grant from funding agencies in the public, commercial, or not-for-profit sectors.
Conflicts of interest
The author declares no potential conflicts of interest.
References
- Yunus N, Harrison A, Hugett R (1994) Effect of microwave irradiation on the flexural strength and residual monomer levels of an acrylic resin repair material. J Oral Rehabil 21: 641-8. [Crossref]
- Colvenkar SS, Aras MA (2008) In vitro evaluation of transverse strength of repaired heat cured denture base resins with and without surface chemical treatment. J Indian Prosthodont Soc 8: 8-93.
- Kostulas I, Kavoura VT, Frangou MJ, Polyzois GL (2008) Fracture force, deflection, and toughness of acrylic denture repairs involving glass fiber reinforcement. J Prosthodont 17: 257-61. [Crossref]
- Nagai E, Otani K, Satoh Y, Suzuki S (2001) Repair of denture base resin using woven metal and glass fiber : effect of methylene chloride pretreatement. J Prosthet Dent 85: 496-500. [Crossref]
- Sarac YS, Sarc D, Kulunk T, Kulunk S (2005) The effect of chemical surface treatments of different denture base resins on the shear bond strength of denture repair. J Prosthet Dent 94: 259-66. [Crossref]
- Hanna EA, Shah FK, GABReel AA (2010) Effect of joint surface contours on the transverse and impact strength of denture base resin repaired by various methods. An in vitro study. J Am Sci 6: 115-25.
- Anasane N, Ahirrao Y, Chitnis D, Meshram S (2013) The effect of joint surface contours and glass fiber reinforcement on the transverse strength of repaired acrylic resin: an in vitro study. Dent Res J (Isfahan) 10: 214-9. [Crossref]
- Ward JE, Moon PC, Levine RA, Behrendt CL (1992) Effect of repair surface design, repair material and processing method on the transverse strength of repaired acrylic denture resin. J Prothet Dent 67: 815-20. [Crossref]
- Venkat R, Gopichander N, Vvasantakumar M (2013) Comprehensive analysis of repair/reinforcement materials for polymethyl methacrylate denture bases : mechanical and dimensional stability characteristics. J Indian Prosthodont Soc 13: 439-49. [Crossref]
- Vojvodić D, Komar D, Schauperl Z, et al. (2009) Influence of different glass fiber reinforcements on denture base polymer strength (fiber reinforcements of dental polymer). Medicinski Glasnik 6: 227-34.
- Alnamel HA, Mudhaffer M (2014) The effect of silicon di oxide nano-fillers reinforcement on some properties of heat cure polymethyl methacrylate denture base material. J Bagh Coll Dent 26: 32-6.
- Chladek G, Zmudski J, Basa K (2015) Effect of silica filler on properties of pmma resin. Arch Mater Sci Eng 71: 63-72.
- Balos S, Pilic B, Markovic D, Pavlicevic J, Luzanin O (2014) poly(methyl-methacrylate) nanocomposites with low silica addition. J Prosthet Dent 111:327-334. [Crossref]
- Sodagar A, Bahador A, Khalil S, et al. (2013) The effect of tio2 and sio2 nanoparticles on flexural strngth of poly(methyl methacrylate) acrylic resins. J Prosthodont Res 57: 15-9. [Crossref]
- International standarizing oraganisation. Iso 20795-1: 2008. Dentistry- basepolymers- part 1: denture base polymers. Standard revised by: iso 20795-1: 2013.
- Lambert BJ, Tang FW (2000) Rationale of practical medical device accelerated aging programs in aami tir17. Radiat Phys Chem 57: 349-53.
- Salim S, Sadamori S, Hamada T (1992) The dimensional accuracy of rectangular acrylic resin specimens cured by three denture base processing methods. J Prosthet Dent 67: 879-81. [Crossref]
- El Bahra S, Ludwig K, Samran A, Wolf SF, Kern M (2013) Linear and volumetric dimensional changes of injection-molded pmma denture base resins. Dent Mater 29: 1091-97. [Crossref]
- Dixon DL, Breeding LC, Ekstrand KG (1993) Linear dimensional variability of three denture base resins after processing and in water storage. J Prosthet Dent 68: 196-200. [Crossref]
- Mc nally L, O’sullivan DJ, Jagger DC (2006) An in vitro investigation of the effect of the addition of untreatedand surface treated silica on transverse and impact strength of poly (methyl methacrylate) acrylic resin. Biomed Mater Eng 16: 93-100. [Crossref]
- Hong RY, Fu HP, Zhang YJ (2007) Surface-modified silica nanoparticles for reinforcement of pmma. J Appl Polym Sci 105: 2176-84.
- Yang F, Nelson GL (2004) Pmma/silca nanocomposite studies : synthesis and properties. J App Polym Sci 91: 3844-50.
- Blagojevic V, Murphy VM (1999) microwave polymerization of denture base materials. A comparative study. J Oral Rehabil 26: 804-8. [Crossref]
- Lamb DJ, Ellis b, Priestley D (1982) Loss into water of residual monomer from autopolymerizng dental acrylic resin. Biomaterials 3: 155-9. [Crossref]
- Seo RS, Vergani CE, Giampaolo ET, et al. (2007) Effect of post-polymerization treatments on the flexural strengthy and vickers hardness of reline and acrylic denture base resins. J Appl Oral Sci 15: 506-11. [Crossref]
- Suvarna S, Chhabra T, Raghav D (2014) Residual monomer content of repair autopolymerizing resinafter microwave postpolymerization treatment. Eur J Prosthodont 2: 28-32.
- Urban VM, Machadoal, Oliveira RV, Vergani CE, Pavarina AC (2007) Residual monomer of reline acrylic resins. Effect of water bath and microwave post-polymerization treatments. Dent mater 23: 363-8. [Crossref]
- Lamb DJ, Ellis B, Priestley D (1983) The effects of process variables on levels of residual monomer in autopolymerizing dental acrylic resin. J dent 11: 80-8. [Crossref]
- Patil PS, Chowdhary R, Mandokar RB (2009) Effect of microwave postpolymerization treatment on residual monomer content and the flexural strength of autopolymerizing reline resin. Indian J Dent Res 20: 293-297. [Crossref]
- De Rosatto CM, Roscoe MG, Novais VR, Menezes Mde S, Soares CJ (2014) Effect of silne type and air-drying temperature on bonding fiber post to composite core and resin cement. Braz Dent J 25: 217-24. [Crossref]
- Da Silva LH, Feitosa SA, Valera MC (2012) Effect of the addition of silinated silica on the mechanical properties of microwave heat-cured acrylic resin. Gerodontology 29: e1019-23.
- Ishida H, Koenig JL (1980) Effect of hydrolysis and drying on the siloxane bonds of a silane coupling agent deposited on e-galss fibers. J Polym Sci Poly Phys Ed 18: 233-7.