Abstract
In this study we observed the influence of the premenstrual syndrome (PMS) on the partner relationship for both partners in a daily online survey through one complete menstrual cycle. We found clear evidence for relationship difficulties (manifested in a decrease in satisfaction and shared good experiences and an increase in dispute) during the last week of the cycle in the PMS group for women. In addition, there was a significant difference between the groups (with/without PMS symptomatic) throughout the complete cycle with less satisfaction and less shared good experiences in the PMS group for men. Thus, we can conclude that PMS affects the relationship and this effect influences both partners in different patterns. The results of this study could add new aspects to marital and family therapy. Consequently, attention should be paid to the influence of PMS on partner relationships.
Key Words
Premenstrual syndrome, partner relationship, relationship satisfaction, gender difference
Background
The premenstrual syndrome (PMS) brings menstrual cyclic change to women in the late luteal phase with a multitude of different psychological or physical symptoms, starting premenstrually during the last week of the cycle and ending with the onset of the menses or shortly after [1]. While premenstrual symptoms such as irritability or mood swings are widespread and can be found in 75-95% of all women [2-4], PMS additionally leads to distress associated with these symptoms [5]. It is thereby important to delimit the reported symptoms from other causes like psychological disorders or the use of psychotropics [5]. Depending on the severity of distress and the characteristics of the symptoms, a distinction can be drawn between the premenstrual syndrome (PMS), which occurs as less severe, and the premenstrual dysphoric disorder (PMDD), which is the severe manifestation. The Diagnostic and Statistical Manual of Mental Disorders (DSM) in the fourth edition [6] only includes clear classifications for a diagnosis of PMDD; in the fifth edition (DSM-5) [5], however, the DSM also lists the premenstrual syndrome as a differential diagnosis. PMS is rather common and occurs approximately in one out of four women [1].
PMS and how to deal with it
There is evidence that severe PMS symptoms can be attenuated when the woman uses oral contraceptives containing drospirenone and low estrogen [7] or psychotropics [8]. Particularly selective serotonin reuptake inhibitors (SSRIs) are used as main therapy for severe PMS according to Brown, O'Brien, Marjoribanks and Wyatt [9]. Furthermore, symptom relief is observed by women receiving individual cognitive behavioral therapy [10].
PMS in everyday life
Research shows a great variety of burden of PMS on women’s daily life. Its effects range from a light impairment to a total disability to fulfill one’s job during the acute phase of the PMS [11]. Borenstein, Chiou, Dean, Wong and Wade [11] estimated the economic damage resulting from indirect costs caused by PMS (due to a decrease in productivity or even total absence from work) to be more than 4300 US $ a year per woman affected. Dennerstein, Lehert, Bäckström and Heinemann [12] conducted a large telephone survey among women in Europe and South America, finding 35% of all women suffering from PMS being moderately or severely affected by PMS in their everyday life. In a recent study, Kapur [2] investigated the impact of PMS on different aspects of everyday life. A high number of women suffering from PMS reported disturbance at work or school (36%), lower productivity (58%), disturbance in social life (44%) or a negative impact on family life (44%) due to the symptoms.
PMS is not stable throughout a woman’s lifespan [13]. The severity of the symptoms and their characteristics are
also effected by the woman’s family and private life [13-16].
PMS and the partner relationship
The impact of the personal environment or family on the severity of PMS symptoms was explored in some interview studies conducted by Jane Ussher [13,15,16]. Evidence was found indicating an impact of satisfaction with the relationship in general and the support by the male partner on the woman’s perceived severity of her PMS symptoms. Women in unhappy relationships reported more severe PMS symptoms than women in happy relationships; the week before the period sets in was named the “vulnerable phase”, where a breakout of existing dissatisfaction in the relationship or feelings of overload were more likely [15]. To conclude, PMS should not only be seen as solely the woman’s problem or a static phenomenon, instead it results from ongoing interaction of material, discursive and intrapsychic factors with the family environment being the main theatre of operations [15]. Ussher brought a new point of view by considering the women’s “pathological overreactions”, described as reactions under PMS, as a characteristic of problems in the relationship, that exist unrelated to the PMS. They are more likely to be addressed in the symptomatic phase of the PMS, due to the higher vulnerability of women, as the ability to downregulate those negative aspects in the relationship is attenuated [13]. Empirical evidence to support these assumptions is needed.
The partner’s access to information and his support seems to have an impact on symptom severity. As ali Morowatisharifabad, Karimiankakolaki, Bokaie, Fallahzadeh and Gerayllo [17] found, informing the partner regularly on PMS (e.g. via SMS), has a positive impact on the perceived marital satisfaction of both partners. Consistently, Rezaee, Mahamed and Mazaheri [18] found that educating spouses led to an increase in supportive behavior scores and to a decrease in physical and psychological-behavioral symptoms of PMS among their female partners and they conclude that training spouses has been useful in decreasing the PMS symptoms.
Men may not only be seen as a co-cause to PMS symptoms, they also seem to be extensively affected by PMS symptoms. According to a study by Cortese and Brown [19], some men show a large variety of coping strategies which reach from reminding themselves that the woman “couldn’t help it” and the phase would pass by, to gathering information related to the topic, being more helpful towards their partners, shouting and arguing, studiously avoiding to meet their partners during the symptom phase, up to taking refuge in their job or even in drinking more alcohol. The internet platform PMSbuddy.com has been a place for men, whose spouses are suffering from PMS, to exchange experience. King, Ussher and Perz [20] collected and evaluated data from this platform starting from September 2008 until February 2009 and mainly found men titling themselves as victims, declaring the experience they made in their roles as partners of PMS women as unfair, PMS often was described as something disturbing or pathological. It is however important to note, that a group of men seeking support on an online forum by other men is a highly selective group and probably more supportive and well-informed men are harder to find in such forums.
That being said, PMS in a relationship could be regarded as a shared experience, burdening the partners and influencing both of them (differently). While interview studies and gathering information are a good approach to explore different aspects of the topic in the first step, a lack of objectivity remains in these methods. Empirical data concerning the influence of PMS on both partners to date is rare.
Siegel [21] conducted a questionnaire study asking women to retrospectively state their PMS symptoms by the Menstrual Distress Questionnaire [22], the intimacy in their relationship by Waring Intimacy Questionnaire [23] and their marital satisfaction by Renne Index of Marital Satisfaction [24]. Significantly, less satisfaction and less intimacy were found in women who had higher scores in PMS Symptoms [21]. Unfortunately, data were only collected once during one menstrual cycle and only from women.
Ryser and Feinauer [25] conducted a study including data on women’s as well as on men’s marital satisfaction of 64 couples at two points in one menstrual cycle. Participants were asked to fill in questionnaires on marital satisfaction once in the follicular phase and another time in the luteal phase. Findings suggest less marital satisfaction as measured by the MAT [26] in the luteal phase for both partners in PMS relationships, compared to the controls with no PMS. There was no difference between the male’s and female’s decrease in satisfaction [25]. The method of estimating cyclic phases and points of measurement in advance merits criticism, as that way cyclic changes cannot be considered. Apart from that, measuring only at two times during the cycle cannot reflect an accurate impression of the dynamics within the relationship since it only reflects two distinct moments in one menstrual cycle. A comprehensive reflection of marital dynamics in relation to PMS symptoms is still missing.
A major weakness in all studies mentioned above, is the fact that the cyclic phases and the points of measuring data about relationship satisfaction, were estimated in advance, therefore no attention could be payed to variations during one cycle. Reliably, the phases can only be determined retrospectively.
A more accurate method of collecting data would be to follow participants throughout one whole cycle and calculate the cycle phases retrospectively and individually. Furthermore, participants in the studies mentioned were informed on the goals of the study before taking part in the study, usually the goals were defined as: analyzing the impact of PMS on the relationship. As described byGiblin [27] and Frank, Dixon and Grosz [28], solely focusing on the PMS symptoms and conjoint monitoring of symptoms by both partners can lead to an improvement of the reported marital satisfaction. The authors consider an increase in empathy, understanding and awareness of the way PMS can affect a relationship due to a conjoint monitoring as reasons for that phenomenon.
Objective
In the current study, we aimed to examine the impact of PMS on the partner relationship, for both, female and male partner. We collected daily (and weekly) data on marital satisfaction, “shared good experiences” and frequency of arguments throughout one complete woman’s cycle from both partners. According to the suggestions by Frank, Dixon and Grosz [28], we kept the initial information on the goal of the study to a minimum, so that the participants were only informed they are taking part in a study on marital dynamics. Data concerning the female cycle and the PMS symptoms were only collected at the last day of the study. Data from the partners was adjusted so they are represented according to the female’s cycle. We expect to find less satisfaction, less shared good experiences and more dispute for both partners during the symptomatic phase of the PMS compared to the symptomless phase as well as compared to a group of no PMS couples. We also expect relationships for partners with women suffering from PMS symptoms to be less satisfying, the partners to have less shared good experiences and more dispute when compared to no PMS relationships.
Method
Participants
Participants were recruited via adverts at the Regensburg University. We included couples at the minimum age of 18 years and a minimum duration of one year of relationship. The maximum age for women was 55 years, to exclude women in menopause. For the men there was no maximum age for participation. Further exclusion criteria were hormonal contraception [7], pregnancy, breastfeeding and application of psychotropics [8] to avoid any influence on the participant’s behavior and on the PMS symptoms reported. In addition, Jacobson, Christensen, Prince, Cordova and Eldridge [29] have shown that psycho- or family therapy influences satisfaction in relationships, therefore we excluded couples currently receiving therapy in order to not distort study results. As a compensation after completing the survey, the participants could receive a figure representing the statements they had given over the complete survey, students additionally were offered credit points.
Between January and April of 2016, daily invitations were sent to 160 couples / 320 participants in total, who had provided their mail addresses and consent. The invitations, including a link to each day’s questionnaire, were sent out to participants via www.soscisurvey.de for six weeks. To minimize any missing data, the link to each daily questionnaire was kept open for 2 days following, so participants could catch up on them later in case they had no possibility to do it same day. 92 couples were excluded from the study; thereof 75 couples out of which one or both partners did not finish the survey or not react to the invitations at all, 2 due to pregnancy, 1 because no regular cycle could be maintained during the survey (the stated first day of cycle was out of survey time), although, initially, women using hormonal contraception were asked not to take part in the study, in 10 couples who had taken part the women gave the information they were using hormonal contraceptives, so they were excluded also, 4 couples were excluded due to psychotherapy or application of psychotropic drugs of at least one of the partners.
From the remaining 68 couples, data for one menstrual cycle were extracted and collected in one dataset. As a reference point, the last day of the woman’s cycle was determined by using the dates for first day of the last cycle given by the women at the end of the survey. From then the preceding 28 days, as 28 days was the mean (M = 28.1, SD = 1.11) of the cycle lengths of all women in the study, were applied in the dataset. Missing data of less than two per participant, question and cycle were replaced by the mean of the data given by the day ahead and afterwards. To keep the data reliable, only couples with less than two days of missing data per participant and with a complete set of four weekly questionnaires were accepted for analysis. For that reason 19 couples with more than two sets of missing data for at least one of the partners in week two through four or more than one missing dataset for the weekly questionnaire were excluded.
Therefore, the final sample consisted of 98 participants / 49 heterosexual couples aged between 20 and 60 years (M = 39.28, SD = 10.05). 34 of the couples participating were assorted to the PMS group, 15 couples to the no PMS group according to the result of the PMS-r test completed by the female partners. The groups were very well comparable in demographic data (for more details see tables 1 and 2).
|
Table 1. Demographics
|
|
|
|
PMS n = 68
|
no PMS n = 30
|
|
M
|
SD
|
min
|
max
|
M
|
SD
|
min
|
max
|
|
Age all
|
38.84
|
9.86
|
20
|
59
|
40.27
|
10.58
|
23
|
60
|
|
Age men
|
40.56
|
10.31
|
21
|
59
|
43.6
|
11.71
|
28
|
60
|
|
Age women
|
37.12
|
9.21
|
20
|
51
|
36.93
|
8.42
|
23
|
47
|
|
Length of cycle
|
28.18
|
1.17
|
25
|
31
|
28.47
|
1.06
|
26
|
30
|
|
Relationship (years)
|
9.22
|
7.81
|
1
|
28
|
10.30
|
7.59
|
3
|
28
|
|
Note. n = Number of participants, M = Mean, SD = Standard deviation, min = minimum value max = maximum value, PMS = PMS Group, no PMS =Group without PMS. For „lenght of cycle“ n halves, as this information naturally was only given by the female participants, n also halves for the age according to sexes .
|
|
Table 2. Demograpics frequencies
|
|
|
PMS n = 68
|
|
no PMS n = 30
|
|
Percent
|
|
Absolut
|
|
Percent
|
|
Absolut
|
|
Yes
|
|
No
|
|
Yes
|
|
No
|
|
Yes
|
|
No
|
|
Yes
|
|
No
|
|
Live together
|
82
|
|
18
|
|
56
|
|
12
|
|
100
|
|
0
|
|
30
|
|
0
|
|
Children
|
56
|
|
44
|
|
38
|
|
30
|
|
57
|
|
43
|
|
17
|
|
13
|
|
Wish for children
|
44
|
|
56
|
|
30
|
|
38
|
|
47
|
|
53
|
|
14
|
|
16
|
|
Regular cycle
|
94
|
|
6
|
|
32
|
|
2
|
|
2021 Copyright OAT. All rights reserv
93
|
|
7
|
|
14
|
|
1
|
|
Note. n = Number of participants, PMS = PMS Group, no PMS =Group without PMS. For „regular cycle“ n halves, as this information naturally was only given by the female participants
|
Table 1 about here please
Table 2 about here please
Material
The experiment was conducted as a longitudinal study for six weeks sending daily invitations including links to the questionnaires every day at 6 pm via www.soscisurvey.de. Depending on the day of the week, there were daily questions, weekly questionnaires as well as one demographic questionnaire at the end of the study additionally including the PMS-r test for women, which provided information for assigning the participants either to the PMS or no PMS group.
Daily Questionnaire.
Participants were daily asked to answer the following questions on a four point Likert scale running from “very much”, “a little”, “hardly” to “not at all”.
- How satisfied were you with your relationship today?
- Did you and your partner share good experiences today?
- Did you and your partner have an argument today?
Weekly Questionnaire “ZIP”.
To backup our results on partnership satisfaction with a validated test, we asked participants weekly to fill in the German version of the "Relationship Assessment Scale [30], “Zufriedenheit in Paarbeziehungen Skala - ZIP“ [31]. ZIP is an economic instrument measuring only the one dimension of relationship satisfaction, which contains seven items answered in a seven point Likert scale with only extremes named. Items are for example: “How good is your relationship compared to most?” or “How well does your partner meet your needs?“. Participants were asked to reflect only the week gone by when answering the questionnaires. Internal consistency was satisfactory, with Cronbach’s α of .87 [32].
PMS-r. Occurrence of PMS Symptoms was assessed using the PMS-r questionnaire by Ditzen, Nussbeck, Drobnjak, Spörri, Wüest and Ehlert [33] which contains 30 items covering each of the eleven DSM symptom criteria for PMS and PMDD. Participating women were asked to reflect the past 6 months and answer the questions regarding especially the week before the onset of their period. Results of the test were used to classify the couples either to PMS or no PMS group. A validation study by the authors showed good internal consistency with Cronbach’s α of .88 and .89 and a good reliability with redesigned items, suggesting the questionnaire to be well suitable to evaluate PMS symptoms [33].
Demographics. On the last day of the survey, demographic data and information on use of psychotropic drugs and therapy were collected from the participants. The women additionally needed to provide information on contraception and their menstrual cycle. The dates provided by the women as first day of last and before last cycle were used to extract one female cycle in the dataset.
Design
The experiment was conducted as a longitudinal online study for six weeks. Invitations with links to the questionnaires were sent daily at 6 pm. Participants were asked to fill in the questionnaires same-day, if possible and separated from their partners. At the last day of the survey participants were asked to give demographic information. A repeated measures ANOVA was performed to all dependent variables using IBM SPSS Statistics for Windows, Version 22.0. The significance level was set at p = .05. The Greenhouse-Geisser correction was applied when the assumption of sphericity was violated. For the analysis of the daily questionnaires, the first six days in the cycle were not included, as there is no clear classification of symptom phase or symptom-free phase for the first week of the cycle. According to DSM-5, PMS symptoms do not immediately remit with the onset of the menses but may last until a few days after [5]. The answers given in the ZIP test were computed to a weekly total result with the value of seven showing maximum satisfaction and the value of one showing minimum satisfaction.
Results
ZIP
Results of the ZIP questionnaire were subjected to repeated-measures ANOVAs with the within-subject satisfaction according to ZIP and week of cycle and the between-subjects factor group (PMS vs no PMS group). The repeated measures ANOVA was performed separately for the male and female participants.
Figure 1 about here please.
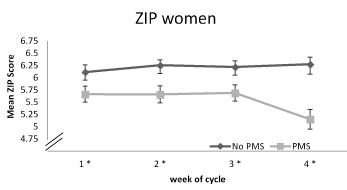
Figure 1. ZIP scores means for women for each of the weeks of the cycle grouped PMS and no PMS with a maximum of seven (maximum satisfaction) and a minimum of one (minimum satisfaction) The * shows significant t-tests. The error bar shows the standard error of mean.
Figure 2 about here please
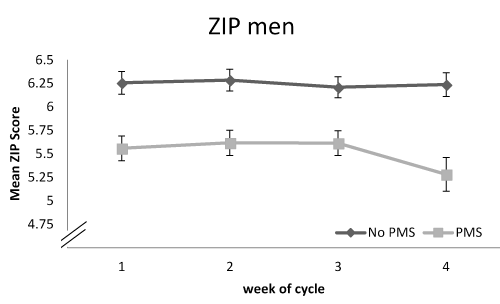
Figure 2. ZIP scores means for men for each of the weeks of the cycle grouped PMS and no PMS with a maximum of seven (maximum satisfaction) and a minimum of one (minimum satisfaction). The error bar shows the standard error of mean.
As can be seen in figure 1, the women in the PMS group showed a decrease in satisfaction in the last week of the cycle, while the satisfaction of the women in the no PMS group remained unchanged. Consistent with our first hypothesis, the interaction of group and week was significant; F (1, 47) = 5.38, p = .005, η² = .103, ε = 0.710. The follow-up t-tests (table 3) showed a significant difference between the groups with ascending effect size from week one to week four.
|
Table 3. Significant weekly t-tests for the ZIP for women
|
|
|
PMS
|
no PMS
|
|
|
|
|
|
|
M
|
SD
|
M
|
SD
|
df
|
t
|
p
|
Cohens d
|
|
ZW 1
|
5.66
|
0.94
|
6.11
|
0.58
|
41
|
2.03
|
.048
|
0.54
|
|
ZW 2
|
5.66
|
1.02
|
6.26
|
0.42
|
46
|
2.30
|
.006
|
0.69
|
|
ZW 3
|
5.69
|
0.97
|
6.22
|
0.49
|
45
|
4.52
|
.015
|
0.63
|
|
ZW 4
|
5.15
|
1.18
|
6.28
|
0.55
|
46
|
4.55
|
<.001
|
1.12
|
Note. M= Mean, SD=Standarddeviation, df =degrees of freedom, t= t-value, p = p-value, PMS=PMS Group, No PMS= Group with no PMS, Cohens d= effect size, ZW = week of cycle
Table 3 about here please
Moreover, the groups’ between subjects effect was significantly different, F (1, 47) = 6.87, p= .012, η² = 0.128. As we expected in hypothesis two, women in the PMS group showed less satisfaction throughout the complete cycle compared to no PMS women. Hypothesis two can be confirmed, as the PMS women report significantly lower satisfaction than the no PMS women throughout the complete cycle. For men, as can be seen in figure 2, we found slightly decreasing satisfaction in week four of the woman’s cycle. The interaction of time and group did not reach significance, F (1, 47) = 1.84, p = .160, η² = .038, ε = 0.743. Thus, the hypothesis one cannot be confirmed for men regarding the satisfaction measured by the ZIP questionnaire. A significant difference between groups was found, F (1, 47) = 11.90, p = .001, η² = .202, with less satisfaction throughout the complete cycle for men of women with PMS as we expected in hypothesis two.
Daily Questions
To get a more detailed view on the dynamics within the relationship, we conducted daily questionnaires asking participants to report satisfaction, shared good experiences and dispute separately for each day. The results were subjected to three repeated-measures ANOVAs with either the within-subject satisfaction, shared good experiences or dispute for days 7 to 28 of the cycle, with the between-subjects factor group (PMS vs no PMS group). The repeated measures ANOVAs were performed separately for male and female participants.
Figure 3 about here please
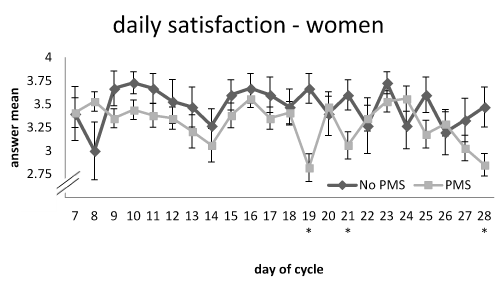
Figure 3. Answer means to the daily question „How satisfed were you with your relationship today?“ on day 7 to 28 of the cycle for women, grouped PMS and no PMS with minimum 1 (not at all) and maximum 4 (very much). The error bar shows the standard error of mean.
Figure 4 about here please
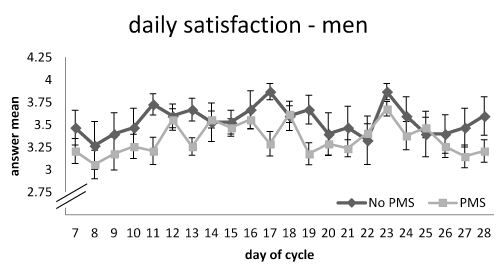
Figure 4. Answer means to the daily question „How satisfed were you with your relationship today?“ on day 7 to 28 of the cycle for men, grouped PMS and no PMSwith minimum 1 (not at all) and maximum 4 (very much). The error bar shows the standard error of mean.
Question 1: “How satisfied were you with your relationship today?“.
For the female participants, we found decreasing satisfaction towards the end of the menstrual cycle; there is a significant interaction of day and group, F (1,47) = 1.95, p = .041 , η² = .040, ε= 0.443, which also confirms the first hypothesis. The PMS group is slightly less satisfied throughout the complete cycle compared to the no PMS group, but the difference does not reach significance. Hypothesis two cannot be confirmed, F (1, 47) = 2.12, p = .152, η² = .043. As can be seen in figure 4 for the male participants, there was a slight decrease in satisfaction at the end of the cycle which did not reach significance. There was no significant interaction of day and group, F (1,47 ) = 0.76, p = .776, η² = .016, ε = 0.466. Therefore, the first hypothesis was not confirmed. As expected in hypothesis two, the male PMS group shows lower scores for satisfaction throughout the complete menstrual cycle compared to the no PMS (men) group. The between subjects effect was significant, F (1, 47) = 5.28, p = .026, η² = .101, hence hypothesis two was confirmed.
Figure 5 about here please
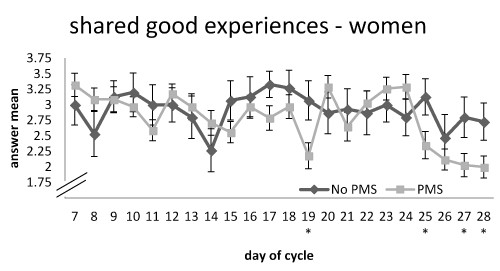
Figure 5. Answer means to the daily question „Did you have a shared good experience with your partner today?“ on day 7 to 28 of the cycle for women, grouped PMS and no PMS with minimum 1 (not at all) and maximum 4 (very much). The error bar shows the standard error of mean.
Figure 6 about here please
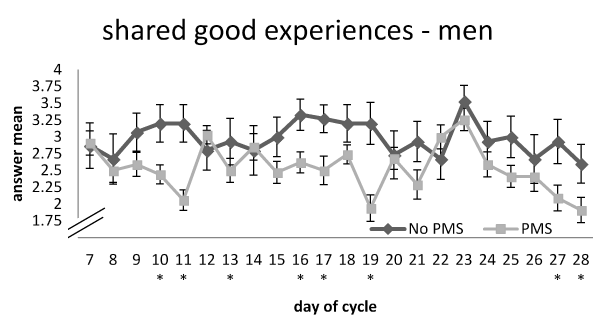
Figure 6. Answer means to the daily question „Did you have a shared good experience with your partner today?“ on day 7 to 28 of the cycle for men, grouped PMS and no PMS with minimum 1 (not at all) and maximum 4 (very much). The error bar shows the standard error of mean.
Question 2: “Did you and your partner share good experiences today?“.
As expected, PMS women showed a constant decrease in shared good experiences in the symptom phase during the last week of the cycle, the interaction between the group and the day was significant confirming hypothesis one; F (1, 47) = 2.11, p = .018, η² = .043 ε = 0.526. There was no significant difference between groups throughout the cycle, no significant between subjects factor was found; F (1, 47) = 0.61, p = .438, η² = .013. As a result, hypothesis two cannot be confirmed. As the figure 6 indicates above, men showed a decrease in shared good experiences in the last week of the cycle, there was a significant interaction of group and day, F (1, 47) = 1.94, p = .030, η² = .040, ε = 0.547. The between subjects factor was also significant with lower means for shared good experiences in the PMS group, F (1, 47) = 6.63, p = .013, η² = .124. Hence, both of the two hypotheses can be confirmed for the shared good experiences question in the male group.
Figure 7 about here please
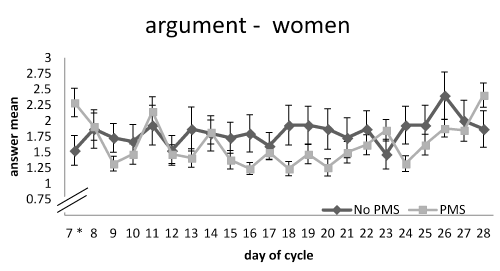
Figure 7. Answer means to the daily question „Did you have an argument with your partner today?“ on day 7 to 28 of the cycle for women, grouped PMS and no PMS with minimum 1 (not at all) and maximum 4 (very much). The error bar shows the standard error of mean.
Figure 8 about here please
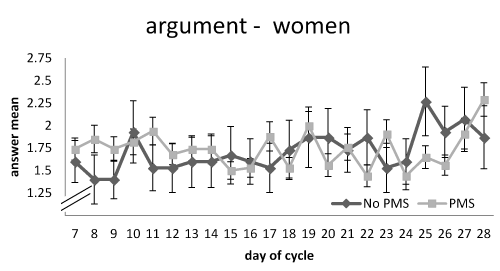
Figure 8. Answer means to the daily question „Did you have an argument with your partner today?“ on day 7 to 28 of the cycle for men, grouped PMS and no PMS with minimum 1 (not at all) and maximum 4 (very much). The error bar shows the standard error of mean.
Question 3: “Did you and your partner have an argument today?“. The reported frequency of dispute rose in the last week of the cycle for the women in the PMS group, as can be seen in figure 7. As expected in the first hypothesis, there is a significant interaction of day and group, F (1, 47) = 1.97, p = .031, η² = .040, ε = 0.507. Significant between subject effect was not found, F (1, 47) = 1.35, p = .251, η² = .028. Hypothesis two cannot be confirmed. For the men in the PMS group, the frequency of arguments seems to rise towards the end of the cycle, but no significant interaction of the day and the group was revealed, F (1,47) = 1.60 , p = .084. η² = .033, ε = 0.593. In addition, there was no significant between subjects effect, F (1, 96) = 0.02, p = .898, η² < .001. For the argument in the male group, neither of the two hypotheses can be confirmed.
Discussion
In this study, we tested the impact of PMS symptoms on satisfaction, shared good experiences and dispute in partner relationships compared to relationships where women do not suffer from PMS symptoms. This is the first study to report daily data from both female and male partners matching the phases of the menstrual cycle with given data retrospectively.
In hypothesis one, we expected partners in PMS relationships to have a decrease in satisfaction and in shared good experiences, and an increase in the occurrence of dispute during the symptomatic phase, which is the last week of the cycle. For PMS women, decreasing satisfaction in the relationship was found, as expected, in the validated ZIP test, which was used as a weekly questionnaire as well as in the daily question for satisfaction with the relationship. Furthermore, since a decrease in shared good experiences and an increase in dispute compared to no PMS relationships could be found for PMS women, the first hypothesis can be confirmed for women. Moreover, for men in PMS relationships, we found a significant decrease in shared good experiences, however, not in satisfaction in the weekly or in the daily questions and no increase in the amount of dispute. Hence, the first hypothesis for men can only be confirmed for the shared good experiences not for satisfaction or dispute. In our study, men, other than women, do not seem to be directly affected in their relationship satisfaction during the symptom phase. This goes along with studies conducted by Hassebrauck [34], finding that men and women use different characteristics to classify the quality of their relationships. Our result clearly contradicts the findings by Ryser and Feinauer [25], who found a decrease in satisfaction for both men and women in PMS relationships similarly in the luteal phase. Most likely, the fact that the participants in the Ryser et al. study were informed of the study topic, in contrast to ours, influenced their focus of attention and thus, lead to differences in their perception and the ratings of their own satisfaction, as predicted by Frank, Dixon and Grosz [28].
In hypothesis two, we expected partners in PMS relationships to report less satisfaction and shared good experiences as well as more dispute throughout the complete cycle compared to participants in no PMS relationships. For the weekly ZIP questionnaire, we found a significant difference in satisfaction for both men and women, with lower satisfaction rate in the PMS group. On the contrary to that, for the daily questions on relationship satisfaction, we found a significant difference between groups only for the male participants but not for women. The different results for the women’s PMS group concerning satisfaction may be due to the answer format. The daily questionnaires were answered on a four-point Likert scale, the weekly ones on a seven-point scale, so the graduation in the weekly questions in finer. This might explain the difference between daily and weekly results for women.
Concerning the shared good experiences, we also found a significant difference only between the groups for men. For women, there was no significant difference throughout the complete cycle. We didn’t discover a significant difference between the groups for any of the participants concerning the dispute in the relationships. Therefore, the second hypothesis can be confirmed for women for the satisfaction according to the ZIP questionnaire. For men, hypothesis two can be confirmed for shared good experiences and satisfaction according to the daily questions and the ZIP.
Remarkably, hypothesis one regarding the decrease in satisfaction and shared good experiences, can only be confirmed for women, while hypothesis two regarding the same aspects can be mainly confirmed for men. Thus, for women we found a decrease in satisfaction and shared good experiences as expected during the last week of the cycle where PMS symptoms arise, so both symptoms and their impact on the marital satisfaction appear hand in hand. We could not confirm these findings for men. But unlike for women, we found less satisfaction and shared good experiences for men in PMS relationships compared to men in no PMS relationships throughout the complete cycle.
Our findings suggest that PMS does have an impact on partner relationship, but it seems to affect both partners differently and seems to have dissimilar consequences on each partner. For women, we could conclude, as already done in past research, that the PMS symptom phase is overloaded with strains of PMS symptoms and external influence coming from their environment. Facing the general PMS symptoms, women seem to be more sensitive to the burdensome influence of the environment and consequently, they pay more attention to problems in the relationship than they would normally do. As a result, there is a remarkable decrease in satisfaction and awareness of shared good experiences during the symptomatic phase of the PMS. Men’s perception of the situation is clearly different from women’s symptomatic phase due to the lack of PMS symptoms they would suffer from. However, we conclude that the satisfaction is most likely generally reduced throughout the complete relationship compared to men in no PMS relationships. This finding would also be in line with the view by Ussher, Perz and May [13], where PMS symptoms occur more severely in less happy relationships. For men in PMS relationships, lower results in the relationship satisfaction are found throughout the complete cycle, whereas for women we found a clear decrease in satisfaction in the “more vulnerable” phase of PMS symptoms, as predicted by Ussher [15].
Of course, the perception of the relationship satisfaction may generally be different between men and women, but according to the findings of Hassebrauck [34], one would expect men to be more romantic and women to be more realistic in their perception of the relationship. The meta-analysis, conducted by Jackson, Miller, Oka and Henry [35], showed a small but significant difference between men and women in relationship satisfaction with men showing higher satisfaction compared to women. In the context of these findings, our results show a completely different perception of relationship satisfaction for men in PMS relationships compared to no PMS relationships. We could not find this effect for women and it should be investigated more precisely.
We can also conclude the different points of view and reactions between the sexes regarding PMS symptoms should be taken into account, especially in marital and family therapy. With the aid of therapy, it should be attempted to raise the sensitivity of both partners for their particular situation induced by PMS. Reciprocal understanding for the resulting problem should be raised. Thereby men in relationships with PMS are less satisfied throughout the whole cycle than men in relationships without PMS, it should be focussed to augment their content. Therefore, an appropriation of explanations for the female behavior is needed as well as coping strategies for the handling of.
Another remarkable finding is the extraordinarily low means for satisfaction and shared good experiences on the day 19 of the cycle in the PMS group. In our study, we could not find a proper explanation for this finding. It should clearly be a subject of further investigation in the future.
A weakness of the study might be the classification of participants into PMS and no PMS group, as it is, like also in the empirical studies described before, based on a subjective rating of the female participants and not on a clinical diagnosis of PMS. Namely, the test we used states to be applicable and well validated for a rating the way we used it. Nevertheless, we advise reproducing these findings in a diagnosed sample of participants. Regarding the ratio of our group sizes compared to general population figures, an imbalance between the groups can be found. In contrast to the usually estimated proportion of 25% of women suffering from PMS symptoms [1], a PMS rate of 70% was found in our sample. This may be due to the sample or also due to the classification tool being probably too sensitive.
Of course there may also have been other or external influences on the relationship satisfaction which we could not identify in our study. Although the participants were asked to report special circumstances or events during the survey only very little made use of that opportunity, so we did not get useful information on additional influences on the relationship.
Conclusion
This longitudinal study was the first to collect data on relationship satisfaction and shared good experiences daily and weekly from both partners, adjusting them retrospectively to the different phases of the menstrual cycle and thus find the influence of the women’s PMS on the relationship compared to no PMS couples. We could show that PMS is a shared experience influencing both partners in different ways. While women in PMS relationships report less satisfaction during the symptomatic phase, men seem to be less satisfied throughout the complete cycle compared to no PMS men. For the shared good experiences, we found similar results with women showing lower means in the last week of their cycle and men showing lower means compared to men in no PMS relationships throughout the complete cycle. This finding should especially be considered in family therapy, as it seems that females and males experience qualitatively different effects of PMS at different time points of the cycle.
References
- Stute P, Kiesel L (2008) Prämenstruelles Syndrom, Gynäkologische Endokrinologie, 6: 241-248.
- Kapur N (2016) Premenstrual Symptoms and Social Disability, International Journal of Innovative Knowledge Concepts, 2: 8-13.
- Tschudin S, Bertea PC, Zemp E (2010) Prevalence and predictors of premenstrual syndrome and premenstrual dysphoric disorder in a population-based sample, Arch Womens Ment Health., 13: 485-494. [Crossref]
- Wittchen H -U, Becker E, Lieb R, Krause P (2002) Prevalence, incidence and stability of premenstrual dysphoric disorder in the community, Psychol Med, 32: 119-132. [Crossref]
- American Psychiatric Association, Diagnostic and statistical manual of mental disorders (5th ed.), Washington, DC, (2013).
- American Psychiatric Association, Diagnostic and statistical manual of mental disorders (4th ed., Text Revision), Washington, DC, 2000.
- Lopez LM, Kaptein AA, Helmerhorst FM (2009) Oral contraceptives containing drospirenone for premenstrual syndrome, Cochrane Database Syst Rev. 2: CD006586. [Crossref]
- Moline ML (1993) Pharmacologic strategies for managing premenstrual syndrome, Clin Pharm, 12: 181-196. [Crossref]
- Brown J, O'Brien PMS, Marjoribanks J, Wyatt K, Selective serotonin reuptake inhibitors for premenstrual syndrome, Cochrane Database Syst Rev. 2: CD001396.
- Blake F, Salkovskis P, Gath D, Day A, Garrod A (1998) Cognitive therapy for premenstrual syndrome: a controlled trial, J Psychosom Res, 45: 307-318. [Crossref]
- Borenstein J, Chiou CF, Dean B, Wong J, Wade S (2005) Estimating direct and indirect costs of premenstrual syndrome, J Occup Environ Med. 47: 26-33. [Crossref]
- Dennerstein L, Lehert P, Bäckström TC, Heinemann K (2010) The effect of premenstrual symptoms on activities of daily life. Fertil Steril 94: 1059-1064. [Crossref]
- Ussher JM, Perz J, May E, Pathology or source of power? The construction and experience of premenstrual syndrome within two contrasting cases, Feminism & Psychology, 24: 332-351.
- Coughlin PC, Premenstrual syndrome: How marital satisfaction and role choice affect symptom severity, Social Work, 35: 351-355.
- Ussher JM (2003) The ongoing silencing of women in families: an analysis and rethinking of premenstrual syndrome and therapy, Journal of Family Therapy, 25: 388-405.
- Ussher JM, Perz J, PMS as a gendered illness linked to the construction and relational experience of hetero-femininity, Sex Roles, 68: 132-150.
- Morowatisharifabad MA, Karimiankakolaki Z, Bokaie M, Fallahzadeh H, Gerayllo S (2014) The effects of training married men about premenstrual syndrome by pamphlets and short messages on marital satisfaction, Health Educ Res, 29: 1005–1014. [Crossref]
- Rezaee H, Mahamed F, Amidi Mazaheri M (2015) Does Spousal Support Can Decrease Women’s Premenstrual Syndrome Symptoms? Glob J Health Sci, 8: 19–26. [Crossref]
- J. Cortese, M.A. Brown, Coping responses of men whose partners experience premenstrual symptomatology, J Obstet Gynecol Neonatal Nurs., 18 (1989) 405-412. [Crossref]
- King M, Ussher JM, Perz J (2014) Representations of PMS and premenstrual women in men's accounts: An analysis of online posts from PMSBuddy. com, Women's Reproductive Health, 1: 3-20.
- Siegel JP (1986) Premenstrual Syndrome and Marital Dynamics.
- Moos RH (1977) Menstrual distress questionnaire manual, Stanford Univ., Department of Psychiatry and Behavioral Sciences.
- Waring EM, Reddon JR (1983) The measurement of intimacy in marriage: The Waring Intimacy Questionnaire, J Clin Psychol, 39: 53-57. [Crossref]
- Renne KS (1970) Correlates of dissatisfaction in marriage. J Marriage Fam. 54-67.
- Ryser R, Feinauer LL (1992) Premenstrual syndrome and the marital relationship, Am J Fam Ther, 20: 179-190.
- Locke, Wallace KM (1959) Short marital-adjustment and prediction tests: Their reliability and validity, Marriage and Family Living, 21: 251-255.
- Giblin P (1994) Marital satisfaction, The Family Journal, 2: 48-50.
- Frank B, Dixon DN, Grosz HJ (1993) Conjoint monitoring of symptoms of premenstrual syndrome: Impact on marital satisfaction, J Couns Psychol, 40: 109-114.
- Jacobson NS, Christensen A, Prince SE, Cordova J, Eldridge K (2000) Integrative behavioral couple therapy: an acceptance-based, promising new treatment for couple discord, J Consult Clin Psychol, 68: 351-355. [Crossref]
- Hendrick SS, (1988) A generic measure of relationship satisfaction, J Marriage Fam 93-98.
- Hassebrauck M, (1991) ZIP–Ein Instrumentarium zur Erfassung der Zufriedenheit in Paarbeziehungen, Zeitschrift für Sozialpsychologie, 22: 256-259.
- Richter D, Brähler E, Ernst J (2015) Diagnostische Verfahren für Beratung und Therapie von Paaren und Familien, Hogrefe, Göttingen.
- Ditzen B, Nussbeck F, Drobnjak S, Spörri C, Wüest D, et al. (2011) Validierung eines deutschsprachigen DSM-IV-TR basierten Fragebogens zum prämenstruellen Syndrom, Zeitschrift für Klinische Psychologie und Psychotherapie, 40: 149-159.
- Hassebrauck M (2003) Romantische Männer und realistische Frauen: Geschlechtsunterschiede in Beziehungskognitionen, Zeitschrift für Sozialpsychologie, 34: 25-35.
- Jackson JB, Miller RB, Oka M, Henry RG (2014) Gender differences in marital satisfaction: A meta-analysis, J Marriage Fam, 76: 105-129.


