Background: Abnormalities in heart rate variability analysis (HRV) have been found in patients with postural orthostatic stress syndrome (POTS), indicating impaired autonomic function. We screened HRV in children in a 5-minute active standing test.
Methods: 48 of nearly 500 (9.6%) screened children had a heart rate increase of more than 35 bpm on average in the first 5 minutes active standing test. These data are compared to well-defined indication groups: Healthy controls (N=47), Anorexia Nervosa (N=43), Obesity (N=52) and operated Congenital Heart Disease (N=38). 150 patients have additional 24-hours Holter ECG.
Results: We found nearly no differences of supine and 24-hours heart rate and HRV between POTS patients and the healthy controls. However, there is a collapse of the vagus in the standing position indicated by a highly significant decrease of the HRV parameters RMSSD, pNN50, pNN20, High Frequency Power and the increase of the LF to HF ratio. Linear regression analysis show the significant impact of the patients height on the heart rate increase (T=5.9, p<0.0001) and an inverse impact of the body mass index (T= (-)2.33, p=0.021).
Conclusion: We uncover the probably most important point of POTS physiology – the collapse of the vagus in the standing position. We identify the high-risk POTS patients – the tall lean teenagers and children with G-protein coupled receptor autoantibodies.
Postural tachycardia syndrome (POTS), inappropriate sinus tachycardia (IST) and vasovagal syncope are common diseases of the autonomic nervous system in children and adults. Working criteria for diagnoses and recommendations on their assessment and management were published in a 2015 paper entitled “Heart Rhythm Society Consensus Statement on the Diagnosis and Treatment of Postural Tachycardia Syndrome, Inappropriate Sinus Tachycardia, and Vasovagal Syncope” [1]. Representatives of the Paediatric and Congenital Electrophysiology Society were engaged in this paper; however, the incidence, diagnostic criteria, and pharmacotherapy in children remain ill-defined. Most patients develop the first clinical symptoms as adolescents during maturation of their autonomic nervous system. Hence adolescence appears to be a vulnerable phase in the development of these diseases and offers a potential window of opportunity for therapeutic interventions.
Over the last 20 years, we have used Holter ECG monitoring as a diagnostic tool to analyse autonomic dysfunction and monitor pharmacotherapy in childhood. Recently, we published our analysis of 479 children who had a Holter ECG within the last 15 years with respect of the diagnosis and therapy of an inappropriate sinus tachycardia in PlosOne [in press].
Within the last three years we realize that some children, most of all with psychosomatic disease, seems to have autonomic dysfunction but HRV analysis in the 24-hours Holter ECG shows normal values. We anticipate a postural tachycardia syndrome and include for screening a 5-minute active standing test with continuous heart rate registration for HRV analysis in our diagnostics. The active standing test and head-up tilt test are comparable methods for the assessment of the postural orthostatic tachycardia syndrome [2]. However, the definition of postural orthostatic tachycardia syndrome with an orthostatic heart increment of at least 30 bpm of active standing in adults or 40 bpm in adolescents has many methodological limitations [3].
Patients
For the current analysis we extract the data of in summary 500 children of the paediatric department of the Caritas Hospital in Bad Mergentheim who had at least one active standing test within the last three years. 48 of these patients had a heart rate increment of more than 35 bpm on average within 5 minutes active standing (mean age = 14.9 ± 2.1). We further include 43 adolescents with anorexia nervosa, who were hospitalized for nutritional refeeding (mean age = 15.8 ± 2.0), 52 adolescents with obesity with a BMI > 96% (mean age = 12.8 ± 3.2) and 38 adolescents with operated congenital heart defects from our outpatient clinic (mean age = 14.2 ± 5.7). The healthy control group included 47 heathy adolescents (mean age = 14.2 ± 3.8 years) with normal body mass index and without any somatic or psychosomatic diseases.
In some patients we collect blood sample for G-protein coupled receptor autoantibodies (https://www.celltrend.de/) that was not covered by the general health insurance (N=5),
The author ensure that the work described has been carried out in accordance with “The Code of Ethics of the World Medical Association (Declaration of Helsinki”) for experiments involving humans. Informed consent was obtained for the active standing test in all patients and the off-label use of pharmacotherapy with ivabradine for the postural orthostatic tachycardia syndrome.
Active standing test
All adolescents had at least one active standing test with continuous measurement of heart rate during 5 minutes in supine position and five minutes during active standing. We perform blood pressure measurement in the supine position.
HRV
Measurement and interpretation of HRV parameters in the current sample were standardized according to the Task Force Guidelines [4].
• Short time HRV analysis was performed using the HRV Scanner™ (BioSign GmbH, Germany) at two time periods: 1) Supine position. 2) 5 minutes active standing. HRV-measurements are based on the RR intervals of normal QRS complexes (NN intervals) of the two 5 minutes intervals.
• 24-hours HRV analysis: Cardiac autonomic functioning was measured by 24-h Holter 12-bit digital ECG (Reynolds Pathfinder II, Spacelabs, Germany; 1024 scans/sec). Day- and night-time periods were defined according to patient protocols. All Holter recordings were reviewed by the same experienced cardiologists and were edited to validate the system’s QRS labelling. Measures of HRV were calculated employing only NN intervals. QRS-complexes classified as noise were excluded from the data. A minimum of 23 h of analysable data and minimum of 95% of analysable NN intervals were required for data to be included. For time domain measures, mean NN interval, resulting heart rate, and HRV parameters outlined below were calculated.
Time domain HRV
• Average heart rates in beats per minute = mean heart rates of each 5-minute interval
• SDNN in milliseconds = Standard deviation of NN; reflects general variability of heart rate influenced by the autonomic nervous system but also endocrine and thermoregulatory mechanisms
• pNN50, pNN20 in percent = Percent of NN intervals which differ more than 50/20 ms from the prior interval; reflects mainly the parasympathetic influence
• rMSSD in milliseconds = Root mean square of differences between successive NN intervals; reflects mainly the parasympathetic influence
Stress index
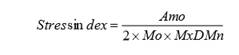
Mo = Modal value, most common value of the RR intervals; Amo = number of RR intervals corresponding to the mode as a percentage of the total number of all readings; MxDMn = variability width, difference between the maximum and minimum RR intervals.
The stress index is calculated based on Prof. Baevsky, who had developed and validated this parameter in the context of Russian space medicine. The stress index is becoming increasingly popular because it reacts sensitively to shifts in the vegetative balance between the sympathetic and parasympathetic nerves.
Frequency domain HRV
The Fourier transformation shows that HRV- signals are concentrated into four different frequency bands:
• Very low frequency power (VLF= 0,00 - 0,04Hz) in ms2 – uncertain physiological meaning
• Low-frequency power (LF=0,04 - 0,15Hz) in ms2 – mediated by sympathetic tone, however interpretation controversial, may represent both sympathetic and parasympathetic activity
• High-frequency power (HF=0,15 - 0,4Hz) in ms2 – ‘sinus arrhythmia’, mediated by alternating levels of parasympathetic tone
• LF/HF ratio - Often referred to as the balance between sympathetic and parasympathetic tone.
• Total power (TP) in ms2 – measures the total variance in HRV
Statistics
All analyses were performed using IBM SPSS Statistics software, (IBM Corp. IBM SPSS Statistics for Windows, Version 26.0, Armonk, NY, USA). For descriptive statistics data were expressed as mean ± standard deviation. As most variables exhibited a normal distribution, between-group differences were assessed using parametric statistics. The study population was divided into four diagnosis groups and one healthy control group. One-way analysis of variance was used to compare the differences between the healthy control group and the patient groups (Tables 1 and 2). We analysed the HRV parameters of each 5-minute segment in supine position, during active standing and 24-hours Holter ECG in the patients groups compared to the healthy control group. Secondly, we performed a bivariate Pearson correlation analysis between the anthropometric data and HRV indices. Significant group differences were anticipated if the p-value was < 0.05. Data with significant bivariate correlations were used for linear regression analysis (Table 5).
Table 1. Anthroprometric data and blood pressure in patient groups
|
Healthy control |
Postural orthostatic stress syndrome |
Anorexia nervosa |
Obesity |
Congenital heart disease |
|
47 |
48 |
43 |
52 |
38 |
Age
[Years] |
14.2 ± 3.8 |
14.9 ± 2.1 |
15.8 ± 2.0 |
12.8 ± 3.2 |
14.2 ± 5.7 |
Height [cm] |
160.1 ± 14.2 |
167.5 ± 10.6** |
164.8 ± 8.7 |
156.8 ± 15.4 |
149.9 ± 20.8* |
Weight [kg] |
52.6 ± 14.3 |
54.0 ± 12.4 |
42.2 ± 8.3 |
77.0 ± 25.6*** |
47.6 ± 25.6 |
BMI [kg/sqm] |
20.1 ± 3.0 |
19.1 ± 3.5 |
15.4 ± 1.9** |
30.6 ± 7.3*** |
20.2 ± 9.8 |
Sys. BP [mmHg] |
114.5 ± 9.2 |
117.2 ± 9.3 |
107.0 ± 14.2 |
126.2 ± 16.1*** |
110.6 ± 15.2 |
Diast. BP [mmHg] |
61.7 ± 11.2 |
64.9 ± 12.2 |
68.4 ± 11.1 |
63.9 ± 11.8 |
56.8 ± 10.6 |
T-test between healthy control and patient groups: * P-value < 0.05; ** P-value < 0.01; *** P-value < 0.001
Table 2. Heart Rate and HRV during active standing test and 24-hours Holter ECG
| |
Healthy control |
POTS |
Anorexia nervosa |
Obesity |
Congenital heart disease |
Patients |
47 |
48 |
43 |
52 |
38 |
|
24-hours Holter ECG (N=150) |
24h mean HR |
80.8 ± 13.5 |
78.5 ± 9.9 |
68.6 ± 12.9** |
87.5 ± 8.8 |
80.5 ± 11.9 |
Night HR |
64.8 ± 11.4 |
60.0 ± 6.9 |
55.1 ± 11.4 |
74.5 ± 8.2 |
68.2 ± 12.3 |
Min HR |
51.7 ± 8.8 |
50.9 ± 7.1 |
42.2 ± 12.2 |
58.8 ± 7.3 |
54.7 ± 10.8 |
Day HR |
84.5 ± 13.7 |
86.5 ± 11.0 |
75.6 ± 13.8 |
96.8 ± 11.3 |
88.8 ± 11.9 |
Max HR |
158.4 ± 29.3 |
164.4 ± 21.0 |
160.6 ± 27.5 |
160.1 ± 16.5 |
148.3 ± 28.2 |
SDNN |
164.7 ± 45.4 |
184.5 ± 42.2 |
218.5 ± 81.6** |
138.4 ± 31.5 |
155.2 ± 55.7 |
rMSSD |
48.8 ± 15.8 |
47.2 ± 19.7 |
64.6 ± 27.9 |
36.3 ± 10.6 |
41.6 ± 16.3 |
|
Active standing test |
HR Increase |
16.2 ± 7.1 |
43.5 ± 8.6*** |
26.2 ± 15.5*** |
18.7 ± 9.2 |
12.2 ± 8.1 |
Lying HR |
73.6 ± 12.5 |
72.0 ± 11.1 |
63.1 ± 14.7** |
82.6 ± 12.4** |
72.5 ± 13.5 |
Standing HR |
89.8 ± 13.2 |
115.3 ± 15.4*** |
89.2 ± 25.2 |
101.2 ± 12.7** |
84.7 ± 13.3 |
rMSSD
Lying |
85.1 ± 56.2 |
67.1 ± 42.6 |
92.4 ± 55.4 |
52.6 ± 39.2** |
84.8 ± 54.4 |
rMSSD Standing |
40.4 ± 22.7 |
15.7 ± 8.1*** |
41.8 ± 31.6 |
29.4 ± 23.1 |
58.3 ± 45.9* |
pNN50 Lying |
43.3 ± 22.8 |
38.7 ± 24.7 |
48.1 ± 25.6 |
24.0 ± 21.1*** |
38.5 ± 25.3 |
pNN50 Standing |
15.7 ± 14.3 |
2.8 ± 7.1*** |
16.0 ± 17.5 |
6.9 ± 9.4* |
19.9 ± 22.7 |
Stress Index Lying |
97.8 ± 85.1 |
113.3 ± 106.8 |
98.5 ± 107.3 |
162.1 ± 125.9 |
179.8 ± 303.0 |
Stress Index Standing |
168.5 ± 116.5 |
568.0 ± 438.2*** |
330.7 ± 437.8 |
285.6 ± 179.4 |
239.4 ± 339.0 |
HF Power Lying |
2920 ± 4403 |
2229 ± 4238 |
2830 ± 2776 |
1700 ± 4141 |
2473 ± 3066 |
HF Power Standing |
949 ± 1222 |
111 ± 115*** |
791 ± 979 |
412 ± 510 |
1127 ± 1615 |
LF Power
Lying |
1518 ± 2795 |
1381 ± 1705 |
1459 ± 1401 |
879 ± 689 |
1729 ± 2802 |
LF Power Standing |
1331 ± 1115 |
558 ± 628*** |
1028 ± 1131 |
848 ± 559 |
1168 ± 1251 |
VLF Power Lying |
1553 ± 2182 |
1123 ± 1820 |
1878 ± 5152 |
978 ± 865 |
1460 ± 1570 |
VLF Power Standing |
1299± 1506 |
451 ± 432*** |
1289 ± 2038 |
784 ± 872 |
937 ± 994 |
Total Power Lying |
5819 ± 6203 |
4718 ± 6273 |
6172 ± 7426 |
3523 ± 4827 |
5664 ± 6348 |
Total Power Standing |
3579 ± 3012 |
1116 ± 967*** |
3108 ± 3629 |
2046 ± 1605 |
3232 ± 3493 |
LF/HF
Lying |
0.97 ± 1.10 |
1.65 ± 3.68 |
0.8 ± 0.7 |
1.5 ± 1.3 |
0.9 ± 0.6 |
LF/HF Standing |
2.54 ± 1.95 |
7.40 ± 8.42*** |
2.7 ± 3.1 |
3.7 ± 2.6 |
2.4 ± 2.7 |
HR: Heart Rate; SDNN: Standard deviation of all NN intervals; RMSSD: The square root of the mean of the sum of the squares of differences between adjacent NN intervals; pNN50: Percent of NN intervals which differ more than 50 ms from the prior interval; TP: Total Power VLF: Very low frequency power; LF: Low frequency power HF: High frequency power; HF/LF: Ratio HF to LF
T-test between healthy control and patient groups: * P-value < 0.05; b**P-value < 0.01; *** P-value < 0.001
Clinical data are shown in table 1. 48 children (23 boys/25 girls) had a heart rate increase of 35 bpm on average that indicates POTS. We routinely perform an active standing test in patients with Anorexia Nervosa (N=43, 11 with additional POTS), Obesity (N=52) and operated congenital heart defects (N=38). Further 47 patients are included as healthy control without any signs of a somatic or psychosomatic disease.
The age is not significant different between the patient groups and the healthy control (Table 1). Body weight and body mass index are highly significantly different between in children with anorexia nervosa and obesity as expected by the diagnosis. Children with POTS have a significantly higher height (167.5 ± 10.6 cm, Figure 1) compared to the healthy control group (160.1 ± 14.2 cm, p=0.005). The heights of patients with operated congenital heart disease are slightly reduced on average (149.9 ± 20.8 cm). Obese children have significantly enhanced systolic blood pressures (126.2 ± 16.1 mmHg) but normal diastolic blood pressures.
Figure 1: Heart rate increase during active standing test and patients height
As shown in table 2, 150 children had an additional 24-hour Holter ECG showing the well-established results in children with Anorexia nervosa, who had lower heart rates and higher heart rate variability (5). However, 24-hours HRV analysis showed nearly the same heart rates and HRV in 48 children with POTS compared to the healthy control group.
However, by definition the heart rate increase while 5 minutes standing in children with POTS with 43.5 ± 8.6 bpm was significantly higher compared to healthy controls with 16.2 ± 7.1 bpm. This increase depends on significantly higher heart rates while standing but the supine heart rate and HRV were not significantly different. Our HRV data clearly indicate that the heart rate increase while standing in children with POTS depends on a collapse of the vagus with significantly lower rMSSD, pNN50 and HF-Power values. This result is supported by the significant increase of the LF to HF power ratio from 1.6 ± 3.7 to 7.4 ± 8.4 in children with POTS (Figure 2). These results are paralleled with significant increase of the Stress Index from 113 ± 107 to 568 ± 438.
Figure 2: Spectral Power Analysis of HRV during the active standing test
Children with anorexia nervosa had a significantly higher heart rate increase while standing (26.2 ± 15.5 bpm) that depends on the lower supine heart rate but not on the normal heart rate while 5 minutes active standing. Obese children had significantly elevated supine heart rates as well as elevated heart rates while standing that probably depends on a reduced supine vagus activity indicated by significantly lower rMSSD and pNN50 values. To our surprise, children with operated congenital heart disease had normal supine heart rates and HRV as well as standing heart rates and HRV except a slightly lower rMSSD value while standing.
Using bivariate correlation analysis (table 3), we found a significant Pearson correlation of the heart rate increase in the active standing test of 218 children to patient’s height (r=0.355*, p<0,001). The plot of patients heights and heart rate increases while standing (Figure 1) clearly show, that POTS is problem in patients with heights > 140cm but none of the children with a height below 140 cm had a heart rate increase > 20bpm.
Table 3: Bivariate correlations of the heart rate increase in the active standing test
Bivariate Correlations |
Blood Pressure
(N=207) |
Body Measurements
(N=218) |
24-hours Holter ECG
(N=150) |
|
Systolic BP |
Diastolic BP |
Age |
Height |
Weight |
BMI |
Mean HR |
HR Day |
HR Night |
SDNN |
RMSSD |
HR Increase
p-value |
0,077 |
0,098 |
0,114 |
,355** |
0,092 |
-0,058 |
-0,048 |
0,01 |
-0,17 |
,194* |
-0,007 |
0,268 |
0,161 |
0,095 |
0 |
0,176 |
0,397 |
0,562 |
0,921 |
0,077 |
0,017 |
0,932 |
|
HRV Analysis: Active Standing Test (Supine) |
N=218 |
Heart Rate |
SDNN |
PNN50 |
PNN20 |
RMSSD |
Stress
Index |
HF - Power |
LF -Power |
VLF -Power |
Total Power |
LF/HF Ratio |
HR Increase
p-value |
-0,067 |
0,084 |
-0,001 |
-0,029 |
-0,096 |
-0,059 |
-0,005 |
-0,051 |
-0,058 |
-0,045 |
0,127 |
0,32 |
0,207 |
0,984 |
0,66 |
0,152 |
0,379 |
0,939 |
0,443 |
0,385 |
0,5 |
0,057 |
|
HRV Analysis: Active Standing Test (Standing) |
HR Increase
p-value |
,697** |
-,141* |
-,448** |
-,611** |
-,445** |
,566** |
-,338** |
-,285** |
-,222** |
-,330** |
,417** |
0 |
0,034 |
0 |
0 |
0 |
0 |
0 |
0 |
0,001 |
0 |
0 |
HR= Heart rate; ECG= Electrocardiogram; BP= Blood pressure; BMI= Body mass Index SDNN: Global heart rate variability; RMSSD: Vagus activity Pearson Correlation coefficients: * P-value < 0.05; ** P-value < 0.01; *** P-value < 0.001
None of the supine HRV parameters showed a significant correlation with the heart rate increase while standing. However, as expected from the one way ANOVA (table 2), the heart rate increase while standing significantly correlate with the vagus parameters rMSSD (r=0.445**, p<0.0001), pNN50 (r=0.448**, p<0.001), HF-Power (r=0.338*, p<0.0001) and LF to HF ratio (r=0.417**, p<0.0001).
Linear regression analysis (Table 4) shows the significant impact of the patients’ height on the heart rate increase (T=5.9, p<0.001). This model with R2 =0.336 indicates that the BMI have a significant inverse impact on the heart rate increase (T=-2.3, p=0.021). Furthermore, the mean 24-hours heart rate (T=2.6, 0=0.01) and global HRV indicated by the SDNN (T=2.6, p=0.011) have a significant impact on the heart rate increase while standing. However, Sex, Systolic Blood Pressure, Age and the mean 24-hours rMSSD seems to have no impact on the heart rate increase while standing.
Table 4: Linear Regression Analysis: Heart Rate Increase during the active standing test
Model: R2=0.336
based on Sex, Height, BMI, Age, 24-hours Heart Rate, - SDNN and - RMSSD |
Unstandardized Coefficients |
Standardized Coefficients |
T |
Sig. |
B |
Std.-Error |
Beta |
1 |
(Konstante) |
-103,205 |
23,391 |
|
-4,412 |
,000 |
Sex |
,516 |
2,098 |
,018 |
,246 |
,806 |
Syst Blood Pressure |
,026 |
,083 |
,026 |
,309 |
,758 |
Age |
-,714 |
,473 |
-,194 |
-1,511 |
,133 |
Height |
,591 |
,100 |
,691 |
5,909 |
,000 |
Body Mass Index |
-,345 |
,148 |
-,202 |
-2,326 |
,021 |
Heart Rate |
,433 |
,167 |
,378 |
2,596 |
,010 |
SDNN |
,080 |
,031 |
,314 |
2,564 |
,011 |
RMSSD |
-,036 |
,086 |
-,052 |
-,422 |
,674 |
Dependent variable: Heart rate increase during the active standing test
Recently an online, community-based, cross-sectional survey in partnership between academic institutions and “Dysautonomia International”, a patient advocacy organization, had shown lengthy delays (24 months; 6-72 months) and misdiagnosis of POTS [6]. Most patients develop the first clinical symptoms as adolescents during maturation of their autonomic nervous system but unfortunately the POTS is nearly never diagnosed by paediatricians. In this survey patients present with a myriad of symptoms most commonly including light-headedness (99%), tachycardia (97%), presyncope (94%), headache (94%) and difficulty concentrating (94%). Others report about gastrointestinal symptoms like nausea (90%), stomach pains (83%), bloating (79%), constipation (71%) or diarrhoea (69%) [7]. Our data should improve the diagnostic view of the paediatrician on POTS that have a high impact on quality of life.
However, W Singer et al. report about methodological insecurities in the definition of postural orthostatic tachycardia syndrome based upon the orthostatic heart increment of at least 30 bpm of active standing in adults or 40 bpm in adolescents [3]. That is the reason because we decide for a continuous heart rate measurement during a 5-minute active standing test (5 minutes supine position, 5 minutes active standing) together with a short time HRV analysis.
Based upon this simple method, we are able to screen many children on POTS and now publish our results: 48 of nearly 500 (9.6%) screened children had a heart rate increase of more than 35 bpm in the first 5 minutes active standing. These data are compared to well-defined indication groups: Healthy controls (N=47), Anorexia Nervosa (N=43), Obesity (N=52) and operated Congenital Heart Disease (N=38). All other children with this screening test of cause syncope, orthostatic hypotension, palpitations and psychosomatic diseases who had no POTS are excluded for this analysis. As shown in table 1, the patient groups had a comparable age and the anthropometric data had a wide range and are clearly separated of cause the group definitions. A recent meta-analysis published by Swai J et al. [8] indicates higher heart rates and lower HRV in POTS patients. In accordance with these data our regression analysis shows higher 24-hours heart rates in the linear regression analysis (T=2,6, p=0.01, table 4). However, by in including patients with anorexia nervosa, our analysis found a higher global HRV in POTS patients, indicated by the 24-hours SDNN (T=2.6, p=0.11). The heart rate and HRV in the supine position don’t correlate with the heart rate increase (table 3). In summary, 24-hours Holter ECG as well as a short baseline HRV in the lying position are not helpful to diagnose POTS but the HRV analysis in an active standing test.
The most significant finding of our analysis is the highly decreased HRV data in the standing position (table 3). These high significant decreases of the HRV parameters RMSSD, pNN50, pNN20, High Frequency Power and the increase of the LF to HF ratio (table 2) indicate the collapse of the vagus in the standing position - probably the most important point of POTS physiology.
The heart rate increments while standing in the current study are related to the stress index, which is not measured in our former 24 hours HRV analysis. Prof. Baevsky had developed and validated the stress index in the context of Russian space medicine to estimate the clinical symptoms of astronauts by gravitational forces. Interestingly, some patients achieve levels of astronauts during the start of a shuttle (up to 3500 Pt.). However, the stress index shows an exponential increase and a very high standard deviation.
By including this wide range of body mass indices our data clearly support the recently published data from J Lin et al. [9], who show that the body mass index is decreased in children with POTS. Accordingly, we found a high incidence of POTS in children with anorexia nervosa (11 from 43 patients, 25%), as recently published [10].
Moreover, bivariate correlations as well as linear regression analysis show that children’s heights have the most important impact on the heart rate increase while standing (Figure 1). These results now statistically confirm the physical law that the hydrostatic pressure in the lower part of the body while standing depends on height as well as the clinical observations that the POTS problems increase in adolescence during the prepubertal growth spurt. We are now able to identify the high-risk POTS patients – the tall lean teenagers. Furthermore, we understand their problem – the vagus collapse while standing and their immanent need to lie down whenever possible. The good message is that we can help them and they primary don’t need a psychiatrist but a successful treatment of their POTS with lifestyle advices and/or pharmacotherapy.
In contrast, we observe no POTS in obese children, who suffer from other problems if the heart rates are high while lying and standing (Table 2) and the blood pressures are significantly increased (Table 1). Together with the reduced HRV in the lying position (Table 2) these data indicate the enhanced cardiovascular risk in obese children.
We recently analysed the impact of physical activity on heart rate increase in our patients with anorexia nervosa and found the highest values in patients who perform less than 2 hours sports per week [10]. Our data confirms a variety of studies that assess the POTS as a result of physical inactivity [11]. We had already removed the frequently practiced ban on sports from our treatment protocol of anorexia nervosa at an early stage [12-14]. However, more than 5 hours sports week did not further improve the heart rate increases but may have a negative impact on weight gain [15].
Gastrointestinal symptoms like nausea (90%), stomach pains (83%), bloating (79%), constipation (71%) or diarrhea (69%) are frequent in POTS patients (7). This may be a primer for caloric restriction in the tall lean teenager – the high-risk POTS patient in our analysis. The misdiagnosis of an anorexia nervosa in such patients with a low body mass index seems to be a disaster that could be prevented by proper diagnostics using HRV analysis.
Five of our POTS patients had positive autoantibodies [16]: α-1-adrenergic- (N=4) , α-2-adrenergic- (N=2), anti-muscarinic cholinergic receptor1- (N=1), anti-muscarinic cholinergic receptor3- (N=2), anti-muscarinic cholinergic receptor4- (N=3), anti-angiotensin receptor-, anti-endothelin receptor-, and anti-β-1/2- autoantibodies. Autoimmunity probably plays an important role in patients with so-called chronic Lyme disease (Figure 3) [17] and Emery-Dreifuss muscular dystrophy [18]. One girl with Emery-Dreifuss muscular dystrophy - a hereditary muscular dystrophy syndrome caused by deficiency of genes encoding nuclear envelope proteins – had 9 positives of 11 tested autoantibodies. These Patients show the triad of muscle dystrophy, joint contracture, and cardiac disease. In almost all patients, cardiac involvement is prevalent and is the most severe aspect of Emery-Dreifuss muscular dystrophy. Autoantibodies against cardiac proteins may be potentially involved in the pathogenesis of different heart disease and in the occurrence of unexplained sudden cardiac death [19].
Figure 3. HRV analysis during active standing test
15 years old girl with “chronic Lyme disease” and POTS with positive autoantibodies (α-1-adrenergic-, α-2-adrenergic-, anti-muscarinic cholinergic receptor3- and , anti-muscarinic cholinergic receptor4- autoantibodies) . The spectral analysis show the collapse of HRV from the high frequencies to the low frequencies while standing. Due to the heart rate fluctuations while standing single measurements could indicate a heart rate increment between 25 and 75 bpm. The girl completely recover with ivabradine.
However, pharmacotherapy of POTS is sophisticated (20) We use low dose propranolol (N=6), midodrine (N=5), ivabradine (N=7) or mestinone (N=1). The therapeutic effect must be controlled in a second active standing test and often, we must change the pharmacotherapy that was not successful at the first attempt. In the most severe cases with proven autoimmunity and chronic fatigue syndrome repeat immunoadsorption therapy may be successful [21].
We use a 5-minute active standing test for POTS screening and determine a cut off of 35 bpm heart rate increment after data analysis. This is a compromise between the practical feasibility in a highly frequented outpatient clinic and the current methodological recommendations. The example in figure three shows that single heart rate measurements at any time of active standing is not pretty good. This case shows heart fluctuations while standing and we could measure heart rate increment between 25 and 75 bpm and a maximal heart rate between 110 and 150 bpm in a patient with severe POTS. There are no normal values for average heart rates in the active standing test from the literature and our cut off from the healthy control group would be 30 bpm heart rate increment (mean + 2 standard deviations) – the cut off value in adults. With 35 bpm we use a compromise between 30 and 40 bpm – the current cut off in children. Looking to the distribution of our data in figure 1, children with and without POTS seems to be separated at a cut off around 30bpm.
This study was carried out independently. The authors had no conflict of interest and did not receive any funding for the conduction of the study.
- Sheldon RS, Grubb BP 2nd, Olshansky B, Shen WK, Calkins H, et al. (2015) 2015 heart rhythm society expert consensus statement on the diagnosis and treatment of postural tachycardia syndrome, inappropriate sinus tachycardia, and vasovagal syncope. Heart Rhythm 12: e41-63. [Crossref]
- Kirbis M, Grad A, Meglic B, Bajrovic FF (2013) Comparison of active standing test, head-up tilt test and 24-h ambulatory heart rate and blood pressure monitoring in diagnosing postural tachycardia. Funct neurol 8: 39-45. [Crossref]
- Singer W, Sletten DM, Opfer-Gehrking TL, Brands CK, Fischer PR, et al. (2012) Postural tachycardia in children and adolescents: what is abnormal? J Pediatr 160: 222-6. [Crossref]
- Heart rate variability: standards of measurement, physiological interpretation and clinical use. Task Force of the European Society of Cardiology and the North American Society of Pacing and Electrophysiology. Circulation 1996; 93: 1043-65. [Crossref]
- Dippacher S, Willaschek C, Buchhorn R (2014) Different nutritional states and autonomic imbalance in childhood. Eur J Clin Nutr 68: 1271-3. [Crossref]
- Shaw BH, Stiles LE, Bourne K, Green EA, Shibao CA, et al. (2019) The face of postural tachycardia syndrome - insights from a large cross-sectional online community-based survey. J Intern Med 286: 438-48. [Crossref]
- DiBaise JK, Harris LA, Goodman B (2018) Postural Tachycardia Syndrome (POTS) and the GI Tract: A Primer for the Gastroenterologist. Am J Gastroenterol 113: 1458-67. [Crossref]
- Swai J, Hu Z, Zhao X, Rugambwa T, Ming G (2019) Heart rate and heart rate variability comparison between postural orthostatic tachycardia syndrome versus healthy participants; a systematic review and meta-analysis. BMC Cardiovasc Disord 19: 320. [Crossref]
- Lin J, Zhao H, Ma L, Jiao F (2019) Body mass index is decreased in children and adolescents with postural tachycardia syndrome. Turk J Pediatr 61: 52-8. [Crossref]
- Buchhorn J, Buchhorn R (2020) Excessive Heart Rate Increments during Active Standing Test in Children with Anorexia Nervosa: An Indicator of a Postural Orthostatic Tachycardia Syndrome and a New Therapeutic Target? J Family Med Prim Care Open Acc 4.
- Parsaik A, Allison TG, Singer W, Sletten DM, Joyner MJ, et al. (2012) Deconditioning in patients with orthostatic intolerance. Neurology 79: 1435-9. [Crossref]
- Nagata JM, Carlson JL, Golden NH, Murray SB, Long J, et al. (2019) Associations between exercise, bone mineral density, and body composition in adolescents with anorexia nervosa. Eat Weight Disord 24: 939-45. [Crossref]
- Kolnes LJ (2017) Exercise and physical therapy help restore body and self in clients with severe anorexia nervosa. J Bodyw Mov Ther 21: 481-94.
- Schlegel S, Hartmann A, Fuchs R, Zeeck A (2015) The Freiburg sport therapy program for eating disordered outpatients: a pilot study. Eat Weight Disord 20: 319-27. [Crossref]
- Gianini LM, Klein DA, Call C, Walsh BT, Wang Y, et al. (2016) Physical activity and post-treatment weight trajectory in anorexia nervosa. Int J Eat Disord 49: 482-9. [Crossref]
- Gunning W 3rd, Kvale H, Kramer PM, Karabin BL, Grubb BP (2019) Postural Orthostatic Tachycardia Syndrome Is Associated With Elevated G-Protein Coupled Receptor Autoantibodies. J Am Heart Assocv 8: e013602. [Crossref]
- Kanjwal K, Karabin B, Kanjwal Y, Grubb BP (2011) Postural orthostatic tachycardia syndrome following Lyme disease. Cardiol J 18: 63-6. [Crossref]
- Niebroj-Dobosz I, Dorobek M, Marchel M, Hausmanowa-Petrusewicz I (2006) Evidence for autoimmunity to heart-specific antigens in patients with Emery-Dreifuss muscular dystrophy. Acta Myol 25: 68-72. [Crossref]
- Ryabkova VA, Shubik YV, Erman MV, Churilov LP, Kanduc D, et al. (2019) Lethal immunoglobulins: Autoantibodies and sudden cardiac death. Autoimmunity reviews 18: 415-25. [Crossref]
- Liao Y, Du J (2020) Pathophysiology and Individualized Management of Vasovagal Syncope and Postural Tachycardia Syndrome in Children and Adolescents: An Update. Neurosci Bull 36: 667-81. [Crossref]
- Tölle M, Freitag H, Antelmann M, Hartwig J, Schuchardt M, et al. (2020) Myalgic Encephalomyelitis/Chronic Fatigue Syndrome: Efficacy of Repeat Immunoadsorption. J Clin Med 9: E2443. [Crossref]
Editorial Information
Editor-in-Chief
Article Type
Research Article
Publication history
Received date: August 23, 2020
Accepted date: September 07, 2020
Published date: September 11, 2020
Copyright
©2020 c. This is an open-access article distributed under the terms of the Creative Commons Attribution License, which permits unrestricted use, distribution, and reproduction in any medium, provided the original author and source are credited.
Citation
Julia B, Reiner B (2020) The postural orthostatic stress syndrome in childhood: HRV analysis and the active standing test 3: DOI:10.15761/PMCH.1000148.