Background: The decision of whether to operate an orbital blowout fracture or not is, among other things, based on the size of the fracture. The volume and area of the fracture is often estimated using geometric figures and formulas. We compared this simplification with precise and/or proven methods to see if there was a need for consensus in how to do these measurements.
Methods: This was a retrospective review of orbital blowout fractures in patients admitted to the Department of ENT and Head and Neck Surgery, Karolinska University Hospital, Stockholm, Sweden 2011-2015. In the computed tomographic (CT) images, the fractured area was measured with a proven method and the volume with a meticulous new method. The size of the same fracture was estimated with geometric formulas where the area was assumed to resemble an ellipse and the volume a hemi-ellipsoid. The results were visualized with Bland-Altman plots and accuracy, sensitivity and specificity were analyzed. Comparison was also made with volumes initially measured by radiologists.
Results: Eighty-two patients were included from two on-going studies (43% women, 57% men; mean age 49.7 years (5-90 years)). Geometric approximations have high sensitivity and low specificity. The geometric formula for volume had an accuracy of 0.73 (specificity 0.50) and the radiologist’s measurements of the volumes had an accuracy of 0.84.
Conclusion: In the decision of whether to operate an orbital blowout fracture or not it is crucial to measure areas and volumes correctly. The use of geometric approximations can lead to overestimation of the size of the injury. Thus, patients may be exposed to the risk of an unnecessary operative repair. For this reason, simplifications are inadequate from a clinical perspective. The authors inference is that measurements should be made with accurate methods and not with geometric calculations to avoid misdiagnosis. An available, easy and quick method to do these measurements is awaited.
blowout fracture, CT-scan, inferior orbital wall, fracture, volume
CT: Computed Tomography; BOF: Blowout Fracture; HU: Hounsfield Unit; PPV: Positive Predictive Values; NPV: Negative Predictive Values; LoA: Limit of Agreement.
Blunt trauma to the midface relatively often lead to a blowout fracture (BOF) of the orbital wall; inferior, medial or inferomedial [1,2]. Surgery is performed to avoid sequelae such as diplopia, enophthalmos [3] or superior sulcus deformity [4,5]. Management of BOF is still controversial and there are considerable differences in opinion regarding who would benefit from surgery or not and when to operate [1,6-8]. With expectancy some of these deficits will resolve spontaneously [4,7] and after surgical management there are still a considerable number of perioperative or late complications in need of secondary orbital reconstruction [3-5,8-10]. After proper surgical management, ocular motility disturbance and diplopia persists in 9-30% of patients [2,11,12] and surgery itself is a risk for severe complications such as orbital infection, intraorbital hematoma and blindness [2]. If no acute situation is present (retrobulbar hematoma [13] or muscle entrapment with threatening ischemia [4]) waiting 1-2 weeks is beneficial [8,14] because it gives the orbital swelling time to resolve [1]. The decision to operate or not is affected, besides local traditions and the clinical experience of the surgeon [6], of the fractured area and of the volume of the orbital tissue protruding into the maxillary sinus/ethmoidal sinus [4,15-21]. CT is gold standard imaging technique for detecting a BOF and for measuring the above-mentioned parameters in coronal and sagittal cuts [1,22,23].
To measure the fractured area in an accurate way Ploder [24] measured the width of the fracture slice-by-slice on coronal cuts with a known slice thickness. By summing the separate surfaces, they obtained the total surface area of the fracture. This is a method with excellent accuracy [25], but to time-consuming for routine clinical use. Schouman [26] measured the fractured area with a computer-based model using a free software with reliable and accurate results. In the literature many authors use simplifications such as formulas for standard geometric figures as a way of measuring the area and volume of BOF [17,27]. When validated by Goggin [25] none of the geometric formulas estimating the area had clinically acceptable accuracy. Cha [21] found that the fractured area estimated as an ellipse and the area measured by a computer-aided design software differed to a statistically significant extent. To the authors knowledge no-one has validated the estimation of the volume of herniated orbital tissue by using a hemi-ellipsoid.
The objectives of this study were: 1) to see if geometric simplification for calculating volumes and areas in orbital blowout fractures can be used in daily clinical practice and 2) to see if volumes estimated by radiologists differ from meticulously measured volumes.
This was a retrospective review of orbital BOF in patients admitted to the Department of ENT and Head & Neck Surgery at Karolinska University Hospital in Stockholm, Sweden between 2011-2015. The patients were originally included in two other studies in the same department where the aim was to investigate, among other things, if certain CT-scan characteristics can predict late visible deformity [28]. Inclusion criteria included facial trauma and a ≤ 3 mm CT scan verified fracture. All isolated unilateral inferior BOF and all inferomedial BOF without involvement of the inferomedial buttress were included. If any patient had severe acute injuries, like retrobulbar hematoma or extraocular muscle entrapment, they were excluded from the study and treated according to current guidelines. From the patients records we obtained age, gender and measurements previously made by radiologists. The CT scans of each included patient were transferred to a workstation (GE Healthcare Advantage Workstation version 4) and analyzed in an osseous window level setting in axial, coronal and sagittal planes. The following measures and notes were made: 1) the width of the fracture, 2) the length of the fracture, 3) the height of the herniated orbital tissue, 4) the area of the fracture, 5) the volume of herniated orbital tissue and 6) if the fracture involved the inferomedial buttress (exclusion criteria) (Figure 1A, 1B and Figure 2A-2C). The measurements and calculations were made by the author.
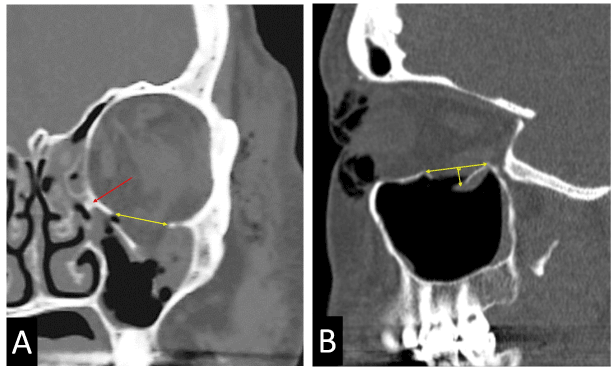
Figure 1. Measurements of the CT-scans: A) the width of the fracture in coronal plane where it was considered the largest, if the buttress was fractured or not (red arrow) and B) the antero-posterior length of the fracture in sagittal plane where the fracture was considered largest. The distance from the farthest fractured segment or herniated tissue to its place of origin perpendicular to and intersecting a line between the anterior and posterior edges of the largest defect in sagittal plane.
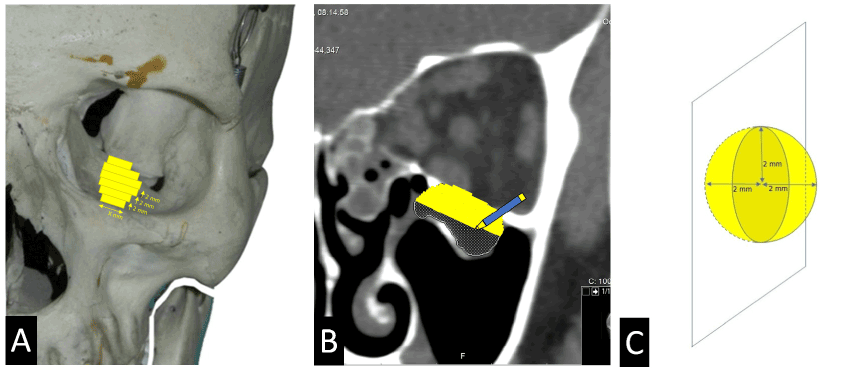
Figure 2. Area and volume measurements of the CT-scans: A) the width of the 2mm CT-slices in coronal plane from the anterior to the posterior fracture edge. B) The volume of the protruding tissue was marked in coronal and sagittal plane with a spherical 3D brush C) and the volume was calculated.
The on-going study that included this material was approved by Ethics Committee of the Karolinska Institute (EPN) Stockholm, Sweden. From each individual included in the study informed consent was obtained. The study was conducted in adherence to the Declaration of Helsinki.
Area
We calculated the fractured area using a quantitative computational method [16]. Stacks of 2 mm slices were made in coronal plane and in each slice, we measured the width of the fracture. We made stacks of 3 mm slices if that was the only CT scans available. The width between the edges of the fracture was measured without the concavity of the floor considered. By using the known slice thickness and the defect width to calculate the area of each trapezoidal strip, we could now multiply them and obtain the total area of the fracture.
Volume
The volume was calculated analogous to a previous study [29]. Using axial raw thin slices of the CT scan in a soft tissue window setting (HU (Hounsfield unit) 600/1000) the orbital fat and muscle could be distinguished from blood. Starting in coronal plane the following steps were taken: “VR tools”; “Segment”; “Quick paint” with brush size 2 mm. The herniated tissue was marked in the first slice to show up and then scrolled 2-3 steps posteriorly to mark the content again. If slice thickness was ≥ 2 mm every slice was processed. This was repeated until all the tissue was marked in coronal plane and the same procedure was performed in the sagittal plane to fill in any gaps between the slices. The now marked volume was applied and the “Display tools” was used. The “Threshold” was set to -300 to 200 to exclude bone and air. Finally, the “Globe” function was used to measure the volume.
Geometry
The area of the fracture was assumed to correlate to the shape of an ellipse with the two perpendicular axes being the maximum length and width of the fracture. For the sake of simplicity, we assumed that these axes intersect at the center of the ellipse although this might not be the case. The volume of herniated tissue was assumed to correlate to the shape of a hemi-ellipsoid with the above-mentioned simplification. We calculated the estimated area and volume using standard formulas of the ellipse and hemi-ellipsoid (Figure 3).
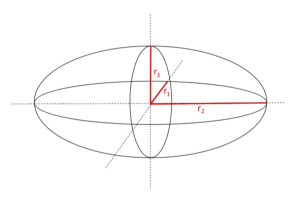
Figure 3. Formulas for calculating area and volume: Ellipse Area = r1r2 π, hemi-ellipsoid volume = 4/3 π r1r2r3 /2 = 4/6 π r1r2r3.
Statistical analyses
The measured area and volume were calculated (outcome values) and compared with the estimated values (predictor values). When sensitivity, specificity and accuracy were calculated for each of the values we chose 2.3 cm2 as area cut-off and 1.0 cm3 for volume cut-off. That was the cut-off to consider as critical defect size in a recent study that investigated when to operate a BOF or not. To compare and illustrate the difference of the pairwise estimated and measured values, Bland-Altman plots were used. The Shapiro-Wilk test was used to assess the normality of the data after box-cox transformation of the differences. P-value was considered significant if <0.05. Statistical analyses were performed using Microsoft Excel for Windows version 1910 with application Analyse-it and QI Macros 2019. For calculation of lambda, Box-Cox Normality Plot (v1.1.12) in Free Statistics Software (v1.2.1) was used (Wessa P., (2016), Office for Research Development and Education, URL http://www.wessa.net/rwasp_boxcoxnorm.wasp/).
Eighty-two patients were included. 43% were women and 57% men with a mean age of 49.7 years (5-90 years). A total of 100 patients with a unilateral orbital floor fracture accepted to participate. 5 of the CT-scans were insufficient according to our criteria and 13 patients did not complete the study and were excluded.
When measured with Alinasab’s meticulous method 56 % (46) of the patients had a fractured volume over 1.0 cm3 (Figure 4A). When the volumes were estimated as hemi-ellipsoids, 73% (60) met the same criteria (Figure 4B). 18 calculated estimations were false positive and 4 were under 1.0 cm3 and false negative. This gives us a sensitivity of 0.95, specificity of 0.50 and accuracy of 0.73. See table 1 for complete list of sensitivity, specificity, accuracy, positive predictive values (PPV) and negative predictive values (NPV). We evaluated the bias between the mean differences and estimated an interval of agreement with Bland-Altman graphs. The assumption of normality was accepted after transformation of the differences (p>0.05) for volumes, areas and the radiologist’s estimated volumes. As shown in the Bland-Altman plot for the areas, the bias line is larger than 0 which means the geometric formula tends to overestimate the area of the fracture (Figure 5A). The agreement interval is -0.97-1.26. Looking at the band of plots, they start narrow and widen as the magnitude increases to the right. This indicates that the variability of the differences increases as the areas increases. This pattern is even more pronounced regarding volumes (Figure 5B). The interval of agreement for the volume is -1.05-2.59 and the fixed bias for the geometric formula is +0.77. The volumes measured by radiologists differed from the meticulously measured volumes (Figure 5C). The accuracy was better than for the geometric formula with 0.84 compared to 0.73 for the hemi-ellipsoid. PPV was 0.91.
Table 1. Sensitivity, specificity, accuracy and predictive values for different estimations. Cut-off for area ≥2.3 cm2 and for volume ≥1.0 cm3. [1] Positive predictive value; [2] Negative predictive value.
Estimation |
Sensitivity |
Specificity |
Accuracy |
PPV[1] |
NPV[2] |
Area as an ellipse |
0.93 |
0.87 |
0.9 |
0.89 |
0.92 |
Volume as a hemi-ellipsoid |
0.95 |
0.50 |
0.73 |
0.70 |
0.82 |
Volume estimated by radiologists |
0.86 |
0.85 |
0.84 |
0.91 |
0.67 |
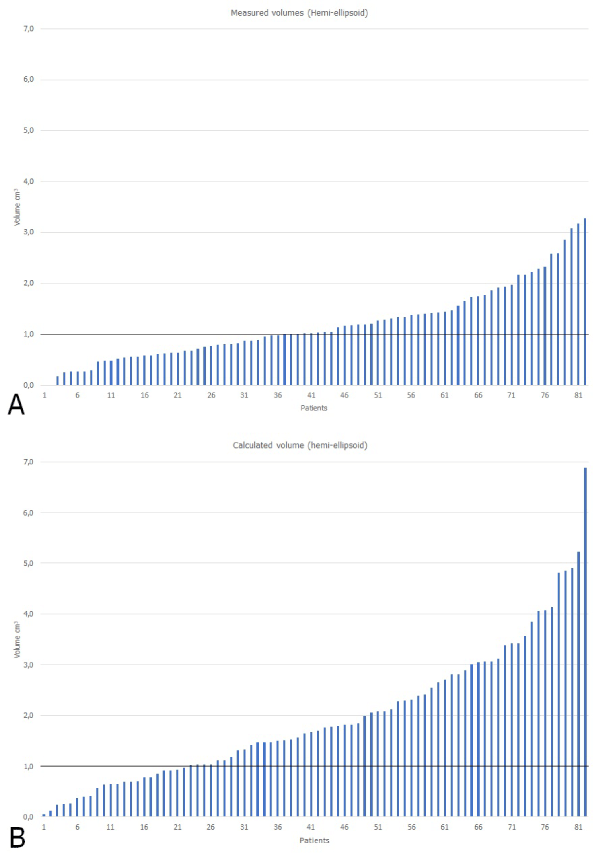
Figure 4. Volumes of the orbital tissue protruding through the fracture. Measured volumes A) and calculated volumes, B) with the cut-off volume 1 cm3 marked with a thicker line in each plot.
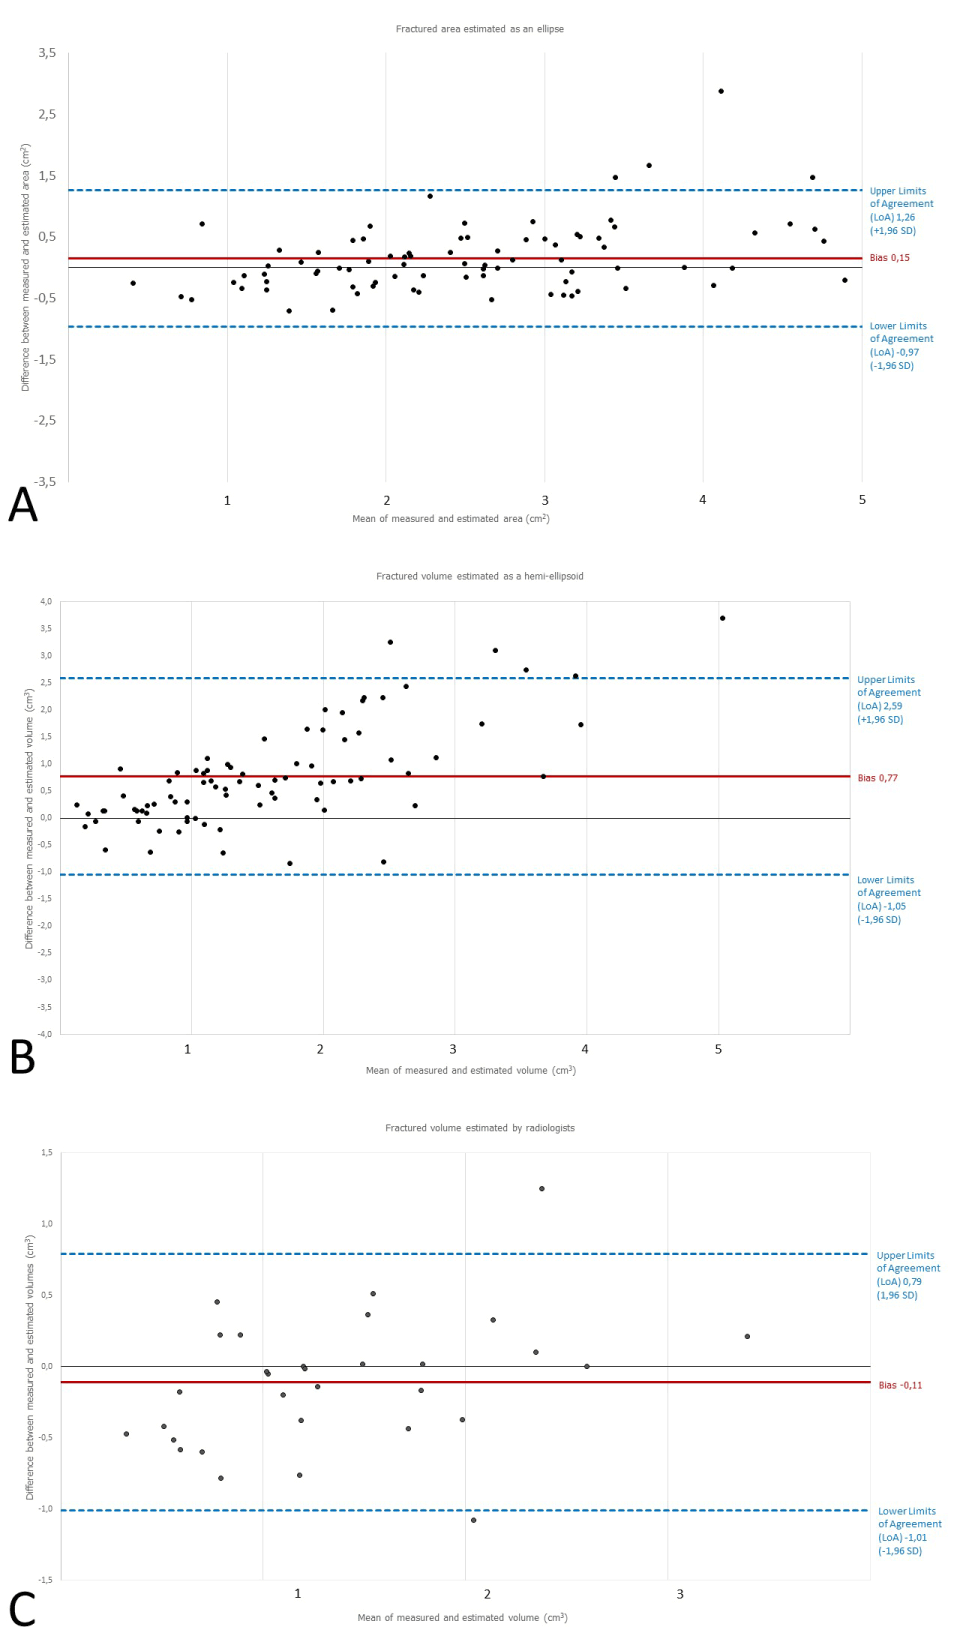
Figure 5. Bland-Altman plots of measured and estimated values. The difference between the two values are plotted against the average of them. 95% limits of agreement are marked. A) The areas estimated as an ellipse, B) the volumes estimated as a hemi-ellipsoid and C) the volumes measured by radiologists.
To measure areas and volumes correctly, BOF is crucial in the decision of whether to operate or not. Some patients develop sequelae if not operated and others do not [3-5]. Today there is no consensus in how to perform these measurements and many radiologists and surgeons use geometric formulas to estimate the fracture size. This is a rapid and simple method, but when Goggin [25] compared it to a validated method they concluded it was not good enough. In their study the ellipse-formula had a sensitivity of 0.98, specificity 0.87 and accuracy 0.93. There is one validated method to measure fractured areas [24], but it requires the CT-scans to be transferred to a workstation and it is time-consuming to do the measurements as every slice from the anterior to the posterior fracture line need to be measured.
Our study included 82 patients with inferior BOF. It showed that the differences between the measured and estimated values are too substantial to be acceptable for the volumes as well as for the areas. With the most precise estimation, the ellipse as the fractured area, 7 out of 100 patients will be missed and 13 out of 100 are at risk for unnecessary surgery. The accuracy of this geometric estimation is 0.90 but still too poor to be used in clinical practice.
Regarding volumes, it is even more disquieting. 5 patients out of 100 run the risk of not being considered for surgery. With close follow up they can still be noted later and be subject to surgery. Worse is that you are at risk taking 50 out of 100 patients to surgery unnecessarily (specificity 0.50). The interval of agreement on the Bland-Altman plot is wide (-1.05-2.59), which illustrates the risk taken if this formula is used to base the decision whether to operate or not. With larger fractures, comes greater overestimation as illustrated by the shape of the Bland-Altman plots. Even volumes evaluated by radiologists are not sufficiently accurate (0.84). The PPV of 0.91 of radiologist’s volumes is good, but not good enough for clinical use. The Bland-Altman plots indicate radiologists tend to underestimate the fractured volume size.
One weakness of this study is that we only had 31 fractures that were measured by radiologists and we do not know how they did their measurements/calculations. We know some of the radiologists at our hospital use the same new method as we do for the measurements. This can make the accuracy lower in other hospitals than we show in this study. The measurements are done by one person (the author) and this is both a weakness and a strength. The author is well trained in doing these measurements, but of course this can lead to the possibility of systematic errors. All the patients included was originally included in another study and if they were excluded according to their exclusion criteria, they were also excluded from this study. As a result, we had fewer patients available.
To summarize, the decision whether to operate or not needs to be based on reliable parameters. Today there is no consensus on how to do the measurements correct. Simple geometric formulas seem to be inadequate for this purpose both regarding areas and volumes. If surgeons know what method the radiologists at their hospital uses, they can at least make a more just assessment.
The use of geometric approximations can lead to overestimation of the size of the injury. Thus, patients may be exposed to the risk of an unnecessary operative repair. For this reason, simplifications are inadequate from a clinical perspective. The authors inference is that measurements should be made with accurate methods and not with geometric calculations to avoid misdiagnosis. There is a need for an available, easy and quick method to do these measurements.
We would like to thank Hatef Darabi for constructive statistical discussions.
- Ellis E 3rd (2012) Reconstruction of orbital floor defects.J Oral Maxillofac Surg70: 2255. [Crossref]
- Gosau M, Schöneich M, Draenert FG, Ettl T, Driemel O, Reichert TE (2011) Retrospective analysis of orbital floor fractures--complications, outcome, and review of literature. Clin Oral Investig 15: 305-313. [Crossref]
- Shin JW, Lim JS, Yoo G, Byeon JH (2013) An analysis of pure blowout fractures and associated ocular symptoms.J Craniofac Surg24: 703-707. [Crossref]
- Burnstine MA (2002) Clinical recommendations for repair of isolated orbital floor fractures: an evidence-based analysis. Ophthalmology 109: 1207-1210. [Crossref]
- Jung H, Byun JY, Kim HJ, Min JH, Park GM, et al. (2016) Prognostic CT findings of diplopia after surgical repair of pure orbital blowout fracture.J Craniomaxillofac Surg44: 1479-1484. [Crossref]
- Alinasab B, Ryott M, Stjarne P (2014) Still no reliable consensus in management of blow-out fracture.Injury45: 197-202. [Crossref]
- Beigi B, Khandwala M, Gupta D (2014) Management of pure orbital floor fractures: a proposed protocol to prevent unnecessary or early surgery.Orbit33: 336-342. [Crossref]
- Cole P, Boyd V, Banerji S, Hollier LH Jr (2007) Comprehensive management of orbital fractures. Plast Reconstr Surg 120: 57S-63S. [Crossref]
- Kim HS, Jeong EC (2016) Orbital Floor Fracture.Arch Craniofac Surg17: 111-118. [Crossref]
- Baumann A, Burggasser G, Gauss N, Ewers R (2002) Orbital floor reconstruction with an alloplastic resorbable polydioxanone sheet. Int J Oral Maxillofac Surg 31: 367-373. [Crossref]
- Harris GJ, Garcia GH, Logani SC, Murphy ML (2000) Correlation of preoperative computed tomography and postoperative ocular motility in orbital blowout fractures. Ophthalmic Plast Reconstr Surg 16: 179-187. [Crossref]
- Hoşal BM, Beatty RL (2002) Diplopia and enophthalmos after surgical repair of blowout fracture. Orbit 21: 27-33. [Crossref]
- Gerbino G, Ramieri GA, Nasi A (2005) Diagnosis and treatment of retrobulbar haematomas following blunt orbital trauma: a description of eight cases. Int J Oral Maxillofac Surg 34: 127-131. [Crossref]
- Harris GJ (2006) Orbital blow-out fractures: surgical timing and technique.Eye (Lond)20: 1207-1212. [Crossref]
- Hawes MJ, Dortzbach RK (1983) Surgery on orbital floor fractures. Influence of time of repair and fracture size.Ophthalmology90: 1066-1070. [Crossref]
- Ploder O, Klug C, Voracek M, Burggasser G, Czerny C (2002) Evaluation of computer-based area and volume measurement from coronal computed tomography scans in isolated blowout fractures of the orbital floor. J Oral Maxillofac Surg 60: 1267-1272. [Crossref]
- Jin HR, Shin SO, Choo MJ, Choi YS (2000) Relationship between the extent of fracture and the degree of enophthalmos in isolated blowout fractures of the medial orbital wall. J Oral Maxillofac Surg 58: 617-620. [Crossref]
- Fan X, Li J, Zhu J, Li H, Zhang D (2003) Computer-assisted orbital volume measurement in the surgical correction of late enophthalmos caused by blowout fractures. Ophthalmic Plast Reconstr Surg 19: 207-211. [Crossref]
- Ahn HB, Ryu WY, Yoo KW, Park WC, Rho SH, et al. (2008) Prediction of enophthalmos by computer-based volume measurement of orbital fractures in a Korean population. Ophthalmic Plast Reconstr Surg 24: 36-39. [Crossref]
- Kunz C, Sigron GR, Jaquiéry C (2013) Functional outcome after non-surgical management of orbital fractures--the bias of decision-making according to size of defect: critical review of 48 patients. Br J Oral Maxillofac Surg 51: 486-492. [Crossref]
- Cha JH, Moon MH, Lee YH, Koh IC, Kim KN, et al. (2017) Correlation between the 2-Dimensional Extent of Orbital Defects and the 3-Dimensional Volume of Herniated Orbital Content in Patients with Isolated Orbital Wall Fractures. Arch Plast Surg 44: 26-33. [Crossref]
- Laine FJ, Conway WF, Laskin DM (1993) Radiology of maxillofacial trauma. Curr Probl Diagn Radiol 22: 145-188. [Crossref]
- Lee HJ, Jilani M, Frohman L, Baker S (2004) CT of orbital trauma.Emerg Radiol10: 168-172. [Crossref]
- Ploder O, Klug C, Voracek M, Backfrieder W, Tschabitscher M, et al. (2001) A computer-based method for calculation of orbital floor fractures from coronal computed tomography scans. J Oral Maxillofac Surg 59: 1437-1442. [Crossref]
- Goggin J, Jupiter DC, Czerwinski M (2015) Simple computed tomography-based calculations of orbital floor fracture defect size are not sufficiently accurate for clinical use. J Oral Maxillofac Surg 73: 112-116. [Crossref]
- Schouman T, Courvoisier DS, Imholz B, Van Issum C, Scolozzi P (2012) Computational area measurement of orbital floor fractures: reliability, accuracy and rapidity. Eur J Radiol 81: 2251-224. [Crossref]
- Piombino P, Iaconetta G, Ciccarelli R, Romeo A, Spinzia A, et al. (2010) Repair of orbital floor fractures: our experience and new technical findings. Craniomaxillofac Trauma Reconstr 3: 217-222. [Crossref]
- Alinasab B, Borstedt KJ, Rudström R, Ryott M, Qureshi AR, et al. (2018) New Algorithm for the Management of Orbital Blowout Fracture Based on Prospective Study. Craniomaxillofac Trauma Reconstr 11: 285-295. [Crossref]
- Alinasab B, Beckman MO, Pansell T, Abdi S, Westermark AH, et al. (2011) Relative difference in orbital volume as an indication for surgical reconstruction in isolated orbital floor fractures. Craniomaxillofac Trauma Reconstr 4: 203-212. [Crossref]