Abstract
Objective: Published literature suggests that naturally occurring variations in environmental temperatures can have significant influences on the tendency for violent behaviors. The primary objective of this study was to see whether an association exists between temperature variations and the occurrence of child abuse.
Methods: We conducted a retrospective chart review of patients who presented to our pediatric emergency department with substantiated cases of child abuse from January 1, 2007 – December 31, 2016. Linear regression on 7-day moving average cases of child abuse vs 7-day average temp was calculated. In addition, daily average incidence of child abuse per 10-degree range was calculated by dividing the total cases of abuse in a given temperature range by the total number of days in the same range. Finally, we calculated rates of abuse over summer vs. winter break.
Results: The frequency of child abuse increased with increasing temperatures. Simple linear regression yielded a coefficient of 0.01 for the 7-day moving average cases of child abuse vs 7-day average temp. The Cochran-Armitage test for increasing trend on the daily average incidence of child abuse per 10-degree range was significant (p<0.01). Poisson test on the rate of abuse over summer breaks vs. winter breaks produced a rate ratio of 1.34 with 95% confidence interval [1.01, 1.82] (p=0.03).
Conclusion: Our study reflects the findings of prior literature to support an apparent positive association between temperature and the prevalence of violent behavior, and in the case of this study specifically child abuse.
Key words
child abuse, violence, temperature, weather, pediatric emergency department
Introduction
Child abuse is a violent crime that affects one in four children in the Unites States (US) [1]. More concerning is data from a national estimate in the United States that shows a 3.0% increase in child abuse from 2012 (656,000) to 2016 (676,00) [2]. It is now understood that children who experience abuse in childhood are at an increased risk of adverse health outcomes [3,4]. Thus, it comes as no surprise that identifying and assessing risk factors associated with child abuse is a national research priority [5]. Given the multifactorial nature of child abuse multidisciplinary research is needed to better understand predisposing factors to help identify children at risk and factors that influence rates of child abuse. Since a large number of children seeking care for abuse present to the Emergency Department, this setting provides an ideal environment to identify patterns associated with abuse. Working in a large tertiary Children’s Hospital, we have noted an increase in child abuse patterns during times of increased temperature. Recognizing this as a possible risk factor for child abuse could allow for prospective public service initiatives and educational programs to help protect and care for these children. Additionally, understanding these risk factors potentially could assist social services and healthcare organizations attempting to maximize resource allocation.
The assumption that temperature has an effect on human behavior is one that is deeply rooted in society. Phrases like “hot headed” or “cold hearted” are examples of how we as a culture support the idea that ambient temperatures are somehow intrinsically linked to human behavior. Hippocrates himself is credited with being a champion of humoral medicine in which different “humors” were associated with various qualities of temperatures as well as temperaments [6]. Surprisingly, little scientific inquiry into this idea occurred until the turn of the twentieth century when researchers first began to look at associations between weather and incidents of crime [7]. However, formal evaluation of this age-old assumption did not take off until the 1970s when Baron and Bell performed groundbreaking experiments where they questioned the presumably simple nature of the temperature-aggression relationship [8,9]. Results from these early laboratory experiments sparked an explosion of interest in this field, and soon researchers began comparing the laboratory findings to reports of violent crimes and historical weather data. Over the decades various models have been proposed for the association between temperature and its effects on human behavior, but two dominate the literature. Having their origins in the previously mentioned laboratory experiments are the Negative Affect Escape (NAE) model and its rival the General Affect (GA) model. The specifics of these models are not going to be discussed or investigated here, but a foundational understanding of them seems prudent. The NAE model is one that is curvilinear, and postulates an inflection point above which there is a paradoxical reduction in aggression caused by temperature [10]. However, the GA model is linear with direct correlation between temperatures and aggression [11]. While there is still debate on the exact shape of the graph, the overall trend is obvious. However, the studies these models are based on use mostly police reports of violent crimes like assault, rape, and robbery. Measuring the incidence of child maltreatment as the dependent measure and its association with temperature brings about notable differences that can be applied to the NAE and GA models. For example, in regard to the NAE model the Routine Activity Theory (RA) attempts to explain the NAE model by stating that the inflection point is where people are most likely to be outside their homes and thus encounter situations in which violent crimes are more likely [12]. Measuring the correlation between child maltreatment and temperature would provide a previously unmeasured variable since the vast majority of child maltreatment happens not at the hand of strangers but from the child’s caretaker [2].
Furthermore, recent literature shows that climate has significant effects on overall human health [13,14]. This evidence supports the hypothesis that we have previously underestimated the effects of temperature on human behavior. For example, rates of suicide and depressive social media language have been shown to rise with temperature [15]. Even cognitive function has been shown to be negatively impacted by increasing temperatures [16]. The effect of temperature on human behavior is not limited to intrapersonal relationships either. Recent comprehensive synthesis of literature on the effects of climate on human conflict showed that deviations from mild temperature increase the risk of conflict, often substantially [17]. Thus, a growing body of evidence supports the idea that temperature has a significant effect on human behavior; however to date no study has investigated its association with rates of child abuse.
Materials and methods
Design
Institutional review board approval was obtained to perform this retrospective chart review. We chose a time period of 10 years, January 1, 2007 – December 31, 2016, in which to perform our chart review. We requested charts with ICD9 and ICD10 codes for all cases of child abuse that presented to our pediatric emergency department (PED). Medical personnel are mandated reporters of child maltreatment. In our institution, if child abuse is suspected, the medical provider contacts social services, and an internal institutional form of suspected maltreatment (CHO-25) is filed with the chart. Those charts are then reviewed by our Child Protection Team (CPT). In order to include only substantiated cases of child abuse we included only charts that were evaluated by our CPT. Evaluations by the CPT included interviewing the family and/or caregiver at the time of injury, evaluation of laboratory/radiological studies, and forensic examination and possible interviews of the victims. Each case was discussed individually by the CPT, which is made up of child abuse pediatricians, social services, department of human services (DHS), law enforcement, and a representative from the district attorney’s office. All children evaluated in the PED and found by the CPT to have substantiated claims of physical or sexual abuse with a subsequent DHS referral were included in this study. Patients who were found to have experienced solely neglect were excluded from the analysis as these cases were much less likely to be the product of violence.
We used the National Weather Service (NWS) records for local climatological data as reported by the nearest weather station approximately 8 miles our emergency department. We chose this station due to its central location within the state and greater metropolitan area from which our facility serves. The weather data obtained included maximum and minimum daily temperature as well as average daily temperature for every day during the 10-year period of our study. There were no missing data points for the data collected.
Results
Analysis/results
Between January 1, 2007 – December 31, 2016 we found 1,511 cases of child abuse that met our inclusion criteria. There was a near-even split between female (806) and male (705) cases of child abuse. There were 1,157 cases of physical abuse, 352 cases of sexual abuse, and two cases in which the child was found to have both physical and sexual abuse. The mean age of abused children was 5.54 years old with a standard deviation of 4.76 years.
For our first analysis we calculated a 7-day moving average due to the fact that our data included a large number of days in which no abuse was reported. To do this we started with the first 7-days of our 10-year data set. We then calculated the number of substantiated cases of child abuse over these seven days. Next the average temperature of the seven days in question was calculated. These two data points (cases of abuse and average temperature in the window) were plotted on a scatter plot. The 7-day window in question was then moved forward by one day, and the above process was repeated. In this way a 7-day moving average was calculated. Once the scatter plot was completed, a corresponding linear regression was calculated; this data is shown in Figure 1.
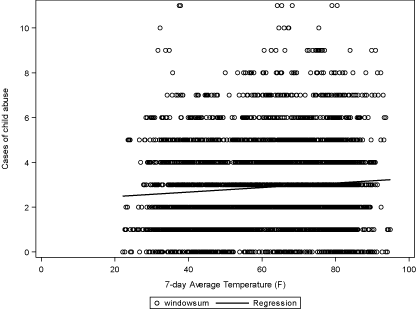
Figure 1. Moving 7-day average abuse cases vs 7-day average temperature. Figure 1 simple linear regression yields a coefficient for the 7-day average temperature of .01, meaning that for each 10 degree increase in average temperature, the mean number of child abuse cases that week increases by .01. The coefficient is statistically different from 0 (p<.01), meaning that average temperature is statistically significant in predicting the number of child abuse cases over a week
Overall the above analysis showed that the frequency of child abuse increases as temperature increases; however, the regression analysis assumes a constant cause and effect relationship and thus may miss some of the nuances behind the proposed association. To better understand the relationship between temperature and frequency of child abuse, an additional analysis was performed. For our next analysis we analyzed the data with regards to the relative frequency in which each average daily temperature was experienced. This was performed by calculating the total number of days that the average daily temperature fell into a given temperature range. The lowest average daily temperature in our data set was 9.5 degrees (F), and the maximum average daily temperature was 98.5 degrees (F). Thus, our lowest 10-degree range was 10-20 degrees (F) and increased up to a maximum of 90-100 degrees (F). We then calculated the number of abuse cases that occurred within each 10-degree range. By doing this we were able to calculate a daily average incidence of child abuse per 10-degree range by dividing the total cases of abuse in a given range by the total number of days in the same range. This data is shown in the bar graph, Figure 2, below.
We conducted a Poisson test on the data in Table 1, which produced a rate ratio comparing the rate of abuse in the summer breaks to the rate of abuse in the winter breaks as well as a 95% confidence interval. The estimated rate ratio was 1.34 with 95% confidence interval [1.01, 1.82] and a p=0.03.
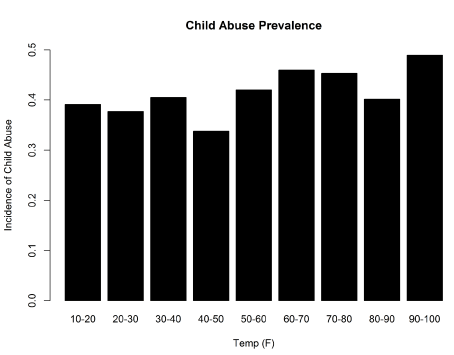
Figure 2. Prevalence of child abuse per 10-degree interval. Figure 2 shows frequency of child abuse per 10-degree interval divided by days per 10-degree interval. The Cochran-Armitage test for increasing trend was significant (p<0.01) indicating a significant upward trend in the incidence of child abuse as temperatures increase
Table 1. Comparing rates of abuse during summer and winter break. Table 1 shows the total number of days in both winter and summer break, total cases of abuse during each break, and average temperature during each break
Season |
Total Number of Days |
Total Abuse Cases |
Average Temp (F) |
Summer Break |
840 |
334 |
81.2 |
Winter Break |
190 |
56 |
38.6 |
Discussion
Data interpretation
Overall, the results of this study are consistent with previously published data on the effects of temperature on human aggression. These data support the idea that child abuse is a violent crime that is likely influenced by the perpetrator’s mental state or arousal. High temperatures have been shown to reduce cognitive function, and lower cognitive function has been repeatedly shown to be a risk factor for violence and antisocial behavior [16,18-22]. Also, crying has been shown to increase frustration and aggression and is thus associated with increased rates of child abuse [23-27]. The association shown here between increased temperature and frequency of child abuse likely has similar and possibly even compounding effects in regards to aggression, which likely leads to the resulting child abuse. For it was already known that temperature increases aggression [8,9,28-31]. This study provides empirical evidence to the theory that these changes in mental status are risk factors for child abuse.
One obvious compounding variable is the fact that school-age children are home for the summer and thus around caretakers. That increased time around the most common perpetrator could be viewed as an independent variable that leads to child abuse. This was the motivation behind our analysis comparing rates of abuse over summer break and winter break. Even when accounting for the relative number of days in summer break as compared to winter break, our analysis showed that variations in rates are not due to the alternative explanations of children being home from school over breaks as significantly more abuse over summer break as compared to winter; this is demonstrated by our estimated rate ratio of 1.349 with 95% confidence interval [1.014, 1.824] and p=0.037. This finding is in agreement with prior studies showing analysis both within years, as shown by increased crime associated with “hotter” quarters, and between years with “hotter” years correlating with increased violent crime [30,31]. Thus, when taking into considerations the findings presented here and in previous studies, it can be concluded that the trend for violent behavior is not due to seasonal differences like longer daylight hours, vacation, or other variables associated with the “hotter” seasons of the year. Such explanations for seasonal differences cannot account for previous studies findings of temperatures association with violent crime in “hotter” years [11,30,31]. In this way triangulation can be used to rule out alternative explanations for the findings presented.
NAE vs GA model
The purpose of this study was not to refute or substantiate either the NAE or GA model. However, given the unique perspective of our study, we feel that it is necessary to comment on how our findings relate to each model. Overall, our study supports the GA model as no inflection point was observed. This can be observed best by the data in Figure 2. It is important to note that by calculating the average incidence we more closely mimicked the analysis performed by Anderson who championed the GA model. We chose this analytical step because we agree with him that in doing so gives the reader a much more accurate description of how frequent these crimes are at given temperatures. Due to the fact that more “average” temperature days than “hot” days, there are relatively more “average” days in which abuse can occur. Thus, not considering the relative number of incidences per day gives a skewed model of the relative frequency of abuse. The NAE model theorizes that the inflection point is where one seeks to escape the discomfort of extreme temperature. As stated above the RA theory attempts to explain the NAE model by stating that the inflection point is where people are most likely to be outside their homes and thus encounter situations in which violent crimes are more likely [12]. However, our finding of an overall linear relationship between temperature and rates of abuse shed a new scrutiny on this theory since the vast majority of child abuse happens not at the hand of strangers but from the child’s caretaker [2]. This is not to say that the NAE model should be abandoned. For as stated previously the model predicts that increased temperature causes people to seek escape from discomfort; this desire to escape discomfort could lead caretakers to shake a crying baby for example. Again, the unique nature of our study sheds new light on prior models and emphasizes the need for more work to better understand the nuances behind each.
Implications and limitations
Clinical impact: This study further supports the evidence that climate change and its resulting increase in temperature will have a negative impact on children’s health. Literature has already shown that climate change has resulted in higher risk for mental and physical diseases [32]. Thus, it is important that clinicians and social workers involved in the care of children understand risk factors associated with adverse health outcomes for children. In light of this information we suggest that those clinicians and social workers counsel caretakers to be cognizant of the impact of temperature on their behavior, a strategy previously championed by researchers in the field [30]. One such strategy to mitigate this effect is to advise caretakers to consume a “cooling drink” as it has been shown to decrease the aggressive tendencies brought about by increased temperatures [9]. Though it should be noted that this drink be non-alcoholic in nature as the consumption of alcohol has been shown to be a risk factor for aggression and child abuse [33,34]. Seeking cooler ambient temperatures, via air-conditioned spaces, may also help to reduce the aggression brought about by hot temperatures [35,36].
Limitations: Though our total number of cases given the time span over which they were collected is relatively small compared to previous work done on temperature and violence, a similar result was found. Thus, we encourage our readers to consider the findings in this paper as a part of a much more robust set of data by which it was inspired before drawing conclusions. We would also like to point out that we did not account for days of the week in our analysis. This is because it had been shown previously that when accounted for as an additional predictor variable a statistically significant association between temperature and violent behavior was still seen [29].
Finally, we want to acknowledge that this is in all practical sense a field study and that all data presented in this paper represents an association, though due to obvious ethical reasons causational studies are prohibited. However, due to this study design our external validity is maximized, something previous laboratory studies lacked.
A note on future studies
Previously published literature has shown that violent crimes are relatively more frequent in hotter regions.31 Though some have theorized that in the US this discrepancy could be due to a difference in culture this argument is considerably weakened by the fact that increased rates of violent crimes have been found in southern France, Italy, Spain, and England as compared to their respective northern regions [7,37]. The location of our study proved to be an ideal location for a pilot study as it is located in a central portion of the US with an ample amount of temperatures at each end of the spectrum experienced by most of the country. Future studies should focus on including multiple nodes for analysis. These studies should account for average temperature to see whether “relative” hotness affects the rates at which child abuse occurs. Ideally these future studies should look to control for as many extrinsic factors as possible in order to stratify the effect of temperatures on child abuse. This includes additional weather variables like humidity, precipitation, wind speed, and barometric pressure as well as socioeconomic factors, demographic data, and perpetrators relationship to the victim. All of these are all examples of variables that if controlled for would strengthen the effect of temperatures on child abuse. We would also like to acknowledge that this paper is possible thanks to the extraordinary work of those who first modeled the theories of temperature and aggression. Our hope is that this study answers in some small part the call set forth for more field and correlational studies [31].
Conclusion
This study supports the body of literature that shows a positive association between increased temperature and violent behavior, in this case child abuse. Though the association between temperature and child abuse presented here is one that is not surprising, we believe that this study has value because it places empirical evidence on which future forecasting of child abuse can draw.
Disclosures
The authors have no relevant financial disclosures. This research did not receive any specific grant from funding agencies in the public, commercial, or not-for-profit sectors.
References
- Finkelhor D, Turner HA, Shattuck A, Hamby SL (2015) Prevalence of childhood exposure to violence, crime, and abuse: Results from the national survey of children’s exposure to violence. JAMA Pediatrics 169: 746-754. [Crossref]
- U.S. Department of Health & Human Services Families, Administration on Children Youth and Families, Bureau C. Child Maltreatment 2016: 1-120.
- Felitti VJ, Anda RF, Nordenberg D, Williamson DF, Spitz AM, et al. (1998) Relationship of childhood abuse and household dysfunction to many of the leading causes of death in adults: The adverse childhood experiences (ACE) study. Am J Prev Med 14: 245-258. [Crossref]
- Danese A, Moffitt TE, Harrington H, Milne BJ, Polanczyk G, et al. (2009) Adverse Childhood Experiences and Adult Risk Factors for Age-Related Disease. Arch Pediatr Adolesc Med 163: 1135-1143. [Crossref]
- US O of the SG (2005) Surgeon General’s Workshop on Making Prevention of Child Maltreatment a National Priority: Implementing Innovations of a Public Health Approach.
- Jackson WA (2001) A short guide to humoral medicine. Trends Pharmacol Sci 22: 487-489. [Crossref]
- Lombroso C (1911) Crime: Its causes and remedies. Boston: Little, Brown, and company.
- Baron R (1972) Aggression as a function of ambient temperature and prior anger arousal. J Pers Soc Psychol 21: 183-189. [Crossref]
- Baron RA, Bell PA (1976) Aggression and Heat: The Influence of Ambient Temperature, Negative Affect, and a Cooling Drink on Physical Aggression. Journal of Personality and Social Psychology 33: 245-255.
- Baron RA (1978) Aggression and Heat: “The Long Hot Summer” Revisited. Advances in Enviromental Psychology 32: 63-133.
- Anderson CA, Anderson KB (1998) Temperature and Aggression: Paradox, Controversy, and A (Fairly) Clear Picture. Human aggression: Theories, research, and implications for social policy 247-298.
- Cohen LE, Felson M (1979) Social change and crime rate trends: A routine activity approach. American Sociological Review 44: 588-608.
- Patz JA, Frumkin H, Holloway T, Vimont DJ, Haines A (2014) Climate change: challenges and opportunities for global health. JAMA 312: 1565-1580. [Crossref]
- McMichael AJ (2013) Globalization, climate change, and human health. N Engl J Med 368: 1335-1343. [Crossref]
- Burke M, González F, Baylis P, Heft-Neal S, Baysan C, et al. (2018) Higher temperatures increase suicide rates in the United States and Mexico. Nature Climate Change 8: 723-729.
- Cedeño Laurent JG, Williams A, Oulhote Y, Zanobetti A, Allen JG, et al. (2018) Reduced cognitive function during a heat wave among residents of non-air-conditioned buildings: An observational study of young adults in the summer of 2016. PLoS Medicine 15: e1002605. [Crossref]
- Hsiang SM, Burke M, Miguel E (2013) Quantifying the influence of climate on human conflict. Science 341: 1235367. [Crossref]
- Hirschi T, Hindelang MJ (1977) Intelligence and Delinquency: A Revisionist Review. American Sociological Review 42: 571-587.
- Farrington DP (1989) Early predictors of adolescent aggression and adult violence. Violence vict 4: 79-100. [Crossref]
- Guay JP, Ouimet M, Proulx J (2005) On intelligence and crime: A comparison of incarcerated sex offenders and serious non-sexual violent criminals. International Journal of Law and Psychiatry 28: 405-417. [Crossref]
- Kennedy TD, Burnett KF, Edmonds WA (2011) Intellectual, behavioral, and personality correlates of violent vs. non-violent juvenile offenders. Aggressive Behavior 37: 315-325. [Crossref]
- Donnellan MB, Ge X, Wenk E (2000) Cognitive abilities in adolescent-limited and life-course-persistent criminal offenders. Journal of Abnormal Psychology 109: 396-402.
- Kempe CH (1971) Paediatric implications of the battered baby syndrome. Arch Dis Child 46: 28-37. [Crossref]
- Fujiwara T, Barr RG, Brant R, Barr M (2011) Infant distress at five weeks of age and caregiver frustration. Journal of Pediatrics 159: 425-430. [Crossref]
- Barr RG, Fairbrother N, Pauwels J, Green J, Chen M, et al. (2014) Maternal frustration, emotional and behavioural responses to prolonged infant crying. Infant Behav Dev 37: 652-64. [Crossref]
- Barr RG, Trent RB, Cross J (2006) Age-related incidence curve of hospitalized Shaken Baby Syndrome cases: Convergent evidence for crying as a trigger to shaking. Child Abuse and Neglect 30: 7-16. [Crossref]
- Lee C, Barr RG, Catherine N, Wicks A (2007) Age-related incidence of publicly reported shaken baby syndrome cases: Is crying a trigger for shaking? J Dev Behav Pediatr 28: 288-293. [Crossref]
- Carlsmith JM, Anderson CA (1979) Ambient temperature and the occurrence of collective violence: A new analysis. J Pers Soc Psychol 37: 337-344. [Crossref]
- Anderson CA, Anderson D (1984) Ambient temperature and violent crime: Tests of the linear and curvilinear hypotheses. J Pers Soc Psychol 46: 91-97. [Crossref]
- Anderson CA (1987) Temperature and aggression: effects on quarterly, yearly, and city rates of violent and nonviolent crime. Journal of Personality and Social Psychology 52: 1161-1173.
- Anderson CA (1989) Temperature and Aggression: Ubiquitous Effects of Heat on Occurrence of Human Violence. Psychological Bulletin 106: 74-96. [Crossref]
- Xu Z, Sheffield PE, Hu W, Su H, Yu W, et al. (2012) Climate change and children’s health-A call for research on what works to protect children. Int J Environ Res Public Health 9: 3298-3316. [Crossref]
- World Health Organization (2006) Child maltreatment and alcohol.
- Ito TA, Miller N, Pollock VE (1996) Alcohol and aggression: A meta-analysis on the moderating effects of inhibitory cues, triggering events, and self-focused attention. Psychol Bull 120: 60-82. [Crossref]
- Baron RA (1976) The Reduction of Human Aggression: A Field Study of the Influence of Incompatible Reactions. Journal of Applied Social Psychology 6: 260-274.
- Kenrick DT, Macfarlane SW (1986) Ambient temperature and horn honking: A Field Study of the Heat/Aggression Relationship. Environment and Behavior 18: 179-191.
- Brearley HC (1932) Homicide in the United States. Montclair, NJ: Patterson-Smith.