Aim: The prolongation of T-wave-peak-to-end interval (Tpe) and arrhythmogenic index (AIX) could predict arrhythmias. Developing of ventricular arrhythmias is increased during hemodialysis (HD), but the effects of hemodiafiltration (HDF) on ventricular repolarization have not been elucidated yet.
Methods: Thirty patients was investigated while they were receiving hemodiafiltration over a period of three months then the same group of patients was evaluated during treatment with hemodialysis for at least another three months. Ionic parameters, surface electrocardiograms (ECG), echocardiography, Holter ECGs were performed.
Results: T-wave-peak-to-end interval and arrhythmogenic index significantly increased at the 240th minute of hemodialysis while did not change during hemodiafiltration. No malignant ventricular arrhythmias occurred, but number of ventricular premature beats was significantly higher during hemodialysis as compared to those during hemodiafiltration. Regarding hemodialysis a significant relationship was observed between the ratio of ventricular premature beats and arrhythmogenic index. Left ventricular mass index, septal-, posterior wall, inferior vena cava, left atrial diameters showed a positive correlation with T-wave-peak-to-end interval only in the case of hemodialysis. A negative correlation occurred between the left ventricular ejection fraction, T-wave-peak-to-end interval and arrhythmogenic index, moreover between serum sodium and T-wave-peak-to-end interval, arrhythmogenic index during hemodialysis.
Conclusions: Our results suggest that hemodialysis has unfavourable effect on the studied ECG parameters compared to hemodiafiltration.
Arrhythmias, repolarization, T wave, hemodialysis, hemodiafiltration
Abbreviations
AIX: Arrhythmogenic Index; ANOVA: Analysis of Variance; BMI: Body mass index; ECG: Electrocardiogram; EF: Ejection fraction; HD: Hemodialysis; HDF: Hemodiafiltration; kT/V: Number used to quantify hemodialysis treatment adequacy; QTc: QT interval; QTd: QT dispersion; Tpe: T-wave-peak-to-end interval.
Several studies have shown the increased susceptibility of developing ventricular arrhythmias during hemodialysis [1-3]. Cardiovascular mortality of patients on chronic hemodialysis accounts for more than 50% of the total mortality rate, and its frequency is 17 times higher when compared to the healthy population [4]. The incidence of ventricular arrhythmias leading to sudden cardiac death in patients on chronic hemodialysis program is approximately 1.4% to 25% [5,6]. Multiple factors account for the genesis of arrhythmias that include increased wall stress of the myocardium, altered catecholamine and baroreceptor sensitivity, ischaemic heart disease, uraemia, renal anaemia, hypertension, hyperlipidaemia, acidosis, and ionic imbalance [2,7]. Whereas hemodialysis eliminates small molecular weight uremic toxins by diffusion, hemodiafiltration eliminates higher molecular weight toxic polypeptides (characterized by β-2 microglobulin) by convective transport. In comparison to hemodialysis, the quality of life is superior and mortality rates are lower in the case of hemodiafiltration [8-12]. It is not cleared to what extent the changes in arrhythmogeneity are responsible for the observed beneficial clinical results. Previously, the prolongation of the QT and corrected QT interval (QTc), as measured on a surface ECG, has been shown to predict malignant ventricular arrhythmias and sudden cardiac death, also QT dispersion (QTd) was accepted to determine cardiac arrhythmogeneity [13-15]. A novel electrocardiographic marker, T-wave-peak-to-end interval has been reported to represent the transmural dispersion of repolarization of the left ventricle and the vulnerability to ventricular arrhythmias [16-18]. The prolongation of T-wave-peak-to-end interval has been proved to be associated with increased mortality rates in long QT syndrome, acute myocardial infraction, sleep apnoea [19,20] and hypertrophic cardiomyopathy [21]. Furthermore, the Tpe/QT ratio is used as an arrhythmogenic index of ventricular arrhythmogenesis [22]. It has been demonstrated that in patients with acquired QT syndrome the AIX is superior to QT interval and QT dispersion in the prediction of torsades de pointes ventricular tachycardia. Also, arrhythmogenic index was shown to be a valuable predictor of sudden cardiac death [21,23,24]. Throughout our work, we aimed to determine what effects hemodialysis and hemodiafiltration would have on T-wave-peak-to-end interval and AIX reflecting ventricular arrhythmogeneity.
Our study population consisted of thirty patients (18 males, 12 females, mean age 60.57 ± 13.62 years, range 23-85 years). Firstly, we collected and analysed the data of the patients while they were under hemodiafiltration over a period of three months and then the same patients were treated with conventional hemodialysis for at least another three months. This was followed, at the time of a regular hemodialysis, by another data collection. Patients were included who were suffering from end stage kidney disease (Stage 5) participating in regular hemodialysis program in our centre, and were willing to give their informed consent to take part in the study. Diseases that may affect cardiac pulse generation and conduction were exclusion criteria. Thus, subjects suffering from amyloidosis, sarcoidosis, carcinoid, hemochromatosis, diabetes mellitus or Parkinson’s disease were not involved in our study, furthermore, none of the patients had any history of atrial fibrillation. The causes of chronic renal failure in this patient population were the following: chronic glomerulonephritis (n=5), hypertensive and vascular nephropathy (n=12), chronic pyelonephritis (n=1), polycystic kidney disease (n=2), analgesic nephropathy (n=3), renal agenesis (n=1), lupus nephritis (n=2), and vasculitis (n=4). Clinical data of the study population are shown in Table 1.
Table 1. Clinical characteristics of the studied population.
Gender (male/female) |
18/12 |
Mean age (years) |
60.57 ± 13.62 |
Duration of renal replacement therapy (months) |
93.13 ± 70.09 |
Hypertension |
27/30 (90%) |
Myocardial infarction |
3/30 (10%) |
Ischemic heart disease |
3/30 (10%) |
Hyperlipidemia |
5/30 (16.7%) |
Twenty-one out of 30 patients took beta blockers during the examination period. Three patients were treated with carvedilol, 6 patients with nebivolol and 12 patients took metoprolol during the study. All patients gave informed consent to participate in the study and the Institutional Ethics Committee on Human Research approved the study protocol. The hemodialysis and hemodiafiltration were performed three times a week in 4-hour long sessions with Fresenius 4008 S and H machines (Fresenius Medical Care, Bad Homburg, Germany), and with Fx60 and Fx80 high-flux polysulfone dialyzers (Fresenius). During hemodiafiltration 15.16 ± 5 litres of ultrafiltrate was removed. The substitution fluid was prepared on-line from dialysis solution through a set of two membranes to purify it before infusing it directly into the blood line. The replacement solution was manufactured on-line from ultrapure water and consisted of 138 mmol/L sodium, 2 or 3 mmol/L potassium (in 13 cases 2 mmol/l in 17 cases 3 mmol/l), 1.5 mmol/L calcium, 0.5 mmol/L magnesium, and 1 g/L glucose. The blood flow was 338 ± 11.6 ml/min and did not differ significantly during the respective procedures (p<0.050). The bicarbonate buffered dialysis solution contained 138 mmol/L sodium, 2 or 3 mmol/L potassium (the same as the substitution solution), 1.5 mmol/L calcium, 0.5 mmol/L magnesium, and 1 g/L glucose. During the sessions no drugs other than isotonic sodium chloride and sodium heparin solutions were administered. The serum electrolyte levels were measured four times during the sessions and 2 hours afterwards. The arterial blood pressure was monitored non-invasively. ECGs were carried out five times in each case: at the beginning, in the 15th, 30th and the 240th minutes, and finally two hours after the end of the sessions. ECGs were recorded at 25 mm/sec recording speed (Hewlett Packard Page Writer 200i) while the patients were in the supine position breathing freely, and were not talking. Copies of the recordings were made with a magnifying factor of three. Three T-wave-peak-to-end interval and QT intervals were measured with callipers by one examiner in a blinded fashion in lead V6. QT interval was measured from the first electrical activity to the offset at the junction between the end of T wave deflection and the isoelectric line. The T-wave-peak-to-end interval was defined as the time between the highest point of the T wave and the intersection of the isoelectric line and the downslope of T wave. T-wave-peak-to-end interval was calculated as the average of the three T-wave-peak-to-end interval. Arrhythmogenic index was defined as the ratio of T-wave-peak-to-end interval and QT, where QT was defined as the longest of the three QT intervals measured in lead V6. Before and after the renal replacement therapy transthoracic echocardiography investigations (M-mode, 2 D) were carried out with a pulsed, and a continuous wave and tissue Doppler technique (Philips ATL HDI 5000 imaging system with a 3.5 MHz transducer). During the examinations the left atrium’s cross diameter was measured from the parasternal long-axis view, then, based on an apical four-chamber view, the Simpson’s method was used to determine the left ventricular ejection fraction (EF). Using the Devereux-Reichek formula the left ventricular mass index was calculated ({1.04 x [(end-diastolic diameter of the left ventricle + interventricular septum thickness + the posterior wall thickness of the left ventricle)3-end-diastolic diameter of the left ventricle3] -14}/height). The diameter of the inferior vena cava was measured from the subcostal view. Holter-ECGs (GE Medical SEER Light) were performed, where monitoring was started before the therapy and ended 24 hours afterwards. The number of ventricular premature beats was compared to the total number of beats and the resulting modulus was used to eliminate the variations arising from the short differences between the duration of the examinations. Statistical analyses were carried out with the help of SAS 8.2 for Windows. The variations of the investigated parameters over time and the differences between the two modalities were investigated by using analysis of variance (ANOVA). The correlations between the parameters were analysed by using the Pearson’s test when the distribution was normal and by Spearman’s rank test in the case of an abnormal distribution. Throughout the analysis the p <0.05 probability level was considered to be statistically significant. Data are presented as mean ± SD.
In the case of conventional hemodialysis T-wave-peak-to-end interval was found to be higher even at the beginning of the treatment compared to hemodiafiltration, although this difference did not reach a significant level. Furthermore, this tendency was detected during the whole period of the sessions. In the case of hemodialysis T-wave-peak-to-end interval increased at the 240th minute compared to the starting level (135.32 ± 29.08 msec vs. 102.64 ± 22.16 msec, p<0.001) and decreased 2 hours after completion of treatment (Figure 1). Similar significant changes were not present during hemodiafiltration. The arrhythmogenic index was found to increase constantly in the case of hemodialysis, and a significant lengthening appeared at the 240th minute compared to the baseline (0.26 ± 0.052 vs. 0.33 ± 0.08 p=0.004), while it showed a decrease two hours after finishing the treatment (Figure 2). During hemodiafiltration such significant changes were not explored. Left ventricular mass index developed to be in a positive correlation with T-wave-peak-to-end interval only in the case of hemodialysis (r=0.53, p=0.010), but non-significant positive tendency appeared regarding hemodiafiltration, too (r=0.13, p=0.479) (Figure 3). Both septal (r=0.48 p=0.002) and posterior wall (r=0.45, p=0.005) diameters showed a positive correlation with T-wave-peak-to-end interval only in the case of hemodialysis. Furthermore, left ventricular ejection fraction proved to correlate negatively with T-wave-peak-to-end interval and arrhythmogenic index during both renal replacement modalities, but significant correlation appeared only in the case of hemodialysis (T-wave-peak-to-end interval: r= -0.4, p=0.028; AIX: r= -0.49, p=0.006) (Figure 4 and 5). Although the diameter of the inferior vena cava measured at the beginning of the sessions showed a positive relationship with T-wave-peak-to-end interval in both treatment modalities, significant coherence was shown to be present only in the case of conventional hemodialysis (r= 0.43, p=0.019) (Figure 6). Also, positive significant correlation between the decrease in inferior vena cava diameter and T-wave-peak-to-end interval was demonstrated only in the case of hemodialysis (r=0.48, p=0.007). Moreover, left atrial cross diameter measured at the beginning of the sessions and T-wave-peak-to-end interval proved to correlate positively only in the case of hemodialysis (r=0.39, p=0.031) (Figure 7). A significant positive correlation between the decrease of left atrial cross diameter and T-wave-peak-to-end interval was present only in the case of conventional hemodialysis (r=0.37, p=0.041). Total calcium and ionized calcium showed an increase, while the potassium, magnesium and phosphate levels were significantly decreased in both therapies and there were no significant differences between the two modalities (data not elaborated). While hemodiafiltration did not modulate sodium levels, hemodialysis was associated with a decrease observed in the 15th (p=0.330) and 30th minutes (p=0.570) compared to the baseline levels. Serum sodium measured at the beginning of hemodialysis sessions showed a negative correlation both with T-wave-peak-to-end interval (r= -0.4, p=0.029) and arrhythmogenic index (r= -0.47, p=0.010). At the end of treatment the serum glucose concentration was found to be significantly increased in both modalities (at the beginning of the hemodialysis: 5.69 ± 1.16mmol/l; at the end: 6.81 ± 1.53 mmol/l, (p=0.008); at the beginning of the hemodiafiltration: 5.25 ± 0.72 mmol/l, at the end: 7.07 ± 1.58 mmol/l, (p<0.0001) and it was persistently elevated two hours after the end of treatment. However, no significant correlation appeared between the studied ECG markers and glucose concentration. Changes in ventricular rate - characterized by the RR cycle length- increased (from 798 ± 102.65 msec to 852±104.3 msec, p=0.005) at the 30th minute of hemodiafiltration, indicating a transient decrease of the heart frequency, and it then gradually decreased to the baseline after finishing the sessions. In the case of hemodialysis, the RR cycle length decreased significantly (800.6 ± 96.2 vs. 746.6 ± 125.5 msec, p=0.024) only 2 hours after treatment compared to the baseline. Regarding the blood pressure in both treatment modalities a rapid decrease occurred after the start of the sessions, which reached a significant level at the 15th minute (HDF systolic p=0.0001; HDF diastolic p=0.046; HD systolic p=0.0004; HD diastolic p=0.006). The systolic blood pressure did not change significantly after this, however, the diastolic values continued to increase even after the end of treatment compared to the baseline (HDF p=0.21, HD p=0.73). During hemodiafiltration the systolic and diastolic values were higher even at the initial stages, but the difference proved not to be significant. At the beginning there were no significant differences in left atrial diameter between the two treatment modalities, however, by the end a significant decrease was observed in the case of hemodiafiltration (p=0.0002). In contrast, similar changes were not found during hemodialysis (p=0.120). Regarding ECG markers and blood pressure no relevant relationship was observed. During hemodialysis the average kT/V value (a ratio used to quantify hemodialysis treatment adequacy) was 1.35 ± 0.17, while it was found to be 1.39 ± 0.21 during hemodiafiltration. Nevertheless, with regard to kT/V values no significant differences were found between the two modalities (p=0.30). During the different therapies praedialytic serum bicarbonate values were also determined. However, regarding these parameters no significant differences were evaluated (HD: 19.6 ± 2.1 vs. HDF: 20.7 ± 2.8; p=0.140). We adjusted the dialysate bicarbonate concentration individually in each cases in the range of 28-36 mmol/L aiming the plasma bicarbonate concentration of 20-22 mmol/L. Dialysate bicarbonate concentration was not changed during the study. Body weight and body mass index (BMI) decreased significantly in both modalities (the average BMI decrease in the case of hemodialysis: 24.39 ± 4.19 kg/m2 vs. 23.59 ± 4.2 kg/m2 p=0.0002, in the case of hemodiafiltration: 24.37 ± 4.12 kg/m2 vs. 23.6 ± 4.14 kg/m2, p=0.0002), nevertheless no significant relationship was observed between BMI and the electrocardiographic parameters. Body weight of the patients decreased significantly in both therapies (hemodialysis: 67.47 ± 14.44 kg vs. 65.3 ± 14.74 kg p=0.0001, hemodiafiltration: 67.4 ± 14.35 kg vs. 65.29 ± 14.33 kg, p=0.0001). No malignant ventricular arrhythmias occurred, but the number of ventricular premature beats (recorded by 24h-Holter ECG) was significantly higher during hemodialysis (HDF: 183.1 ± 476.2 vs HD: 256.2 ± 656.9; p=0.018). Furthermore, the ratio of ventricular premature beats to the total number of heart beats differed significantly (p=0.019). A significant positive relationship appeared between the ratio of ventricular premature beats and arrhythmogenic index in the case of hemodialysis (r=0.37, p=0.04) (Figure 8). The left ventricular ejection fraction correlated negatively with the number of ventricular premature beats in both treatment modalities (HDF r=-0.55, p=0.0015, HD r=-0.36, p=0.046).
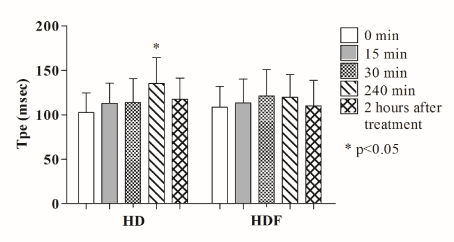
Figure 1. Changes in T peak-end interval (Tpe) during hemodialysis and hemodiafiltration. T peak-end interval showed a significant lengthening at 240th minute only in the case of conventional hemodialysis. HD: hemodialysis, HDF: hemodiafiltration, * p < 0.05.
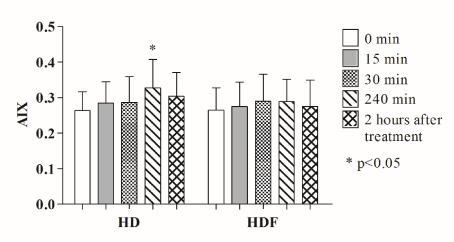
Figure 2. Changes in arrhythmogenic index (AIX) during hemodialysis and hemodiafiltration. A significant prolongation is shown at 240th minute of conventional hemodialysis, while no significant changes were observed in the case of hemodiafiltration. HD: hemodialysis, HDF: hemodiafiltration, * p<0.05.
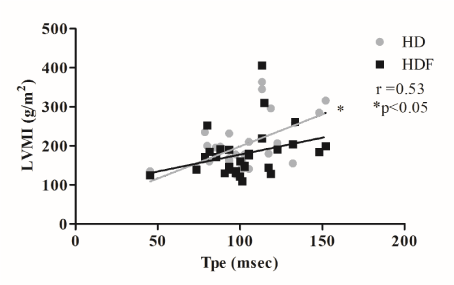
Figure 3. The correlation between T peak-end interval (Tpe) and left ventricular mass index (LVMI). Significant positive correlation occurred only in the case of hemodialysis. HD: hemodialysis, HDF: hemodiafiltration, * p<0.05.
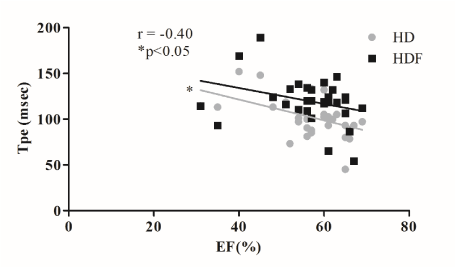
Figure 4. Left ventricular ejection fraction (EF) showed a significant negative correlation with T peak-end interval (Tpe) only in the case of hemodialysis. HD: hemodialysis, HDF: hemodiafiltration, * p<0.05.
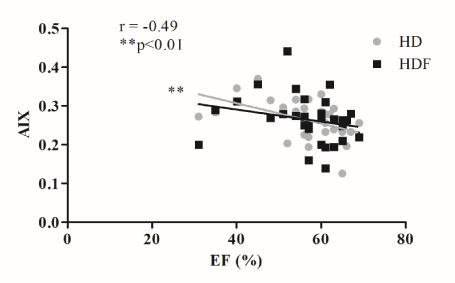
Figure 5. A significant negative correlation was observed between arrhythmogenic index (AIX) and left ventricular ejection fraction (EF) only in the case of hemodialysis. HD: hemodialysis, HDF: hemodiafiltration, ** p<0.01.
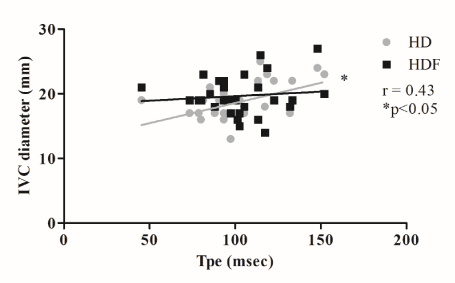
Figure 6. Diameter of the inferior vena cava measured at the beginning of the sessions is shown to correlate significantly with T peak-end inteval (Tpe) only in the case of hemodialysis. HD: hemodialysis, HDF: hemodiafiltration, IVC: inferior vena cava, * p<0.05.
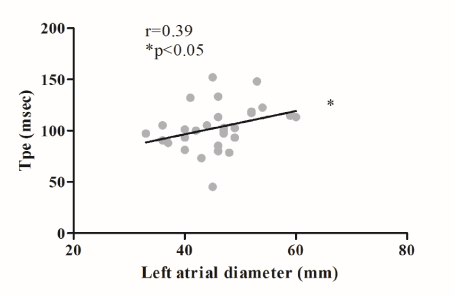
Figure 7. Left atrial cross diameter measured at the beginning of the renal replacement therapies showed a positive correlation with T peak-end interval (Tpe) in the case of hemodialysis. HD: hemodialysis, * p<0.05.
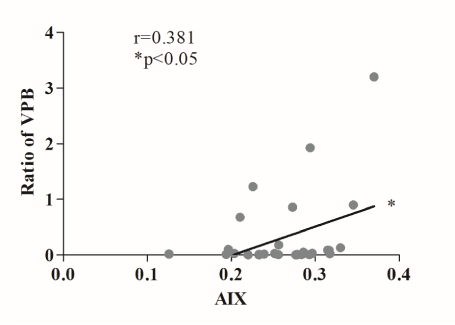
Figure 8. A significant positive relationship appeared between the ratio of ventricular premature beats and arrhythmogenic index in the case of hemodialysis. HD: hemodialysis, *p<0.05.
The mortality rate of patients participating hemodiafiltration programs is 35% lower in comparison to patients on conventional hemodialysis programs [25,26]. It has been demonstrated, that in the case of hemodiafiltration the clearance of small- and medium- molecular weight substances is significantly higher compared to that of conventional hemodialysis [27-30]. By reducing the beta-2 microglobulin concentration hemodiafiltration attenuates the incidence of amyloidosis by approximately 50% [31-35]. Furthermore, during hemodiafiltration oxidative stress is reduced and the lipid profile improves. Moreover, the suppression of inflammatory reactions may contribute to the positive changes in the frequency of anaemia [26,36]. Besides the numerous known factors, it might be also concluded that the patients receiving hemodiafiltration for their renal diseases were able to enjoy benefits resulting from the slower progression of the cardiac target organ damage as shown by Ohtake et al. [37]. In our present study we aimed to determine the changes of certain electrocardiographic markers during hemodiafiltration and conventional hemodialysis [38,39]. Previous studies have shown that T-wave-peak-to-end interval and AIX represent increased ventricular repolarization. Since altered dispersion of repolarization predisposes to ventricular arrhythmias and sudden cardiac death, these electrocardiographic markers can play a role in the prevention and treatment of cardiac dysrhythmias. According to our results changes in T-wave-peak-to-end interval and AIX occurred only in the case of hemodialysis which reflects an increased susceptibility of ventricular repolarization and an altered disposition to ventricular arrhythmias. However, malignant ventricular arrhythmias were not observed in any one of the modalities applied, ventricular premature beats appeared significantly more often during hemodialysis. Regarding arrhythmogenic index and the ratio of ventricular premature beats a positive correlation occurred only in the case of hemodialysis. These findings indicate the increased risk of ventricular dysrhythmias in the case of conventional hemodialysis. The possible reasons for the differences with regard to electrocardiographic parameters observed between the two modalities even at the beginning of treatments have not been clearly understood yet. Interestingly, left ventricular mass and electrocardiographic markers showed a significant relationship only in the case of hemodialysis, which may represent the increased arrhythmogenic potential of conventional therapy in patients with ventricular hypertrophy. The relationship between the left ventricular systolic dysfunction and the tendency to ventricular arrhythmias has been confirmed also in the case of hemodialysis. However a negative tendency between systolic function and electrocardiographic markers was found also during hemodiafiltration, which did not reach the level of significance. Thus, it can be concluded that left ventricular dysfunction seems to have a more definitive effect on ventricular repolarization in the case of hemodialysis compared to the convective treatment. Both left atrial cross diameter and the diameter of the inferior vena cava measured at the beginning of the sessions appeared to correlate significantly only in the case of hemodialysis. This phenomenon attracts the attention to the importance of the alteration between the dynamicity of volume removal during renal replacement therapies; also it could be the result of the differences between the intravascular and intracardiac dynamics of the volume state between the two renal replacement modalities. Importantly, no significant difference appeared between the total volume removal between hemodialysis and hemodiafiltration. Also, the increase in ventricular frequency, observed only during hemodialysis suggests a variation in intravascular volume changes between hemodialysis and hemodiafiltration. A degree of similarity between the total volume removals might be indicated by the kinetics in the changes of blood pressure. The possible reasons for the significant differences observed between the two modalities even at the beginning of treatments have not been clearly established and require further investigations. Changes in serum sodium concentration proved to significantly correlate with T-wave-peak-to-end interval only in the case of hemodialysis, therefore, the favourable effects seen during hemodiafiltration could also be the consequence of a more efficiently balanced sodium concentration and the smoother, but more efficient changes in osmotic conditions and volume depletion. Another plausible explanation is the potent antioxidant and anti-inflammatory effect, and also the more efficient removal of the small-and medium-molecular-weight materials and uremic toxins that could be observed during hemodiafiltration. Importantly, drug therapy remained unchanged in the whole investigation time interval. Therefore, we conclude that the described differences between the two modalities were certainly not caused by drug therapies. According to our results we conclude that hemodiafiltration has a disparate effect on the studied arrhythmia markers of the surface electrocardiogram compared to hemodialysis.
These clinical investigations were performed on an appropriate professional standard. We applied adequate technical methods to determine electrocardiographic, echocardiographic and laboratory parameters. The level of significance and the statistical power of our data were supported by appropriately chosen statistical tests.
The number of the studied patients was relatively small in our study, however all patients suitable for clinical investigations were enrolled from our centre. Further clinical examinations involving a larger study population may help to clarify the role of different renal replacement therapies on ventricular arrhythmogeneity in the future. The determination of long term effects of hemodiafiltration on cardiac arrhythmias was not possible during the present study, therefore further investigations are needed to get a clearer picture on this issue. Our results apply only to our selected group of patients with a low frequency of coronary artery disease.
Our research project was sponsored by the TÁMOP-4.2.2.A-11/1/KONV-2012-0045 and TÁMOP-4.2.6-151-2015-0001 projects. These projects are implemented through the New Hungary Development Plan, co-financed by the European Union and the European Social Fund.
Ethics
The examinde patients gave informed consent to participate in the study and the Institutional Ethics Committee on Human Research approved the study protocol. Identification number of our protocol: DEOEC RKEB/IKEB Prot. No. 2888 -2008. We attach the permission of the Ethics Committee and the consent to participate in Hungarian as a supplementary material.
Consent to publish
Our manuscript does not contain individual person’s data in any form (including individual details, images or videos) so consent to publish was not requested.
Competing interestsNone of the authors have relationship with companies that may have a financial or non-financial interest in the information contained in the manuscript.
AP: have made substantial contributions to conception and design; has taken part in the examination and management of the patients and has drafted the manuscript. VS: has taken part in acquisition of data, analysis and interpretation of data; has taken part in the examination and management of the patients and has drafted the manuscript. ÁC: has taken part in acquisition of data, analysis and interpretation of data; has taken part in the examination and management of the patients and has drafted the manuscript. GB: has taken part in acquisition of data, analysis and interpretation of data; has taken part in the examination and management of the patients. AA: has made substantial contributions to conception and design, has been involved in revising the manuscript critically for important intellectual content. ZA: has been involved in revising the manuscript critically for important intellectual content. IL: has made substantial contributions to conception and design and has been involved in revising the manuscript critically for important intellectual content. GyP: has made substantial contributions to conception and design, and has given final approval of the version to be published. JB: has made substantial contributions to conception and design and has been involved in revising the manuscript critically for important intellectual content. ZSz: has made substantial contributions to conception and design; has taken part in the examination and management of the patients and has drafted the manuscript. All authors have read and approved the final manuscript.
- Abe S, Yoshizawa M, Nakanishi N, Yazawa T, Yokota K, et al. (1996) Electrocardiographic abnormalities in patients receiving hemodialysis. Am Heart J 131: 1137-44. [Crossref]
- Morrison G, Michelson EL, Brown S, Morganroth J (1980) Mechanism and prevention of cardiac arrhythmias in chronic hemodialysis patients. Kidney Int 17: 811-819. [Crossref]
- Shapira OM, Bar-Khayim Y (1992) ECG changes and cardiac arrhythmias in chronic renal failure patients on hemodialysis. J Electrocardiol 25: 273-279. [Crossref]
- Meier P, Vogt P, Blanc E (2001) Ventricular arrhythmias and sudden cardiac death in end-stage renal disease patients on chronic hemodialysis. Nephron 87: 199-214. [Crossref]
- Fantuzzi S, Caico S, Amatruda O, Cervini P, AbuTurky H, et al. (1991) Hemodialysis-associated cardiac arrhythmias: a lower risk with bicarbonate? Nephron 58: 196-200. [Crossref]
- Santoro E, Rochetti M (1988) Multicentre, cross-sectional study of ventricular arrhythmias in chronically haemodialysed patients. Gruppo Emodialisi e Patologie Cardiovasculari. Lancet 2: 305-9. [Crossref]
- Parfrey PS, Foley RN, Harnett JD, Kent GM, Murray DC, et al. (1996) Outcome and risk factors for left ventricular disorders in chronic uraemia. Nephrol Dial Transplant 11: 1277-1285. [Crossref]
- Canaud B, Bragg-Gresham JL, Marshall MR, Desmeules S, Gillespie BW, et al. (2006) Mortality risk for patients receiving hemodiafiltration versus hemodialysis: European results from the DOPPS. Kidney Int 69: 2087-93. [Crossref]
- Canaud B, Chenine L, Henriet D, Leray H (2008) Online hemodiafiltration: A multipurpose therapy for improving quality of renal replacement therapy. Contrib Nephrol 161: 191-98. [Crossref]
- Schmid H, Schiffl H (2012) Hemodiafiltration and survival of end-stage renal disease patients: the long journey goes on. Int Urol Nephrol 44: 1435-1440. [Crossref]
- Vanholder R, Meert N, Schepers E, Glorieux G (2008) From uremic toxin retention to removal by convection: do we know enough? Contrib Nephrol 161: 125-131. [Crossref]
- Zabel M, Klingenheben T, Franz MR, Hohnloser SH (1998) Assessment of QT dispersion for prediction of mortality or arrhythmic events after myocardial infarction: results of a prospective, long-term follow-up study. Circulation 97: 2543-2550. [Crossref]
- Day CP, McComb JM, Campbell RW (1990) QT dispersion: an indication of arrhythmia risk in patients with long QT intervals. Br Heart J 63: 342-344. [Crossref]
- Puddu PE, Bourassa MG (1986) Prediction of sudden death from QTc interval prolongation in patients with chronic ischemic heart disease. J Electrocardiol 19: 203-211. [Crossref]
- Sra J, Dhala A, Blanck Z, Deshpande S, Cooley R, et al. (1999) Sudden cardiac death. Curr Probl Cardiol 24: 461-538. [Crossref]
- Antzelevitch C (2007) Role of spatial dispersion of repolarization in inherited and acquired sudden cardiac death syndromes. Am J Physiol Heart Circ Physiol 293: H2024-2038. [Crossref]
- Kors JA, Ritsema van Eck HJ, van Herpen G (2008) The meaning of the Tp-Te interval and its diagnostic value. J Electrocardiol 41: 575-580. [Crossref]
- Sicouri S, Antzelevitch C (1991) A subpopulation of cells with unique electrophysiological properties in the deep subepicardium of the canine ventricle. The M cell. Circ Res 68: 1729-41. [Crossref]
- Haarmark C, Hansen PR, Vedel-Larsen E, Pedersen SH, Graff C, et al. (2009) The prognostic value of the Tpeak-Tend interval in patients undergoing primary percutaneous coronary intervention for ST-segment elevation myocardial infarction. J Electrocardiol 42: 555-60. [Crossref]
- Kilicaslan F, Tokatli A, Ozdag F, Uzun M, Uz O, et al. (2012) Tp-e interval, Tp-e/QT ratio, and Tp-e/QTc ratio are prolonged in patients with moderate and severe obstructive sleep apnea. Pacing Clin Electrophysiol 35: 966-972. [Crossref]
- Shimizu M, Ino H, Okeie K, Yamaguchi M, Nagata M, et al. (2002) T-peak to T-end interval may be a better predictor of high-risk patients with hypertrophic cardiomyopathy associated with a cardiac troponin I mutation than QT dispersion. Clin Cardiol 25: 335-9. [Crossref]
- Gupta P, Patel C, Patel H, Narayanaswamy S, Malhotra B, et al. (2008) T(p-e)/QT ratio as an index of arrhythmogenesis. J Electrocardiol 41: 567-574. [Crossref]
- Topilski I, Rogowski O, Rosso R, Justo D, Copperman Y, et al. (2007) The morphology of the QT interval predicts torsade de pointes during acquired bradyarrhythmias. J Am Coll Cardiol 49: 320-28. [Crossref]
- Yamaguchi M, Shimizu M, Ino H, Terai H, Uchiyama K, et al. (2003) T wave peak-to-end interval and QT dispersion in acquired long QT syndrome: a new index for arrhythmogenicity. Clin Sci (Lond) 105: 671-676. [Crossref]
- Canaud B, Bosc JY, Leray-Moragues H, Stec F, Argiles A, et al. (2000) Online hemodiafiltration. Safety and efficacy in long-term clinical practice. Nephrol Dial Transplant 15: 60-7. [Crossref]
- Locatelli F, Marcelli D, Conte F, Limido A, Malberti F, et al. (1999) Comparison of mortality in ESRD patients on convective and diffusive extracorporeal treatments. The Registro Lombardo Dialisi E Trapianto. Kidney Int 55: 286-93. [Crossref]
- Canaud B, Wizemann V, Pizzarelli F, Greenwood R , Schultze G, et al. (2001) Cellular interleukin-1 receptor antagonist production in patients receiving on-line hemodiafiltration therapy. Nephrol Dial Transplant 16(11): 2181-87. [Crossref]
- Kerr PB, Argilés A, Flavier JL, Canaud B, Mion CM (1992) Comparison of hemodialysis and hemodiafiltration: a long-term longitudinal study. Kidney Int 41: 1035-1040. [Crossref]
- Spalding EM, Chamney PW, Farrington K (2002) Phosphate kinetics during hemodialysis: Evidence for biphasic regulation. Kidney Int 61: 655-67. [Crossref]
- Zehnder C, Gutzwiller JP, Renggli K (1999) Hemodiafiltration a new treatment option for hyperphosphatemia in hemodialysis patients. Clin Nephrol 52: 152-159. [Crossref]
- Deppisch RM, Beck W, Goehl H, Ritz E (2001) Complement components as uremic toxins and their potential role as mediators of microinflammation. Kidney Int Suppl 78: 271-77. [Crossref]
- Koda Y, Nishi S, Miyazaki S, Haginoshita S, Sakurabayashi T, et al. (1997) Switch from conventional to high-flux membrane reduces the risk of carpal tunnel syndrome and mortality of hemodialysis patients. Kidney Int 52: 1096-101. [Crossref]
- Panichi V, Paoletti S, Consani C (2008) Inflammatory pattern in hemodiafiltration. Contrib Nephrol 161: 185-190. [Crossref]
- Schwalbe S, Holzhauer M, Schaeffer J, Galanski M, Koch KM, et al. (1997) Beta 2-microglobulin associated amyloidosis: A vanishing complication of long-term hemodialysis? Kidney Int 52: 1077-83. [Crossref]
- van Tellingen A, Grooteman MP, Schoorl M, Bartels PC, Schoorl M, et al. (2002) Intercurrent clinical events are predictive of plasma C-reactive protein levels in hemodialysis patients. Kidney Int 62: 632-38. [Crossref]
- Bonforte G, Grillo P, Zerbi S, Surian M (2002) Improvement of anemia in hemodialysis patients treated by hemodiafiltration with high-volume on-line-prepared substitution fluid. Blood Purif 20: 357-63. [Crossref]
- Ohtake T, Oka M, Ishioka K, Honda K, Mochida Y, et al. (2012) Cardiovascular protective effects of on-line hemodiafiltration: comparison with conventional hemodialysis. Ther Apher Dial 16: 181-88. [Crossref]
- Blankestijn PJ, Vos PF, Rabelink TJ, van Rijn HJ, Jansen H, et al. (1995) High-flux dialysis membranes improve lipid profile in chronic hemodialysis patients. J Am Soc Nephrol 5: 1703-1708. [Crossref]
- Ward RA, McLeish KR (2003) Oxidant stress in hemodialysis patients: what are the determining factors? Artif Organs 27: 230-236. [Crossref]