In this work we report the investigation of the optical and structural properties of polyaniline carboxymethyl cellulose thin film. By using in situ polymerization technique, thin films of PANI CMC were synthesized at various deposition time of 40 seconds, 80 seconds and 120 seconds from an ink solution. The thin films were characterized by UV-VIS spectroscopy and scanning electron microscopy. The optical properties revealed that PANI CMC has absorption peaks at 340 nm and 800 nm. The absorption peak exhibited by the films around 340 nm can be attributed to the electron transition from the highest occupied molecular orbital (HOMO) to the lowest unoccupied molecular orbital (LUMO) corresponding to the π → π* electronic transition while The peak at about 800 nm (polaron - π*) corresponds to molecular excitation transition and the conducting phase of the polyaniline. The band gad energy at 2.7 eV corresponds to the emission of polymer in the solid state and demonstrating the optical properties of the polymer. SEM analysis indicates the films are porous to an extent with the formation of some particles on its surface
polyaniline, carboxymethyl cellulose, UV-vis absorption, optical properties
Polyaniline is an intrinsic conducting polymer existing in three stable oxidizing states namely leucoemeraldine, pernigraniline and emeraldine. It has attracted considerable attention for its unique properties. It has good mechanical flexibility, environmental stability, ease of synthesis and tunable conductivity which can be controlled with an acid/base doping or dedoping [1]. It has potential applications in fields such as anticorrosion shield devices, electronic display and sensor, electromagnetic shielding devices, lightweight battery electrodes, organic light emitting diodes, plastic solar cell, optoelectronic devices among others [2-7].
In this present work we report the preparation and deposition of a conducting polymer Polyaniline carboxymethyl cellulose thin film on a glass slide. The thin films were made by in situ deposition technique from two ink solutions A and B. The deposition time was varied at 40 seconds, 80 seconds and 120 seconds. Water was used as the solvent rinsing solution. These films were further investigated for their optical and structural properties using UV-Visible absorption spectroscopy and SEM respectively. The thickness of the film was also measured using a profilometer.
Preparation of ink solution A
The beaker was first rinsed with distilled water and 50 ml of water was added into the beaker, 2.469 M of Aniline was weighed using electronic balance and put in the beaker, 6.515 M of glycerol, 0,02 M of sodium lauryl sulphate (SLS), 2.465 M of H2SO4 and 0.567 M of CMC were equally poured into the same beaker also and stirred using the magnetic stirrer for few seconds. Water was added to make up 150 ml. Thus given solution A.
Preparation of ink solution B
The beaker was first rinsed with distilled water and 50 ml of water was added into the beaker, 0.876 M of potassium dichromate was measured and put in the beaker. 0.52 M of glycerol was equally measured and put in the beaker, this was stirred for few seconds using the magnetic stirrer. And this resulted to solution B.
Preparation of polyaniline carboxymethyl cellulose (PANI CMC) thin film
The PANI CMC- thin film was synthesized by in situ polymerization technique. The slide was cleaned by rinsing with distilled water and allowed to dry. 3 drops of stock A was dropped on the slide, followed by a drop of stock B and allowed to stand for 40 seconds, 80 seconds and 120 seconds respectively before rinsing off with water. This was repeated again to make two cycles and a third time to make three cycles and thus we have three samples with three deposition time and labelled W3 40s, 80s, and 120s respectively.
Characterization
The optical properties of the prepared PANI CMC thin film were obtained using ultraviolet spectroscopy (Axiom medical Ltd. UK, UV 752). The microstructure (surface) morphology characterization of the samples was achieved using SEM (PRO: X: Phenom number: 800 – 07334).
The thickness of the thin film was determined using profilometer. The profilometry tool was based on contact measurement of the sample.
The resulting investigation include optical analysis, absorption spectra, optical transmission, reflectance studies among others.
Optical analysis of PANI CMC thin film
The study of the optical properties of PANI CMC grown at varying deposition time with water as solvent rinsing solution was done using UV-visible spectrophotometer at the wavelength range of 230-1100 nm at an interval of 20 nm.
Absorption spectra
The absorption spectra of the material are displayed in Figure 1.
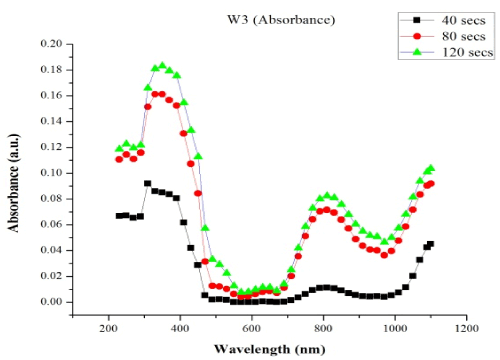
Figure 1. Absorption spectra of W3 samples at different time intervals
The absorbance values of PANI CMC are plotted against wavelength for different time intervals. The PANI CMC was observed to exhibit poor absorption of electromagnetic radiation throughout the UV/VIS region of the electromagnetic spectrum. The absorption increased slightly as the deposition time increases from 40 seconds to 120 seconds, the absorption values were between 0.00% and 18.31%.
From Figure 1, absorption peaks are recorded around 340 nm and 800 nm in all cases of deposition, the peak at 340 nm can be attributed to the electron transition from the highest occupied molecular orbital (HOMO) to the lowest unoccupied molecular orbital (LUMO) corresponding to the π → π* electronic transition [8-10]. The peak at about 800 nm corresponds to conducting phase of the polyaniline and also the polaron and bipolaron band transition respectively. These results agree with previous works of [8-10].
Optical transmission spectra
The transmission spectra of the films are shown in Figure 2.
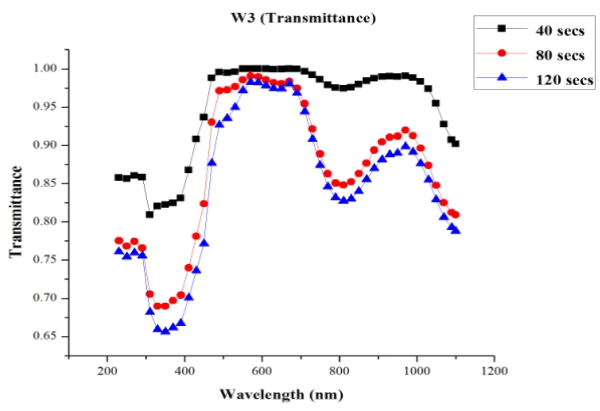
Figure 2. Transmission spectra for W3 samples at different deposition time
The transmittance values were plotted against wavelength for all the deposited films. From Figure 2 all the films had high transmission of radiation, with the highest transmission observed in the visible region for all the films. Time variation was observed to have a significant effect on transmittance of the films, as the films’ transmittance decreased with a corresponding increase of deposition time. The films deposited at 40 seconds had transmittance between 0.8093 (80.93%) and 1.00 (100%). At 80 seconds, film transmittance ranged from 0.6898 (68.98%) to 0.9908 (99.08%) while at 120 seconds deposition time, film transmittance was between 0.6560 (65.60%) and 0.9824 (98.24%). High transmittance of about 80% for polymeric materials has previously been reported by Alias [11].
The general high transmission displayed by the films in all cases of investigation suggests its suitability in optoelectronics applications.
Reflectance studies
The reflection values of the PANI CMC samples were plotted against wavelength for different time variations and are revealed in Figure 3.
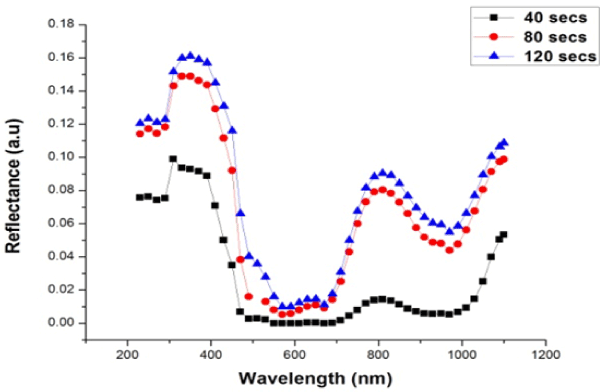
Figure 3. Reflectance of W3 samples plotted against wavelength for different time variation
From Figure 3 the films show significant increase in response to increase in deposition time. For the W3 samples, reflectance was between 0.00 (0%) and 0.1609 (16.09%), all the films at different deposition exhibited poor reflectance of electromagnetic radiation.
Absorption coefficient studies
The absorption coefficient values for all deposited films were plotted against photon energy and are given as shown in Figure 4.
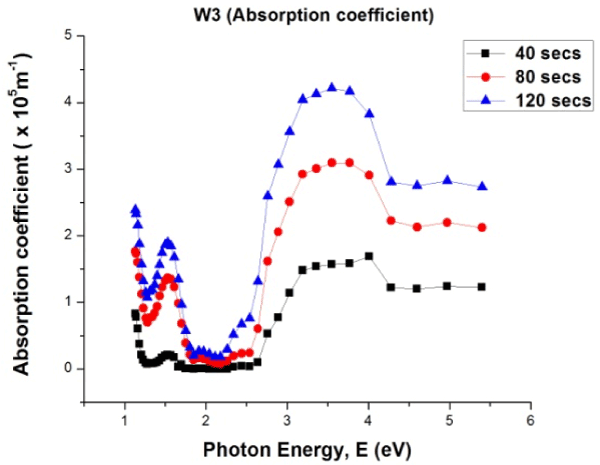
Figure 4. Absorption coefficient values of W3 samples versus photon energy
In Figure 4 the absorption coefficient values improved as deposition time increases. Absorption coefficient values are in the order of 105. In all cases of deposition, absorption coefficient values are higher at high photon energies (3 eV and above). The implication of this is that absorption of more photons will improve the absorbance of the material.
Refractive index studies
The refractive index of the material was plotted against photon energy for different time variations as indicated in Figure 5.
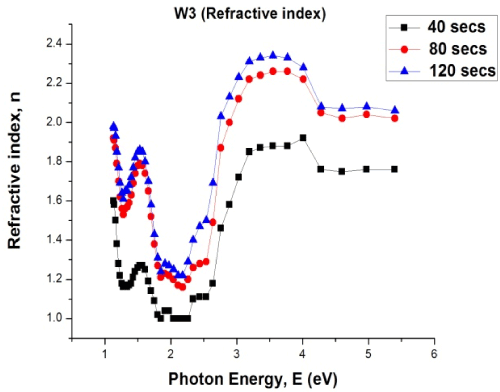
Figure 5. Plot of refractive index versus photon energy for W3 samples
From Figure 5 refractive index (R.I.) values of the material were observed to improve substantially as the time of deposition is increased from 40 seconds to 120 seconds. For the W3 samples, refractive index ranged from 1.00 to 1.92 at 40 seconds deposition time, 1.16 to 2.26 (80 seconds) and 1.22 to 2.34 (120 seconds).
In all cases of time variations, the material had higher R.I. values at high photon energies. This implies that as the material absorbs more photons, the refractive index is improved. High refractive index values suggest the material’s usefulness in optoelectronics applications.
Optical conductivity
Figure 6 displays the optical conductivity of the PANI CMC material plotted against photon energy.
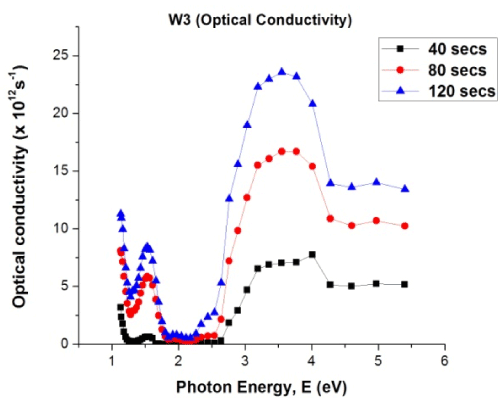
Figure 6. Plot of optical conductivity versus photon energy for W3 samples
The optical conductivity of the material was observed to increase substantially as the deposition time progresses from 40 seconds to 120 seconds. For lower photon energies (less than 3 eV), optical conductivity was smaller when compared to values obtained for higher photon energies (above 3 eV). The optical conductivity of the material increases in response to an increase in time variations. The optical conductivity for the W3 samples is in the order of 1012. The material possessed very high optical conductivity, which gives the material credence in optical and optoelectronics applications.
Extinction coefficient studies
The extinction coefficient values of the PANI CMC material were plotted at different time variations against photon energy as depicted in Figure 7.
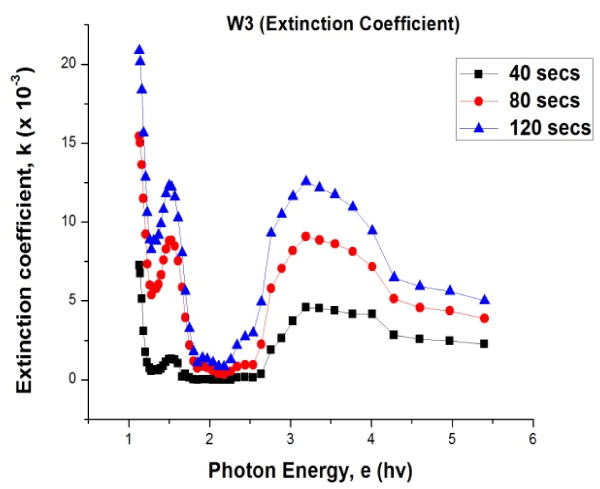
Figure 7. Plot of extinction coefficient values versus photon energy for W3 sample
From Figure 7 the extinction coefficient of the PANI CMC material has a linear relationship with the time variation. That is, as the deposition time increases, there was a corresponding increase in the extinction coefficient. The extinction coefficient varies between 0.0 and 20.874 x 10⁻³, the material was observed to have very low values of extinction coefficient. Low values of extinction coefficient confirm high transparency of the material [12].
Band gap energy
To obtain the band gap energy of the PMC material, (αhv)2 values were plotted against photon energy for different time variations as depicted in Figure 8.
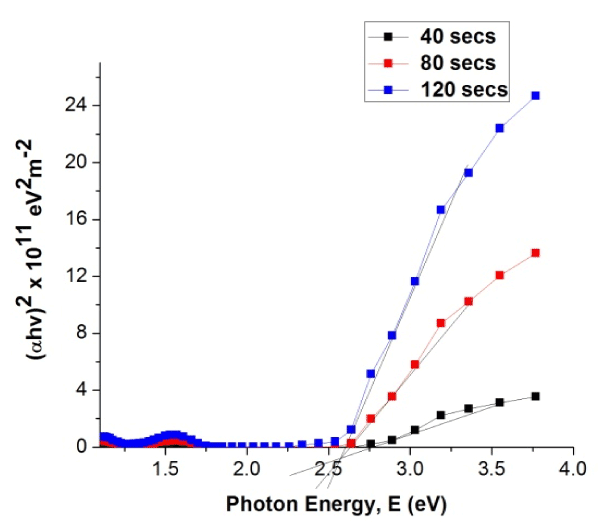
Figure 8. Plot of (αhv)2 versus photon energy for W3 samples
From Figure 8 the band gap energy of the PANI CMC material was obtained by extrapolating the linear portion of the curve to the point on the horizontal axis where (αhv)2 is zero.
From Figure 8, the band gap ranged between 2.60 eV and 2.75 eV, which corresponds to the emission of polymer in the solid state demonstrating the optical properties of the polymer [5] This may be useful for finding applications in electrochromic and optoelectronic devices [7]. The band gap energy of the PANI CMC material decreases as deposition time increases from 40 seconds to 120 seconds.
The band gap energies obtained for the PANI CMC material at different time variations are shown in Table 1.
Scanning electron microscopy studies
The SEM picture of the PANI CMC film is shown below in Figure 9
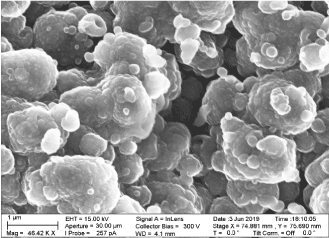
Figure 9. SEM micrograph of W3 samples at deposition time of 80 second
From Figure 9 the film obtained at deposition time of 80 seconds the shows that the composite is highly microporous with clumped spherical morphology [12].
Variation of thickness of the samples
The different thicknesses obtained for the samples washed with water and propanol are displayed in Table 1.
Table 1. Variation of band gap of W3 samples with time
|
Deposition Time
(Seconds)
|
Band gap energy (eV)
|
|
40
|
2.75
|
|
80
|
2.65
|
|
120
|
2.60
|
From Table 2, the thickness of the material decreases with increase in deposition time and the range is between 10,000 Å and 12,500 Å.
Table 2. Variation of thickness of W3 samples with time
|
Time
(Seconds)
|
Thickness
(Å)
|
|
40
|
12,500
|
|
80
|
12,000
|
|
120
|
10,000
|
In situ polymerization technique was successfully used to grow polyaniline carboxymethyl cellulose films at different deposition time. Optical studies conducted on the PANI-CMC films indicate that the films are highly transparent in the visible region of the electromagnetic spectrum. Absorption peaks evident around 340 nm and 800 nm indicates the electron transition from the highest occupied molecular orbital (HOMO) to the lowest unoccupied molecular orbital (LUMO) corresponding to the π → π* electronic transition (transmission of benzenoid ring) and polaron- π* corresponding to molecular excitation transition. The band gap energy at 2.7 eV corresponds to the emission of the polymer in the solid state and demonstrating the optical properties of the polymer. SEM analysis indicates the films are porous to an extent with the formation of some particles on its surface.
- Zhang D, Wang Y (2006) Synthesis and applications of one-dimensional nanostructured polyaniline: An overview. Materials Science and Engineering B 134: 9-19.
- Virji S, Huang J, Kaner RB, Weille BH (2004) Polyaniline nanofiber gas sensors: Examination of response mechanisms. Nano Letters 4: 491-496.
- Saini P, Choudhary V, Singh BP, Mathur RB, Dhawan SK (2009) Polyaniline-MWCNT nanocomposites for microwave absorption and EMI shielding. Materials Chemistry and Physics 113: 919-926
- Kotresh S, Ravikiran YT, Raj Prakash HG, Ramana CH, Vijayakumari SC, et al. (2016a) Humidity sensing performance of spin coated polyaniline-carboxymethyl cellulose composite at room temperature. Cellulose 23: 3177-3186.
- Amer NJ, Kamarulazizi I, Nasser MA (2015) synthesis and characterization thin film of conductive polymer (PANI) for optelectronic device application. International conference on Nano-electronic Technology Devices on materials. AIP Conference Proceeding 1733.
- Ghanbari KH, Mousavi MH, Shamsipur M, Karami H (2007) Synthesis of polyaniline/graphite composite as a cathode of Zn-polyaniline rechargeable battery. J Power Sources 170: 513-519.
- Sharma ID, Saino PU, Sharm VK (2013) Structural, optical, morphological and electrical characteristics of polyaniline for device applications. Indian Journal of Engineering and Material Sciences 20: 145-149
- Kulkami MV, Sonali DN, Jalinder D, Ambelear S, Bharat BU (2012) Inkjet printed conducting polyaniline base flexible humidity sensor. The 14th International Meeting on Chemical Sensors pp: 1112-1115.
- Kulkarni MV, Viswanath AK, Marimuthu R, Seth T (2004) Synthesis and characterization of polyaniline doped with organic acids. J Polym. Sci A 42: 2043-2049.
- Tissera ND, Wijesena RN, Rathnayake S, De Silva RM, De Silva KMN (2018) Heterogeneous in situ polymerization of polyaniline (PANI) nanofibers on cotton textiles. Carbohydr Polym 186: 35-44.
- Alias AN, Zabidi ZM, Ali AMM, Harun MK (2013) Optical Characterization and properties of polymeric materials for optoelectronic and photonic applications. International Journal of Applied Science and Technology 3: 11- 37.
- Amatalo I (2014) Fabrication and characterization of Al/ZnSE Film Schttky diode. Unpublished M.Sc Project Kenyatta University, Kenya.