Background: The new coronavirus, severe acute respiratory syndrome coronavirus 2 (SARS-CoV-2), which causes COVID-19 disease, was detected on December 31, 2019 in Wuhan, China. Brazil has the second highest number of recorded cases, and the sixth highest numbers of deaths caused by COVID-19, as of May 28, 2020. This study present a model epidemiological survey to detect the prevalence of SARS-CoV-2 and to demonstrate a new health technology tool, whose use could be extended to other parts of Brazil.
Methods: To describe the study location, selected population, biological sample collection and laboratory treatment, and the development of a technological health tool, MonitoraSUS. These events make up the structure of an epidemiological survey model.
Authors' consideration: We believe that the data released in official epidemiological bulletins does not reflect the real number of infected people in the population. The application of this model epidemiological survey can show the actual prevalence of the disease. In order to do this, our group developed a new technological tool that could be used to record and analyze data on the sociodemographic characteristics, comorbidities, and geolocation of patients with the outcomes.
Conclusion: The use of this epidemiological survey model is an effective, and inexpensive strategy to measure the prevalence of confirmed cases of COVID-19, and can contribute to improved outcomes for the population by providing a better understanding of the distribution of the disease, and allowing more effective social distancing measures to be put in place.
SARS-CoV-2, COVID-19, epidemiological survey
In late December 2019, a novel coronavirus strain started to be reported in Wuhan City, Hubei Province, China [1,2]. Over the next two months, the virus spread rapidly around the world. On February 11 2020 the virus responsible for COVID-19 was officially named severe acute respiratory syndrome coronavirus 2 (SARS-CoV-2), and was declared a pandemic on March 11, 2020 by the World Health Organization (WHO) [3,4].
Coronaviruses belong to the family Coronaviridae and are found in a variety of animals and in humans. Patients infected with SARS-CoV-2 present an incubation period of 2–14 days with mild upper respiratory symptoms [5]. Lower respiratory symptoms often develop about 1 week after the onset of initial symptoms. Atypical pneumonia and respiratory deterioration occur in 20–30% of cases [5,6]. Gastrointestinal symptoms and asymptomatic infections, especially among young children, have also been described recently [7].
One of the most effective and realistic ways to contribute to the global response to the outbreak is to monitor human populations in the countries and locations that are most vulnerable to infectious disease [8]. In this respect, serum antibody tests are highly important for understanding the epidemiology of the emerging disease, to guide antiviral treatment, and infection control [9,10]. However, serological studies on the virus are scarce.
The rapid and accurate diagnosis of COVID-19 can help to prevent the spread of the virus by identifying and isolating individuals with the disease and tracing those with whom they have been in contact. For this reason, increasing test capacity contributes to disease and outbreak management by enabling prompt and accurate public health surveillance [11-13].
One option in health surveillance is the use of new technologies that have proven to be safe, efficient and cost-effectiveness. Within this context, new tools are being developed to meet the needs of health systems. Health technology tools are increasingly one of the most commonly used strategies worldwide to support decision making in health.
This study reports on a method that can serve as a basis for carrying out an epidemiological inquiry into infectious diseases, such as COVID-19, in a specific population. This type of action can guide the management of public policies aimed at tightening or loosening the social isolation measures needed during a pandemic.
The epidemiological survey methodology reported here was used to assess the prevalence of COVID-19 in the population. In order to carry out this assessment, a team of trained professionals is required to work on two fronts.
Team I: Responsible for the first contact with the volunteer participating in the study. At this time, a registration form is completed, with data such as full name, date of birth, identity document number, CPF (taxpayer identification number), address and telephone number, as well as the presence of any comorbidities, such as hypertension, diabetes mellitus, or respiratory disease, among other conditions.
After the screening carried out by Team I, the volunteer is directed to Team II.
Team II: Responsible for collecting the biological sample (blood) that will be used to analyze the presence of IgG and IgM antibodies to SARS-CoV-2. After collection, the team performs the appropriate storage of the material and ensures that it is transported to the laboratory responsible for processing the samples.
Study location
The method was applied in the 10 most populous municipalities in the state of Sergipe, in Brazil. These cities comprise more than 50% of the population of the state, according to 2019 data from the Brazilian Institute of Geography and Statistics (Instituto Brasileiro de Geografia e Estatística – IBGE) [14]. As a search strategy, places with a greater chance of spontaneous population circulation and a range of socioeconomic classes were visited. In northeastern Brazil, where Sergipe is geographically located, open municipal markets presented an ideal setting for the establishment of the survey.
The physical infrastructure required to carry out the collection of biological samples was provided by a partnership between the prefectures of each participating municipality and the study group proposing the survey.
Selected population
A statistical calculation was performed to define the number of participants required from each city in the study. The volunteers were divided into five age groups: Group I, 0 to 10 years; Group II, 11 to 30 years; Group III, 31 to 50 years; Group IV, 51 to 70 years and Group V, over 70 years. Within each group, participants were further categorized by gender, respecting the prevailing characteristics of each municipality. Only asymptomatic participants were included, since the objective of the survey was to assess the prevalence of the virus in a population that apparently does not pose a risk for the dissemination of SARS CoV-2 and, consequently, can contribute to aggravating the pandemic. Health professionals were excluded from the study, since they may be directly exposed to the virus in their work environment through direct contact with patients with COVID-19 and would, therefore, be much more likely to have the virus than members of the general population.
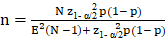
The sample size (n), for population proportion parameter estimate (p) is obtained considering the expected proportion, the admitted margin of error (E), the confidence level (z) and the total population size (N). For sufficiently large populations, population size loses importance compared to other factors. The calculation was made with the following formula:

Biological sample collection and laboratory treatment
The sample chosen for testing for IgG and IgM antibodies to SARS-CoV-2 was human serum. For this purpose, approximately 3 ml of blood was collected from each volunteer. Venous puncture was the chosen technique, with two possibilities for collection sites: the antecubital fossa of the arm or the back of the hand, according to the volunteer's preference. This sample was stored in a refrigerated environment to maintain viable biological properties for analysis.
At the laboratory, the whole blood sample was centrifuged to separate the serum from the other blood components. The centrifuge was programmed to perform 4000 rotations every 1 minute, for 10 minutes. The serum was packed in Eppendorf tubes and kept refrigerated at -20°C until the moment of use. This biological material was analyzed using the ichromaTM COVID-19 Ab test (Boditech Med Inc. Chuncheon, Korea) following the manufacturer’s instructions for the detection IgG and IgM antibodies to SARS-CoV-2 by the fluorescence method.
Development of a technological health tool: MonitoraSUS
Data about the volunteers were recorded by Team I at initial contact using the MonitoraSUS application. This application is a technological product developed by our group of researchers. Volunteers have access to the result of their test through this app. It also geolocates participants seroreagent for SARS CoV-2, and, therefore, assists in the development of epidemiological control strategies, with regard to effectively controlling social distance and keeping patients in isolation.
The investigations using this epidemiological survey methodology can only take place after approval by the relevant research ethics committees.
In this current public health context, there is an urgent need to develop strategies to reduce the severity of the pandemic caused by SARS-CoV-2. Creating epidemiological control options for this new respiratory disease is one of the top global priorities.
Pharmacological strategies for the prevention, containment, or treatment of COVID-19 are being developed. Isolation of cases, staying at home, and the closure of workplaces, schools and non-essential services are the main measures advocated by WHO to reduce the spread of the virus. It is a strategy that is known to be to limit human to human transmission and reduce secondary infections between close contacts and health professionals, since interventions like these have previously been used in other pandemics [15].
Within this context, epidemiological surveys are important tools in mapping asymptomatic reactive cases, and assessing as accurately as possible the actual infection rate. In addition, applying such a methodology can serve as a basis for decision-making in public policies that directly affect the health and economic activities of the study population [16-18].
The population in this survey model comprised individuals living in the state of Sergipe. To date, data from the Brazilian Ministry of Health have recorded more than 5900 COVID-19 cases, and more than 120 deaths, with 2209 people recorded as having recovered from the disease in Sergipe state. Two hundred seventy-three patients are hospitalized, with 132 in intensive care beds and 141 in clinical beds. According to the Health Ministry, more than 15400 tests have been performed and more than 10000 were non-reactive [19]. However, the data may not demonstrate the true number of infected people in the state, making the establishment of an epidemiological model of inquiry that can reliably predict the prevalence of infected people important.
The findings of our survey described here revealed a 11% prevalence of immunoreagents in a sample of 3047 people; a separate article will describe these findings in more detail. Considering that the state of Sergipe has about 2,200,000 inhabitants, our study suggested that around 242,000 people would be COVID-19 anti-body positive. These figures differ dramatically from those given above published in official epidemiological bulletins, suggesting a significant underreporting of the disease and highlighting the need for the use of a survey model as described here to assess the true scale of the infection state.
It is worth mentioning that the epidemiological bulletins released by health agencies refer to symptomatic patients. However, studies show that the greatest spread of the virus occurs from asymptomatic individuals, as they have a false sense of health, which often results in them ignoring guidelines on social isolation. Taking this into account, this model prioritizes the selection of asymptomatic individuals in places where large groups of people from a variety of socioeconomic levels meet, such as in street markets. These places are the main point of commerce for the population, underpinning to a large extent the region's economy in activities such as agriculture, livestock and handicrafts, which are important factors in economic and cultural life in Northeast Brazil.
The choice of serum as a biological sample for evaluation was due to the presence of antibodies. The production of antibodies, mainly immunoglobulin (Ig) M, produced quickly after infection, can be a useful tool to assist in the detection of contact with SARS-CoV-2. Thus, using laboratory techniques, the IgM - IgG antibody test allows early intervention with infected people, playing a critical role in fighting outbreaks [9,10]. RT-PCR is currently considered the gold standard for the diagnosis of COVID-19, but it has a significant false-negative rate, which makes it unsuitable for use in prevalence tests. Thus, the evaluation of antibodies presents itself as an ideal methodology for carrying out tests in asymptomatic patients [17,20,21], and as a way to characterize the immunization status of the population in epidemiological studies [16,22-24].
Laboratories have several serological tests to aid in clinical diagnosis, such as enzyme-linked immunosorbent assay (ELISA), competitive luminex immunoassay (cLIA), chemiluminescence, fluorescence, and qualitative immunochromatography [18,25-28]. Conventional serological tests for specific identification of IgM and IgG antibodies have a high yield advantage and reduce false negative cases [29]. Therefore, the use of the fluorescent serological method was considered adequate in this epidemiological survey model, since the objective is to reveal the prevalence of SARS CoV-2 in an asymptomatic sample.
The scientific literature suggests that combined IgG and IgM assays, known as total Ig, do not seem to collaborate with the definition of epidemiological criteria for cure or infection, an undesirable condition to be applied in an epidemiological survey. Therefore, it is sensible to use tests that reveal the IgG and IgM titers independently, to determine which stage of COVID-19 contamination the patient is at [20,30-32]. Knowing this is crucial for a slow and programmed return to normal life.
In this study, an ichromaTM COVID-19 Ab test system was used to perform the tests. It is a fluorescent immunoassay (FIA) for the qualitative determination of IgG/IgM antibodies against SARS-CoV-2 in whole blood, serum, or, human plasma samples. The test uses a sandwich immunodetection method; the fluorescent conjugates present in the lyophilized detection buffer bind to the antibodies present in the sample, forming antigen-antibody complexes and migrate to the nitrocellulose matrix, where they are captured by other human anti-IgG and anti-IgM antibodies immobilized on the test strip. The more antibodies in the sample, the more antigen-antibody complexes are formed, generating a stronger intensity of the fluorescence signal in the detector antigen, which is processed by the ichromaTM instrument to determine the concentration of anti-SARS-CoV-2 IgG and IgM antibodies in the sample. In assessing performance, according to the manufacturer, sensitivity and specificity are 95.8% and 97.0%, respectively. This test was selected because it can be used to screen asymptomatic patients for the identification of antibodies resulting from SARS-CoV-2 infection with high sensitivity.
It is worth mentioning that when using any particular analytical methodology, it is necessary to validate it, analyzing aspects such as precision, cross reaction, sensitivity and specificity.
Following the analytical evaluation, the new technological tool that had been developed to disseminate the results of the tests and monitor those with a positive result was used. The use of new technologies to improve health provision has been increasing greatly; for example, after the 2010 earthquake in Haiti, humanitarian organizations started to incorporate many new technologies into their field operations, including drone imagery and SMS messaging to guide responses to disease outbreaks, wars and disasters [33]. Technological advances, however, should be used to improve clinical treatment and efficiency, and should not be used to replace essential treatment. Among the possible uses of new health technologies are the ability to manage a large number of patients simultaneously, identify emerging clinical problems and warn about possible errors in treatment plans [34].
In order to solve the problem of the lack of integration of data generated through the application of tests for COVID-19 in the Brazilian population, the Software Factory of the Federal University of Sergipe (KNUTH) developed a system that allows the integration of viral test results in the 5,570 municipalities in the country. The MonitoraSUS tool was launched by the Federal University of Sergipe (UFS) through the electronic address: www.monitorasus.ufs.br (Figure 1).
Figure 1. Public interface for MonitoraSUS showing log in/registration page and links to maps and system manual
The method described here was designed to gather information and generate statistics, based on the monitoring of infectious diseases, to assist in the management of health and the economic use of public resources. The platform allows Brazilian states and municipalities to collect results from rapid and laboratory diagnostic tests and use geolocation mechanisms in order to carry out various analyses. To create the application, several operating systems were researched and a web based system was selected. A web system was developed to provide easy access from a wide range of devices including computers, tablets and mobile phones. The application map was developed with the help of public aerial images from Google Maps, and the map was generated in Photoshop CS5.
The degree of accuracy of the geolocation of the system makes it a reliable patient monitoring tool. For example, a result of a test carried out in the municipality of Aracaju, in the state of Sergipe, on a resident of the city of Arapiraca, in the state of Alagoas recorded using MonitoraSUS will be immediately available to officials in the state and municipality of the source, as shown in Figure 2. Therefore, the software provides details of the test, even if it was carried out in another state.
Figure 2. Map showing the location of patients positive for IgM and IgG in the state of Sergipe
MonitoraSUS gives immediate access to an overview of a studied sample, providing information on the total number of tests, categorized as positive, negative, indeterminate and immunized. In addition, it allows the sample to be classified by sex, age, and date of the exam, as shown in Figure 3. In addition, it is possible to interpret the results of the exams by correlating them with recorded comorbidities (hypertension, diabetes mellitus and respiratory disease) presented by the patients in the sample, as shown in Figure 4.
Figure 3. Virtual interface of MonitoraSUS showing general data from the total number of 3047 exams performed
Figure 4. Virtual interface showing bar graphs with the results of exams correlated with comorbidities presented by the sample
The virtual tool provides screens with georeferenced maps of the population tested by state, municipality and neighborhood. Maps and graphs are updated daily, after data integration using a BI (Business Intelligence) system, which even allows forecasts of the number of people who have recovered from the disease by location. Using Google Maps as a reference for geolocation, the coordinates of the Global Positioning System (GPS) are used to locate the registered patient. In addition to serving as a patient registration platform, results and instant graphic maps serve as excellent tools for health managers. These maps can show a hot zone, geolocalizing IgM reactive patients, and a cold zone geolocalizing IgG reactive patients (Figure 5).
Figure 5. MonitoraSUS virtual interface showing hot zone, represented by red color, geolocalizing IgM reactive patients; and cold zone, represented by blue color, geolocalizing IgG reactive patients
At the end of the sample evaluation, the results are sent via SMS to each participating volunteer. The tool can also be used via mobile devices, enabling the notification of tests performed in real time in drive-thru tests. For more information, you can access the link to the system manual available at the electronic address.
Brazil is a continent-sized country with a wide variety of local conditions. This makes the need for appropriate methods to efficiently and effectively evaluate local populations in order to support decision-making, particularly in emergency situations, an even more pressing priority than it might be in some other countries
The COVID-19 pandemic highlights the structural weaknesses and bottlenecks of the Brazilian national health service (SUS), as well as the need to produce and perform improved diagnostic tests. The use of epidemiological strategies, such as the epidemiological survey methodology described here, to measure the prevalence of cases of COVID-19 is an inexpensive tool with important scientific value that can contribute to better health outcomes for the population and support a return to normal life.
Author contributions: All authors have read and agreed to the published version of the manuscript.
Funding: This research was not funded. The authors themselves financed it.
Acknowledgments: The authors dedicate this article to all health professionals who are facing COVID-19. We are eternally grateful to them, and hope that our article can contribute to reducing the number of deaths.
Conflicts of interest: The authors have declared that there is no conflict of interest.
- Huang C, Wang Y, Li X, Ren L, Zhao J, et al. (2020) Clinical features of patients infected with 2019 novel coronavirus in Wuhan, China. Lancet 395: 497-506.
- Qun L (2020) The 2019-nCoV outbreak joint field epidemiology investigation team. An outbreak of NCIP (2019-nCoV) infection in China — Wuhan, Hubei Province, 2019−2020. China CDC Weekly 2: 79-80.
- Zhu H, Wang L, Fang C, Peng S, Zhang L, et al. (2020) Clinical analysis of 10 neonates born to mothers with 2019-nCoV pneumonia. Transl Pediatr 9: 51-60. [Crossref]
- WHO (2020) Pneumonia of unknown cause - China. 05 January 2020. https://www.who.int/csr/don/05-january-2020-pneumonia-of-unkown-cause-china/en/.
- Singhal TA (2020) Review of coronavirus disease-2019 (COVID-19). Indian J Pediatr 87: 281-286.
- Benvenuto D, Giovanetti M, Salemi M, Prosperi M, De Flora C, et al. (2020) The global spread of 2019-nCoV: a molecular evolutionary analysis. Pathog Glob Health 114: 64-67. [Crossref]
- Chan JF, Yuan S, Kok KH, Wang To KK, Chu H, et al. (2020) A familial cluster of pneumonia associated with the 2019 novel coronavirus indicating person‐to‐person transmission: a study of a family cluster. Lancet 395: 514-523.
- Jin Y, Wang M, Zuo Z, Fan C, Ye F, et al. (2020) Diagnostic value and dynamic variance of serum antibody in coronavirus disease 2019. Int J of Infect Dis 94: 49-52. [Crossref]
- Broadhurst MJ, Brooks TJG, Pollock NR (2016) Diagnosis of Ebola virus disease: Past, present, and future. Clin Microbiol Rev 29: 773-793.
- Kluge H, Martín-Moreno JM, Emiroglu N, Rodier G, Kelley E, et al. (2018) Strengthening global health security by embedding the International Health Regulations requirements into national health systems. BMJ Glob Health 3: 1-7. [Crossref]
- Li R, Pei S, Chen B, Song Y, Zhang T, et al. (2020) Substantial undocumented infection facilitates the rapid dissemination of novel coronavirus (SARS-CoV-2). Science 368: 489‐493. [Crossref]
- Gudbjartsson DF, Helgason A, Jonsson H, Magnusson OT, Melsted P, et al. (2020) Spread of SARS-CoV-2 in the Icelandic Population. N Engl J Med 382: 2302-2315. [Crossref]
- Sutton D, Fuchs K, D'Alton M, Goffman D (2020) Universal Screening for SARS-CoV-2 in Women Admitted for Delivery. N Engl J Med.
- Brazilian Institute of Geografy and Statistic. Accessed 23 May 2020. Available at: https://cidades.ibge.gov.br/brasil/se/panorama.
- Ferguson NM, Cummings DA, Cauchemez S, Fraser C, Riley S, et al. (2005) Strategies for containing an emerging influenza pandemic in Southeast Asia. Nature 437: 209-214. [Crossref]
- Zitek T (2020) The appropriate use of testing for COVID-19. West J of Emerg Med 21: 470-472. [Crossref]
- Studdert DM, Hall MA (2020) Disease control, civil liberties, and mass testing — Calibrating restrictions during the Covid-19 Pandemic. N Engl J Med 383: 102-104.
- Kim YJ, Sung H, Ki C, Hur M (2020) COVID-19 testing in South Korea: Current status and the need for faster diagnostics. Ann Lab Med 40: 349-350. [Crossref]
- Health Ministry. Secretary of Health Survaillance. Accessed 27 May 2020. Available at: https://covid.saude.gov.br/
- Padula WV (2020) Why only test symptomatic patients? Consider random screening for COVID-19. Appl Health Econ Health Policy 18: 333-334. [Crossref]
- Wu X, Fu B, Chen L, Feng Y (2020) Serological tests facilitate identification of asymptomatic SARS‐CoV‐2 infection in Wuhan, China. J Med Virol.
- Sung H, Yoo CK, Han MG, Lee SW, Lee H, et al. (2020) Preparedness and rapid implementation of external quality assessment helped quickly increase COVID-19 testing capacity in the Republic of Korea. Clin Chem 66: 979-981. [Crossref]
- Maxmen A (2020) Untapped potential: More US labs could be providing tests for coronavirus. Nature.
- Bassi LL, Hwenda L (2020) COVID-19: time to plan for prompt universal access to diagnostics and treatments. Lancet Glob Health 8: 756-757. [Crossref]
- Padoan A, Cosma C, Sciacovelli L, Faggian D, Plebani M (2020) Analytical performances of a chemiluminescence immunoassay for SARS-CoV-2 IgM/IgG and antibody kinetics. Clin Chem Lab Med.
- Lippi G, Salvagno GL, Pegoraro M, Militello V, Caloi C, et al. (2020) Assessment of immune response to SARS-CoV-2 with fully automated MAGLUMI 2019-nCoV IgG and IgM chemiluminescence immunoassays. Clin Chem Lab Med 58: 1156-1159. [Crossref]
- Di Mauro G, Scavone C, Rafaniello C, Rossi F, Capuano A (2020) SARS-Cov-2 infection: Response of human immune system and possible implications for the rapid test and treatment. Int Immunopharmacol 84: 106519.
- Carvalho LFCS, Nogueira MS (2020) Optical techniques for fast screening - towards prevention of the coronavirus COVID-19 outbreak. Photodiagnosis Photodyn Ther 30: 101765. [Crossref]
- Xiao AT, Tong YX, Zhang S, et al. (2020) False‐negative of RT‐PCR and prolonged nucleic acid conversion in COVID‐19: Rather than recurrence. J Med Vir. [Crossref]
- Gareth L (2020) Covid-19: Antibody tests will not be rolled out in UK until at least May, MPs hear. BMJ 369: 1449.
- Zhong L, Chuan J, Gong B, Shuai P, Zhou Y, et al. (2020) Detection of serum IgM and IgG for COVID-19 diagnosis. Sci China Life Sci 63: 777-780. [Crossref]
- Rong X, Yang L, Chu H, Fan M (2020) Effect of delay in diagnosis on transmission of COVID-19. Math Biosci Eng 17: 2725-2740.
- Bengtsso L, Lu X, Thorson A, Garfield R, von Schreeb J (2011) Improved response to disasters and outbreaks by tracking population movements with mobile phone network data: A post-earthquake geospatial study in Haiti. PLoS Med 8. [Crossref]
- Verghese A, Shah NH, Harrington RA (2018) What this computer needs is a physician: Humanism and artificial intelligence. JAMA 319: 19-20. [Crossref]