Introduction: Patients with peripheral artery disease (PAD) have been found to suffer from diabetes, obesity, lipid abnormalities, including elevated levels of total and LDL-cholesterol as well as triglyceride levels. Therefore, the objective of the current study is to conduct a systematic review with network meta-analysis to compare the effects of statins classes on PAD patients for future major adverse cardiovascular events.
Methods and analysis: We will search the PubMed, EMBASE, Cochrane Library, Web of Science, Embase, google scholar, clinical trials registry (ClinicalTrials.gov) for unpublished or undergoing research listed in registry platforms. Randomized clinical trials (RCTs) studies published in English up to 31 January 2018, and which include direct and/or indirect evidence, will be included. Studies will be retrieved by searching four electronic databases and cross-referencing. Dual selection and abstraction of data will occur. The primary outcome will all-cause mortality, new event of acute myocardial infarction, stroke (hemorrhagic and ischemic), hospitalization for acute coronary syndrome and urgent revascularization procedures and cardiovascular mortality. Secondary outcomes will be assessment of the differences in change of total cholesterol (TC), low-density lipoprotein (LDL-C), apolipoprotein B (ApoB), high density lipoprotein (HDL-C), changes in pain free walking distance (PFWD) and quality of life (QOL). Risk of bias will be assessed using the Cochrane Risk of Bias assessment instrument for RCTs. Network meta-analysis will be performed using multivariate random-effects meta-regression models. The surface under the cumulative ranking curve will be used to provide a hierarchy of statins that reduce cardiovascular mortality in PAD patients. A revised version of the Cochrane Risk of Bias tool (RoB 2.0) will be used to assess the risk of bias in eligible RCTs. Subgroup and sensitivity analysis will also be performed.
Ethics and dissemination: The results and findings of this study will be submitted and published in a scientific peer-reviewed journal.
PROSPERO registration number: CRD42018082024
statins, peripheral artery disease, systematic review
Cis: Confidence intervals; HDL: High-density lipoprotein; LDL: Low-density lipoprotein; MD: Mean difference; RR: Risk ratio; WC: Waist circumference; MetS: Metabolic syndrome; PAD: Peripheral artery disease
Strengths and limitations of this study
To the best of our knowledge, this is the first systematic review with network meta-analysis that compares the cardiovascular safety of different classes of statins drugs based on data from both randomized clinical trials (RCTs).
Common to most meta-analyses, significant and unexplained heterogeneity may exist. The protocol has been created according to the published PRISMA-P guidelines. Like any aggregate data meta-analysis, the risk for ecological fallacy exists and few RCTs may report data on cardiovascular mortality.
Rationale
Lower limb peripheral artery disease (PAD) results from narrowing and occlusion of the arteries providing blood to the legs and it has been estimated that approximately 200 million people worldwide had PAD in 2010[1]. The most common presenting complaint for PAD patients is intermittent claudication (IC). Patients with IC have significantly impaired walking ability, high rates of cardiovascular events such as myocardial infarction and stroke and reduced disease-related quality of life. It is estimated that approximately 22% of patients with PAD will eventually die from cardiovascular events and therefore aggressive management of cardiovascular risk factors is a primary focus of treatment [1,2].
We plan to conduct a systematic review and meta-analysis of all published RCTs that have investigated the effects of different pharmacological classes of statins.
Objective
The primary objective of this study is to conduct a systematic review with network meta-analysis of randomized trials to compare the effects of different pharmacological classes of statins on assessment of the all-cause mortality, new event of acute myocardial infarction, stroke (hemorrhagic and ischemic), hospitalization for acute coronary syndrome and urgent revascularization procedures and cardiovascular mortality. Secondary outcomes will be assessment of the differences in change of total cholesterol (TC), low-density lipoprotein (LDL-C), apolipoprotein B (ApoB), high density lipoprotein (HDL-C) in patients with PAD. The network meta-analytic approach is appropriate here because it allows for the inclusion of multiple interventions from both direct and indirect comparisons that have not been examined in a head-to-head fashion.
Overview
This study will follow the Preferred Reporting Items for Systematic Reviews and Meta-Analyses guidelines3for meta-analyses of healthcare interventions and the current protocol report follows the Preferred Reporting Items for Systematic Reviews and Meta-Analyses Protocols [3-7]. This protocol is registered in International Prospective Register of Systematic Reviews (trial registration number: CRD42018082024). This study will not involve any private patient data, ethics approval was waived (see online supplementary file 1 for PRISMA-P checklist).
Eligibility criteria
We will include randomized controlled trials (RCTs) comparing one antiepileptic drug with another antiepileptic drug as monotherapy or placebo for the treatment of TN. Quasi-randomized controlled trails allocating participants according to birth date or the consequences of enrolment will be excluded. The minimum duration for RCT inclusion will be set at 4 weeks. Trials with more than a two arm design will be considered only if the available data meet the criteria for an intervention. For trials with a crossover design, data will only be extracted from the first randomization period. Studies that meet the following criteria will be included: (1) randomized trials, (2) adults ≥18 years of age with PAD, either with or without a history of CV disease. (3) at least one oral statins intervention group, (4) data on CV mortality and/or major adverse cardiac events, (5) studies published in English up to 31 January 2018. The decision to include patients with PAD with or without a history of CV disease was made based on our preliminary search of clinical trials that included patients with either a history of CV disease or those who are at a heightened risk for CV disease. Major adverse cardiac events will be defined as an incidence of AMI, stroke, hospitalization for acute coronary syndrome and urgent revascularization procedures. We will exclude other drugs acting on the lipid profile because of their different mechanism of action.
Patient and Public Involvement
The patients and/or the public are not involved, it is an article of protocol of systematic revision and network of meta-analysis.
Intervention types
We plan to include the following antiepileptic drugs: Simvastatin, Atorvastatin, Pravastatin, Rosuvastatin, Lovastatin, Fluvastatin and Pitavastatin. In addition to these antiepileptic drugs, we will also obtain information about interventions of interest from either pairwise RCTs or placebo controlled trails, as some RCTs design a placebo-controlled arm as the comparator.
Search strategy
The following databases will be searched from their inception forward for potentially eligible studies in English language published on or before 31 January 2017: (1) PubMed, (2) Scopus, (3) Web of Science, (4) Cochrane Central Register of Controlled Clinical Trials, (5) Embase, (6) google scholar, (7) clinical trials registry (ClinicalTrials.gov). In addition, cross-referencing from retrieved studies will be conducted. As publication bias caused by insufficient unpublished data can significantly bias the comparative efficacy results of network meta-analyses and modify rankings, we will also perform searches for unpublished or ongoing trials using the System for information on Grey Literature in Europe (SIGLE) as well as other registry platforms, such as Clinicaltrials.gov and the International Clinical Trials Registry Platform. Prior to completing this review, we will perform an additional search of each database and registration platform to guarantee that the most recent studies are included. Electronic databases will be searched for studies on the effects of statins on CV safety in adults with PAD. The first author will conduct all database searches. The search strategy for all other databases will be adapted based on the requirements of each database. The search strategy will be developed by LR and HRZ, we anticipate that the databases will be searched from their inception to 30 December 2018 (see online supplementary file 2 for the search strategies for PubMed, EMBASE, Cochrane Library, Web of Science, Embase, google scholar, clinical trials registry (ClinicalTrials.gov).
Study selection
All studies extracted from electronic databases using the search strategy will be imported into EndNote V.X7.5 and duplicates removed. The studies will be examined again manually to find and delete any additional duplicates. The first two authors will select studies independent of each other. Complete articles will be obtained for all titles and abstracts that appear to meet the inclusion criteria or where there is any uncertainty. Reasons for exclusion will be coded as one or more of the followings: (1) inappropriate population, (2) inappropriate intervention, (3) inappropriate comparison, (4) inappropriate outcome(s), (5) inappropriate study design. After selection, the first two authors will review their selections and resolve any discrepancies by consensus. If consensus cannot be reached, the third author will be consulted. The overall agreement rate prior to correcting discrepant items will be calculated using Cohen’s kappa (κ) statistics. Once discrepancies are resolved, the overall precision of searches will be calculated by dividing the number of studies included by the total number of studies screened after removing duplicates. The number needed to read will then be calculated as the inverse of the precision. A flow diagram that depicts the search process and an online supplementary file that includes a reference list of all studies excluded (including the reason(s) for exclusion) will be included in the study. The proposed structure for the flow diagram is shown in Figure 1.
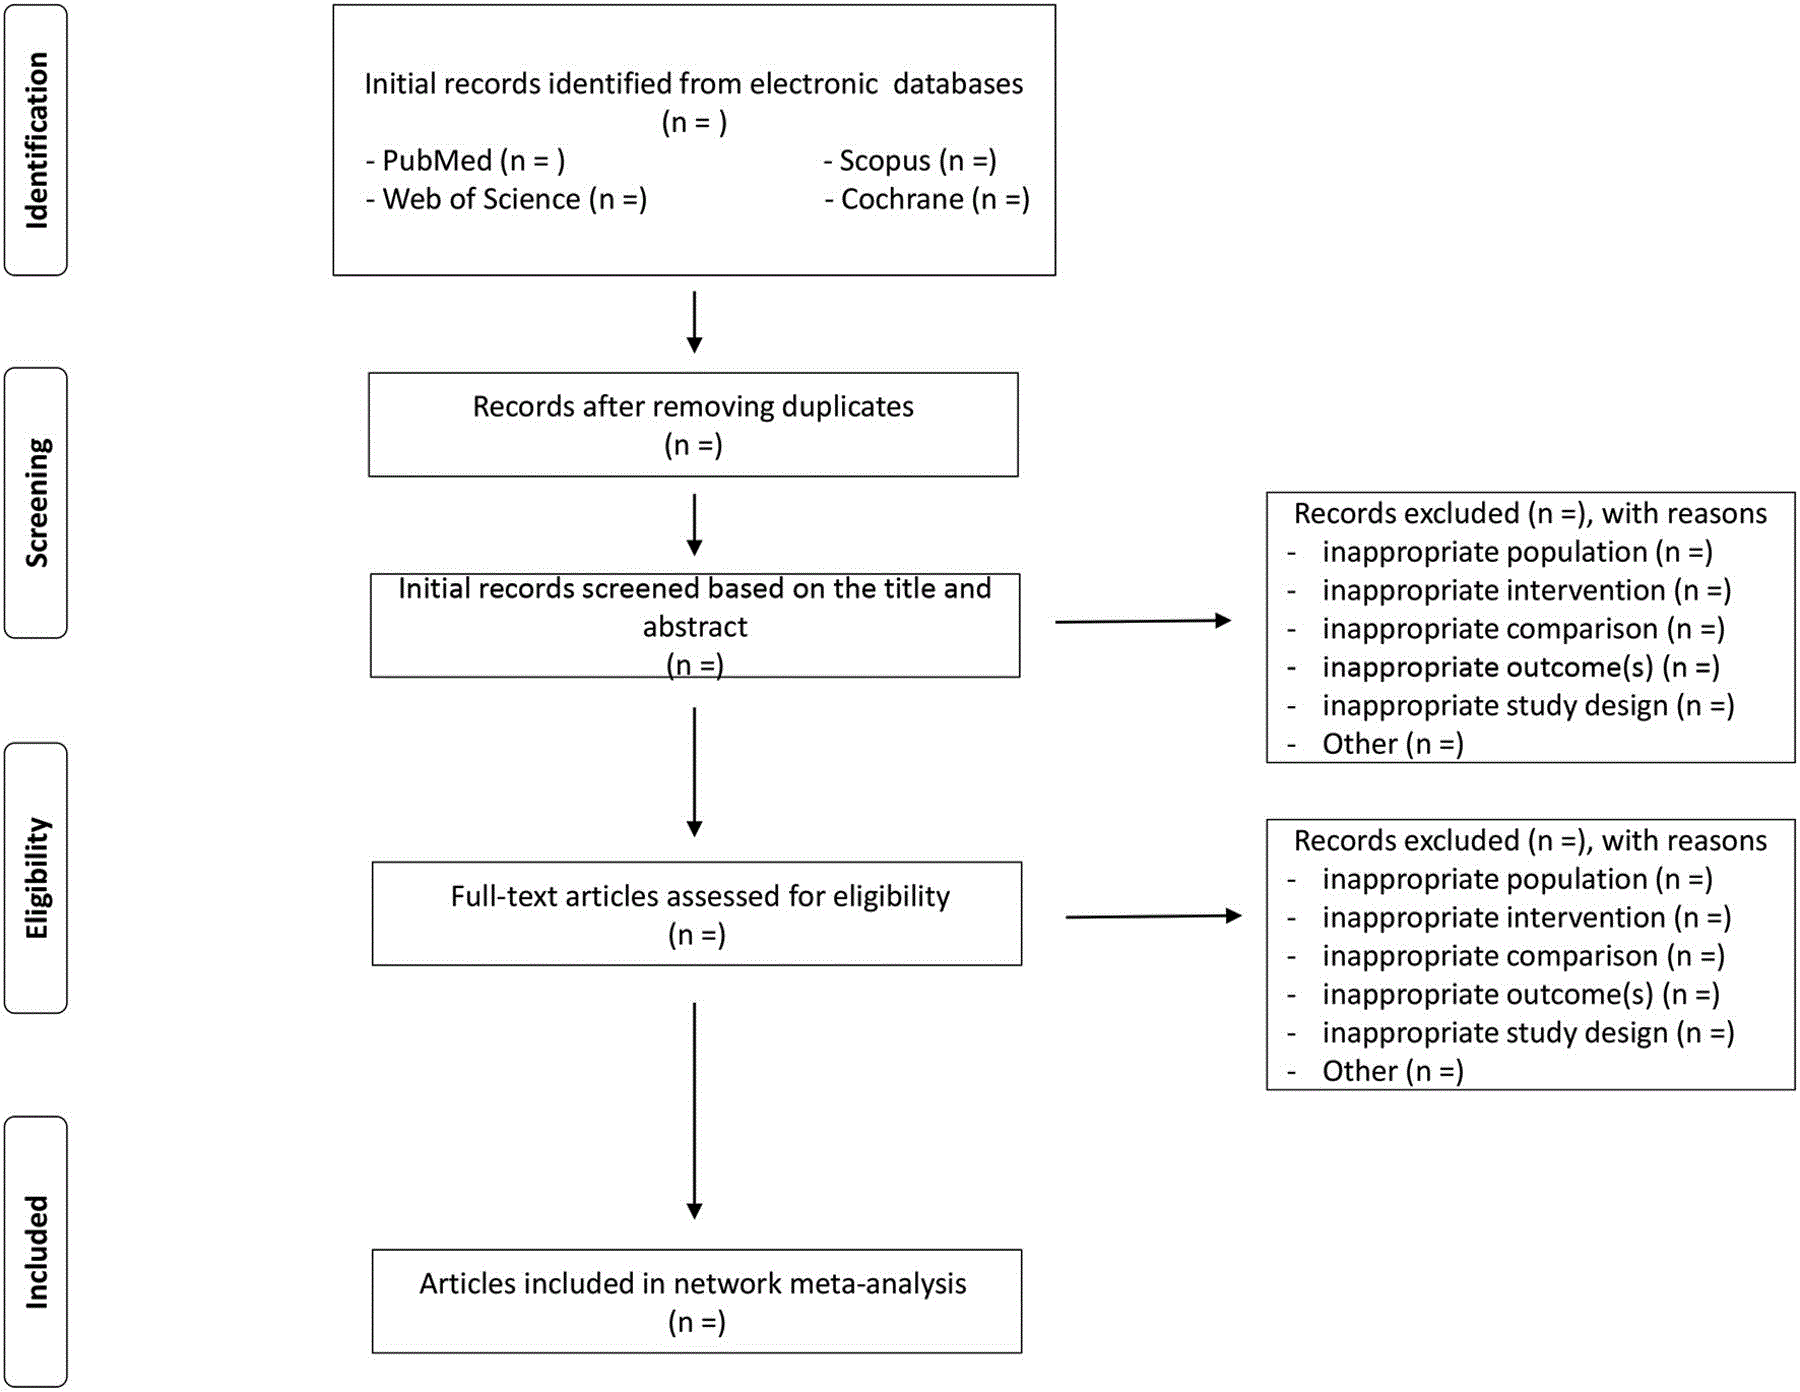
Figure 1. Flow diagram of study selection process.
Data abstraction
Before initiating data abstraction, a codebook will be developed in Microsoft Excel 2013. The codebook will be developed by the first author with input from the third author. The major categories of variables to be coded will include: (1) study characteristics (author, journal, year, etc), (2) participant characteristics (age, sex, CV disease at baseline, etc), (3) intervention characteristics (pharmacological class of statins, dose, etc), (4) control characteristics, (5) outcome data for CV mortality, all-cause mortality, incidence of AMI, stroke, hospitalization for acute coronary syndrome urgent revascularization procedures, total cholesterol (TC), low-density lipoprotein (LDL-C), apolipoprotein B (ApoB), high density lipoprotein (HDL-C), changes in pain free walking distance (PFWD) and quality of life (QOL),amputations and/or tissue loss in the form of chronic ulcers or acute soft tissue infections/gangrene. The first two authors will abstract data from selected studies, independent of each other, using the codebook in Microsoft Excel. On completion, both authors will review the codebooks and resolve discrepancies by consensus. If consensus cannot be reached, the third author will provide a recommendation. Prior to correcting disagreements, the overall agreement rate will be calculated using Cohen’s κ statistic.
Outcomes and prioritization
The primary outcome will be all-cause mortality, new event of acute myocardial infarction, stroke (hemorrhagic and ischemic), hospitalization for acute coronary syndrome and urgent revascularization procedures and cardiovascular mortality. Secondary outcomes will be assessment of the differences in change of total cholesterol (TC), low-density lipoprotein (LDL-C), apolipoprotein B (ApoB), high density lipoprotein (HDL-C), changes in pain free walking distance (PFWD), quality of life (QOL), amputations and/or tissue loss in the form of chronic ulcers or acute soft tissue infections/gangrene. We will include the safety and efficacy assessment of drugs.
Calculation of effect sizes
All analyses will be conducted using the natural log of odds ratio (OR) and then transformed back to ORs for presentation purposes. If OR is not reported, it will be calculated from data reported in the study. If data are not available to calculate OR, it will be requested from the study authors. Secondary outcomes will be calculated using the same procedure as for our primary outcome. If a study includes both direct and indirect comparisons, only direct comparison data will be included given that the primary focus of the current study is to compare the CV safety between different statins. The data augmentation approach will be used to make direct comparisons if the control group is placebo [7]. In this technique, direct evidence studies that lack a control (placebo) group will have one generated from the weighted average of the arm-specific means and SD [8].
Pooled estimates for change in outcomes
Network maps will be drawn to depict the treatments that are directly compared against each other and the amount of evidence available for each treatment and its comparator. Separate network maps will be presented for each outcome. Contribution plots for each outcome will be generated to determine the most dominant comparisons for each network estimate, as well as for the entire network. The weights applied will be a function of the variance of the direct treatment effect and the network structure, the product being a percent contribution of each direct comparison to each network estimate. Network and contribution plots will be produced using the networkplot and netweight commands, respectively, in Stata/IC for Mac V.14.0 [9].
Prior to conducting network meta-analysis, pairwise meta-analysis using random-effects models will be conducted in order to examine statistical heterogeneity within each comparison.10 Heterogeneity will be assessed using Cochran’s Q statistics and I2, an extension of Q.11-12 A Q statistic <0.10 and/or an I2value >50% will be considered to represent significant heterogeneity. On completion of pairwise meta-analysis, network meta-analysis will be performed using multivariate random-effects models based on the mvmeta command in Stata/IC for Mac V.14.0.12 Non-overlapping 95% confidence intervals (CI) will be considered to represent statistically significant changes. Separate network meta-analysis models will be used to compare CV mortality, all-cause mortality, incidence of AMI, stroke, hospitalization for acute coronary syndrome and urgent revascularization procedures [10].
Sub-group analyses will be conducted to examine the association between our primary outcome and oral statins. These will include year of drug approval by the US FDA, presence or absence of CV disease risk at baseline, lipids at the baseline, number of comorbidities, type of treatment (monotherapy, dual therapy or triple therapy) and the country the study was conducted in. Secondary outcomes will be handled using the same approach.
We will examine the consistency of the estimates of treatment effects from direct and indirect evidence for each outcome using the mvmeta command in Stata.8 An alpha value <0.05 will be considered to represent statistically significant inconsistency. Prediction intervals will be used to enhance the interpretation of findings and provide an estimate of expected results in a future study [8-12]. Prediction intervals will be generated using the mvmeta and interval plot9 commands in Stata/IC for Mac V.14.0.
Meta-biases
2021 Copyright OAT. All rights reserv
Small-study effects (publication bias, etc) will be assessed using comparison-adjusted funnel plots. Unlike traditional funnel plots in pairwise meta-analysis, funnel plots in network meta-analysis need to account for the fact that studies estimate treatment effects for different comparisons. Consequently, there is no single reference line from which symmetry can be evaluated. For the comparison-adjusted funnel plot, the horizontal axis will represent the difference between study-specific effect sizes from the comparison-specific summary effect. In the absence of small-study effects, the comparison-adjusted funnel plot should be symmetric around the zero line. Since the treatments need to be organized in some meaningful way to examine how small studies may differ from large ones, comparisons will be defined so that all refer to an active treatment versus a control group. Comparison-adjusted funnel plots will be generated using the netfunnel command9 in Stata/IC for Mac V.14.0.
Transitivity (similarity in the distribution of potential effect modifiers across the different pairwise comparisons) will be evaluated using random-effects network meta-regression while controlling for the different study designs within each comparison [13]. Potential effect modifiers will include age, gender, baseline lipids, obesity, presence of CV disease at baseline and medication status. In addition, because individuals taking medication are more likely to have severe disease or more comorbidity than those without medication, we will also include baseline condition of the patient (eg, disease severity) in our regression models. However, since this is an aggregate data meta-analysis and if the patients included within each study are heterogeneous (eg, different levels of disease severity within the same study), we will include as a covariate those studies that control for such factors versus those that do not. Table 1 provides a complete list of covariates that we plan to include. Transitivity analysis will be conducted using the mvmeta command8 in Stata/IC for Mac V.14.0.
Table 1. Covariates that will be included in the study.
Characteristics |
Variables |
Study |
Publication year, country the study was conducted in, type of study (RCT, cohort, case–control, etc), duration of the study, follow-up duration. |
Participant |
Age, sex, lipids, risk of cardiovascular disease, presence or absence of cardiovascular disease, medication status, baseline condition of participants (eg, disease severity). |
Intervention |
Name of the drug, pharmacological class, dose, route of administration. |
Comparator |
Name of the drug, pharmacological class, dose, route of administration. |
Outcome |
Cardiovascular mortality, all-cause mortality, incidence of AMI, stroke, hospitalization for acute coronary syndrome, urgent revascularization procedures, of total cholesterol (TC), low-density lipoprotein (LDL-C), apolipoprotein B (ApoB), high density lipoprotein (HDL-C), changes in pain free walking distance (PFWD) and quality of life (QOL),amputations and/or tissue loss in the form of chronic ulcers or acute soft tissue infections/gangrene. |
Ranking analysis is a major advantage of network meta-analysis because it allows one to rank all interventions for the outcome of interest. For the current study, we will generate ranking plots for a single outcome using probabilities [14,15]. However, since ranking treatments based solely on the probability of each treatment being the best does not account for the uncertainty in the relative treatment effects and the potential for assigning higher ranks in which little information is available, rankograms and cumulative ranking probability plots will be used to show ranking probabilities along with their uncertainty for changes in our primary and secondary outcomes [14,15]. Surface under the cumulative ranking curves (SUCRA), a transformation of mean ranks, will be used to provide a hierarchy of treatments while accounting for the location and variance of all treatment effects [14,15]. Larger SUCRA values are indicative of better ranks for the treatment. Separate ranking analyses will be conducted for all primary and secondary outcomes using the mvmeta8 and SUCRA9 commands in Stata/IC for Mac V.14.0.
All data will be analyzed using Stata/IC for Mac V.14.0.
Confidence in the cumulative evidence
Strength in the body of evidence will be assessed using the Grading of Recommendations Assessment, Development and Evaluation (GRADE) instrument for network meta-analysis [16]. Two main outputs are reported in a network meta-analysis: pairwise effect estimates and treatment rankings. Since the two outputs are generated using different techniques, they may differ between each other. Therefore, it is important to assess the level of confidence to be placed on each output. The level of confidence will be assessed using GRADE across four domains: (1) study limitations, (2) joint consideration of indirectness and transitivity, (3) joint consideration of statistical heterogeneity and statistical inconsistency, (4) imprecision and publication bias. Based on these assessments, the overall strength of evidence will be ranked as either high, moderate, low or very low. The overall confidence will be classified as high if any one of the domains is considered high.
Risk of bias assessment
Two reviewers will independently assess the risk of bias for each included study using the modified version of the Cochrane Collaboration tool.6 Risk of bias assessment will be performed for individual studies separately for each outcome. A third reviewer will resolve disagreements.
The included RCTs will be assessed for sequence generation, allocation sequence concealment, blinding, selective outcome reporting and missing participant data. Sequence generation will be considered adequate if the study explicitly described an appropriate randomization procedure to generate an unpredictable sequence of allocation, including computerized randomization, use of random number tables and coin-tossing. Concealment of allocation will be considered adequate if specific methods to protect allocation were documented and implemented. Performance bias will be considered low if a study reported participant, caregiver and/or researcher blinding. Blinding of outcome assessment will be considered adequate if outcome assessors and adjudicators were blinded. Within-study selective reporting of outcomes will be examined by reviewing the a priori study protocol, if available. If the study protocol is not available, we will compare the outcomes listed in the methods section with the reported outcomes in the results section.
A description for each domain assessed will be included along with comments if necessary and a final judgement for each outcome within each study and categorized as (1) low risk of bias, where bias is not present or, if present, unlikely to affect outcomes, (2) probably low risk of bias, (3) probably high risk of bias, or (4) high risk of bias, where outcomes are likely to be significantly affected by bias. We will consider the Discrepancies among the two reviewers (LR and HRZ) will be solved by discussion, or will be judged by a third reviewer (GBZ).
Statistical analysis
The data for statistical analysis will be extracted into an Excel file. The primary outcome is continuous data, so we will calculate the effect size of the interventions using the standardized mean difference (SMD). For trials that present mean values of each time point, we will use the primary outcome adjusted by the baseline values. If the trials present the value of the primary outcome changing from baseline, we will calculate the SMD directly. We will calculate the 95% CI for each single SMD, and the results will be pooled using the random-effect model. The proportion of responders represents dichotomous data, so we will calculate the effect size using the relative ratio (RR). The RR and the 95% CI of each intervention will be calculated and pooled using the random-effect model.
The network meta-analysis will be conducted using the ‘netmeta’ package in the R software (http://www.r-project.org/), to combine direct and indirect evidence of interventions for migraine prophylaxis [16]. The package is developed on the basis of the frequentist method, using the graph-theoretical method developed according to the electrical network theory [17]. The first advantage of this method is that it can combine direct and indirect evidence in trials with more than two study arms. Multiarm studies are often included in a network meta-analysis. In these studies, the treatment effects on different comparisons are correlated, which is not fully addressed by the generalised linear mixed models8 or the Bayesian Markov Chain Monte Carlo method9 ,10 that is commonly used for network meta-analysis. The ‘netmeta’ package accounts for the correlated treatment effects by reweighting all comparisons of each multiarm study. The second advantage of this method is that it provides solutions for testing the consistency of the network using Cochrane's Q statistics and finding out the reasons for the consistency by a net-heat plot. So we will use this method to address the consistency of the network. If the data are not suitable to carry out the synthesis, we will perform a descriptive review and summarize the evidence. The evidence strength will be assessed using the GRADE method generated by the Cochrane library. A funnel plot will be drawn to detect if there is any publication bias.
Dealing with missing data
There will be missing data in the trials that we included. We will first contact the authors to ask for original data by email or phone calls, if possible. If the original data are not available, we will try to calculate the data through the available coefficients, for example, we will calculate the SD from the 95% CI, p or t values. Imputations of the data will be tested in the following sensitivity analysis.
Subgroup analysis
To address the potential heterogeneity and inconsistency across trials, we will perform a subgroup analysis. This include subtypes of dyslipidemia (isolated hypercholesterolemia, isolated hypertriglyceridemia, mixed hyperlipidemia and isolated HDL-cholesterol reduction), blinding method (open trial, single blind for participants, double blind for both participants and care providers), quality of evidence (high risk, unclear of the risk and low risk), duration of PAD and mean age of the participants. Meta-regression models will be used to quantify the difference between subgroups and test for statistical significance. we will also include diabetes, CVD and other comorbidities depending on the outcome of the studies
Sensitivity analysis
Sensitivity analysis will be performed to first address whether the combined estimates of the interventions are dominated by one or several trials, especially those with a high risk of bias. Then we will exclude the trials to test the robustness of our study result. Second, we will test whether the imputation of the missing values affects the result of the meta-analysis. We will also test different coefficients that are used to impute the missing value, if both SE and 95% CI are available to calculate SD, we will test which is better.
Assessment of heterogeneity
Heterogeneity, which plays a pivotal role in both standard meta-analyses and network meta-analyses, refers to the degree of disagreement between study specific treatment effects and constitutes the basis of inconsistency. To test the heterogeneity of each pairwise comparison, we will use the I² statistic [17].
Assessment of transitivity and similarity
In addition to the heterogeneity assessment using the I² statistic, the assumption of transitivity and similarity based on clinical and methodological characteristics will be assessed. It should be noted that it is difficult to identify these effect modifiers using statistical analysis. We will assume that intervention effects are transitive in this network meta-analysis because we will only focus on drugs for the treatment of MetS, and we will investigate similarity based on clinical characteristics, such as drug dose, period of treatment and severity of pain symptoms at baseline, as well as according to methodological characteristics, such as study quality [18]. All of these effect modifiers will be judged and reported before the network meta-analysis is conducted.
Assessment of inconsistency
Evaluation and explanation of inconsistency is another basic objective of a network meta-analysis. In this context, inconsistency refers to the degree of difference between direct and indirect comparisons and can be evaluated only when a loop exists in the evidence network. This means that inconsistency assessment using a design by treatment interaction model cannot be conducted if the structure of this network is a ‘star network’ (ie, all interventions have a single mutual comparator, such as a placebo) [19,20]. For such cases, we will test inconsistency using a node splitting model [21].
To identify inconsistency among the included trials of the network, we will use Stata, performing the Z test to compare direct and indirect summary effects in specific loops [22]. If there is no inconsistency between loops or designs, we will use a consistency model to calculate the data. For cases of significant incoherence, we will initially look for data extraction errors in loops that present inconsistency and in comparisons with large heterogeneity. After the data have been scrutinized, we will investigate possible sources of inconsistency within the clinical and methodological variables suspected of being potential sources of either heterogeneity or incoherence in each comparison specific group of trials. If an important inconsistency cannot be explained, we will consider avoiding synthesis of the related network.
Additional analyses
To ensure the quality of this review, studies not reporting blinding will be excluded prior to data synthesis because blinding plays a vital important role in the RCT. We will assess heterogeneity quantitatively using the I² statistic, and if an I2 value is >50%, we will explore the source of heterogeneity. We will initially perform sensitivity analysis by excluding trials rated as having a high risk of bias. Additionally, meta-regression or subgroup analysis will be used to explore possible sources of heterogeneity if the number of included trials is sufficient. For network meta-regression, we will use a random effects network meta-regression model to examine potential factors.
This network meta-analysis is expected to provide a ranking of the interventions from guideline recommendations for PAD, based on comparative effectiveness evidence. We also hope that the result would be of interest to the policymakers of health insurance, this might help them to make a better choice of the interventions that should be covered by insurance. Therefore, this evidence will help patients and clinicians to make decisions in such settings. The results will also aid to the development and optimization of new interventions.
If it is necessary we will update this protocol in the future. We will submit the original protocol, final protocol and summary of changes as a supplement.
Ethical issues
No ethical approval is required because this study includes no confidential personal data or interventions with the patients.
Publication plan
This protocol has been registered (Registration number: CRD42018082024) with the PROSPERO (International Prospective Register of Systematic Reviews). The procedures of this systematic review and NAM will be conducted in accordance with the PRISMA-compliant guideline. The results of this systematic review and NAM will be submitted to a peer-reviewed journal for publication.
The authors declare that they have no competing interests.
Not applicable.
Not applicable.
Not applicable.
None.
LR, ASRB, ALDD, ACF, NPS, PMMD, HZ, RMLS, JLO, MN, AD, GBFO, GBZ, SAH, PEOR, AJG, RMCP, ACF, TMF, NN, SA, sCD, PFSG, A.A, AVH, RDL and FCV conceived the study idea and devised the study methodology. LR, ASRB, ACPC and ESR participated in the design and coordination of the study. LR was primarily responsible for protocol writing and developed the search strategy. LR and FCV will screen identified literature, conduct data extraction and analyses the review findings. All authors read the drafts, provided comments and agreed on the final version of the manuscript.
Not applicable.
- Smilowitz NR, Gupta N, Guo Y, Beckman JA, Bangalore S, et al. (2018) Trends in cardiovascular risk factor and disease prevalence in patients undergoing non-cardiac surgery Heart 5: 1-15. [Crossref]
- Shamseer L, Moher D, Clarke M (2015) Preferred reporting items for systematic review and meta-analysis protocols (PRISMA-P) elaboration and explanation. BMJ 349: 7640-7647. [Crossref]
- Wannamethee SG, Shaper AG, Lennon L (2004) Cardiovascular disease incidence and mortality in older men with diabetes and in men with coronary heart disease. Heart 90: 1398-1403. [Crossref]
- Higgins JP, Altman DG, Gøtzsche PC, Jüni P, Moher D, et al. (2011) The Cochrane Collaboration's tool for assessing risk of bias in randomised trials. BMJ 343: d5928. [Crossref]
- Higgins JP, Green S (2008) Cochrane handbook for systematic reviews of interventions. BMJ Publishing Group.
- White IR, Barrett JK, Jackson D (2012) Consistency and inconsistency in network meta-analysis: model estimation using multivariate meta-regression. Res Synth Methods 3: 111-125 [Crossref].
- White IR (2015) Network meta-analysis. Stata J 15: 951-985.
- Chaimani A, Salanti G (2015) Visualizing assumptions and results in network meta-analysis: the network graphs package. Stata J 15: 905-950.
- Rouse B, Chaimani A, Li T (2017) Network meta-analysis: an introduction for clinicians. Intern Emerg Med 12: 103-111. [Crossref]
- Higgins JP, Thompson SG, Deeks JJ, Altman DG (2003) Measuring inconsistency in meta-analyses. BMJ 327: 557-560. [Crossref]
- Higgins JP, Thompson SG, Spiegelhalter DJ (2009) A re-evaluation of random-effects meta-analysis. J R Stat Soc Ser A Stat Soc 172: 137-159. [Crossref]
- Jansen JP, Naci H (2013) Is network meta-analysis as valid as standard pairwise meta-analysis? It all depends on the distribution of effect modifiers. BMC Med 11: 155-159. [Crossref]
- Chaimani A, Higgins JP, Mavridis D, Spyridonos P, Salanti G (2013) Graphical tools for network meta-analysis in STATA. PLoS One 8: e76654. [Crossref]
- Salanti G, Ades AE, Ioannidis JP (2011) Graphical methods and numerical summaries for presenting results from multiple-treatment meta-analysis: an overview and tutorial. J Clin Epidemiol 64: 163-71. [Crossref]
- Salanti G, Del Giovane C, Chaimani A, Caldwell DM, Higgins JP (2014) Evaluating the quality of evidence from a network meta-analysis. PLoS One 9: e99682. [Crossref]
- Higgins JP, Thompson SG, Deeks JJ, Altman DG (2003) Measuring inconsistency in meta-analyses. BMJ 327: 557-560. [Crossref]
- Baker SG, Kramer BS (2002) The transitive fallacy for randomized trials: if A bests B and B bests C in separate trials, is A better than C? BMC Med Res Methodol 2: 13. [Crossref]
- White IR, Barrett JK, Jackson D, Higgins JP (2012) Consistency and inconsistency in network meta-analysis: model estimation using multivariate meta-regression. Res Synth Methods 3: 111-125. [Crossref]
- Higgins JP, Jackson D, Barrett JK, Lu G (2012) Consistency and inconsistency in network meta-analysis: concepts and models for multi-arm studies. Res Synth Methods 3: 98-110. [Crossref]
- Dias S, Welton NJ, Caldwell DM, Ades AE (2010) Checking consistency in mixed treatment comparison meta-analysis. Stat Med 29: 932-944. [Crossref]
- Lu G, Ades AE (2006) Assessing evidence inconsistency in mixed treatment comparisons. J Am Stat Assoc 101: 447-459.
- Veroniki AA, Vasiliadis HS, Higgins JP, Salanti G (2013) Evaluation of inconsistency in networks of interventions. Int J Epidemiol 42: 332-345. [Crossref]