Abstract
Tumor cells (murine melanoma) and human fibroblasts were simultaneously exposed to the chemotherapeutic agent etoposide (VP-16) and a static electric field (SEF) in a single or combinatory therapy. Single exposure to a SEF showed no significant differences in cell viability, whereas the combination with VP-16 induced apoptosis increases in both cell lines. Single VP-16 treatment induced apoptosis for up to 6 h, while the combination of both VP-16 and SEF extended apoptotic activity throughout for up to 24 h of exposure. The combined results of SEF with VP-16 induced a substantial increase of cell deaths, reducing VP-16 IC50 from 13 µM to 5.1 µM in melanoma cells, and from 12.6 µM to 3.2 µM in the fibroblast cells. Detection of apoptosis via Anexina V/PI and caspase 3 showed a 100% marks increase. Taken all together, the present results strongly indicate that SEF dramatically increases VP-16 apoptosis, which makes this physical agent a strong chemotherapeutic sensitizer.
Key words
Static Electric Fields, Chemosensitizer, Etoposide, Melanoma, Apoptosis
Introduction
In many biological systems of multicellular organisms, fundamental processes depend on electrical activities interacting with biochemical and molecular signaling pathways for various physiological functions [1-3]. The flow of ions generated by cells gives rise to electric fields which drive the following processes: cell division [4-6], migration [7-10], intracellular and genetic processes [11-17]. For practical application as its use for tumor treating fields [18], the effective anti-neoplastic treatment modality is delivered via noninvasive application of low intensity, intermediate frequency, and alternating electric fields [19-22].
In this study, we tested the possibility of electrically interfering in cellular activity with the use of an exogenous static electric field (SEF), which as a result should promote favor the process of cell death. To test this hypothesis, we induced cytotoxicity in cells (normal fibroblasts and melanoma cell lines) by treatment with the topoisomerase II (Top2) inhibitor etoposide [23,24] (VP-16), under the concomitant effect of a SEF. This combination was effective in increasing the rates of apoptosis, duplicating the number of cells in apoptosis by etoposide.
Materials and Methods
Cell lines and Culture Conditions
The B16F10 murine melanoma cell line was purchased from the American Type Culture Collection (Manassas, VA). Primary cultures of human skin cells (fibroblasts, FN1) were obtained from patient foreskins at a university hospital (Hospital Universitário–HU-USP). The project was financed by the CAPES, a Brazilian research foundation, and approved by the ethical committee (report HCFMUSP n°921/06). These cells were grown in 75 cm2 flasks in culture medium DMEM (Cultilab, São Paulo, Brazil) supplemented with 10% heat-inactivated fetal bovine serum (Cultilab), 2 mML-glutamine (Sigma Chemical Company, USA), and 0.1 g/mL streptomycin (Fontoura-Wyeth AS, USA).
Static Electric Field (SEF)
Treatment with Static Electric Field (SEF) was achieved using an adjustable high voltage source with standardized intensity at 1000 V/cm. Two electrodes were connected to an aluminum capacitor composed of parallel circular plates (chemically sterilized by immersion in 70% ethanol) arranged vertically to the culture plates inside the growth chamber under standard environmental conditions, partly isolated by a plastic bracket. All experiments were performed on four experimental groups: no treatment group cells, cells treated only with VP-16 (control), cells only exposed to SEF and cells exposed concomitantly to VP-16 and SEF.
Cell viability assay (MTT assay)
The B16F10 melanoma cells and FN1 fibroblasts used in the MTT assay [25] were cultivated in 96-well plates at a density of 105 cells/mL and then incubated for 24 h. They were then treated with different concentrations of etoposide (VP-16) or paclitaxel (PTX; semi synthetic 5ml Evotaxel 30 and 16.7 ml Evotaxel 100) diluted in 0.9 % NaCl at concentrations ranging from 1.75 to 20 μM for VP-16 and 0.5 to 10 μM for PTX for 24 h. No treatment group was treated with the diluent only. After 24 h of treatment with SEF, VP-16 or VP-16 and SEF, 10 μM MTT (Sigma Chemical Company, USA) was added to each well for an additional 4 h. The blue MTT formazan precipitate was dissolved in 100 μL DMSO. The absorbance at 540 nm was measured with a multi-well plate reader. Cell viability was expressed as a percentage of no treatment cells, and the data are shown as the mean value ± standard deviation (SD) of the six independent experiments.
Analysis of apoptosis by flow cytometry
After treatment (3.5 μM for VP-16 and SEF), cells were pelleted by centrifugation at 1800 rpm for 10 min and incubated with 1 mg of specific anti-caspase-3 PE antibody (Santa Cruz, USA)26 and 10 mL of Triton X-100 (0.1%) for 1 h at 4°C. After that, the cells were resuspended in Facs flow buffer. The samples were analyzed for fluorescence (FL-2H detector) on a Becton Dickinson Facscan flow cytometer using a Cell Quest software.
Analysis of Annexin V -FACS and propidium iodide by flow cytometry
Annexin V staining detects the translocation of phosphatidylserine from inner to outer cell membrane during early apoptosis and propidium iodide (PI) can enter the cell during late-stage apoptosis and also stains dead cells. After treatment (3.5 μM for VP-16 and SEF) the cells in the supernatant and adherent cells were washed with PBS and binding buffer (10 mM HEPES pH 7.5 containing 140 mM NaCl and 2.5 mM CaCl2) and then stained with 1 µg of annexin V-FITC (Santa Cruz Biotechnology, USA) and 18 µg/mL of propidium iodide (Sigma-Aldrich Corp.). Each sample was analyzed by flow cytometry using the FL-1 and FL-2 channels to distinguish apoptotic, necrotic, and viable cell populations [26]. The analysis for both markers was performed on a FACSCalibur flow cytometer using the CellQuest software (FACSCalibur; Becton Dickinson). Samples were collected after 2-24 h of treatment in order to observe their behavior.
Statistical analysis
The values are expressed as mean ± SD. Data were analyzed using a one-way analysis of variance. Significant differences in the means were determined using multiple comparisons with the (ANOVA) test at a significance level of p ≤ 0.05 alone.
Results
The two different cell lines analyzed, B16F10 melanoma and FN1 fibroblast showing similar results in IC50 for chemotherapeutic drug VP-16 after 24 h (Figures 1A and 1B, respectively). Metabolic activity and resistance to apoptosis in tumor cells in relation to the normal cells there is no significant difference in the results of the combined electric field with chemotherapeutic activity. The results showed selective cytotoxic effects or difference that could be attributed to the inherent differences in the cell lines. Quantitative results in the viability assay for both cell lines were very similar, with slight differences found in the behavior of cellular viability in relation to time (Figures 3 and 4).
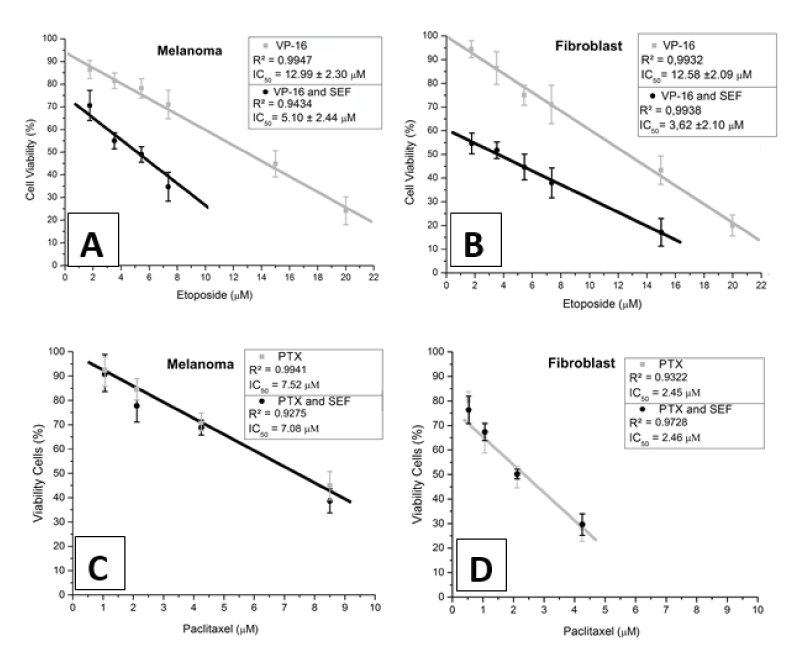
Figure 1. Cellular viability as a function of the chemotherapeutic drug concentration. Stand-alone exposure to etoposide (◼ VP-16) and combined exposure to etoposide and SEF (• VP-16 and SEF). The straight line fitted to the experimental results makes salient the linear decreasing tendency of cellular viability for melanoma cells (A) and fibroblasts (B). Panels C and D indicate cellular viability in response to paclitaxel exposure. The overlapping data points correspond to: exposure to PTX alone (gray ◼) and simultaneous exposure to both PTX and SEF (black •) in melanoma cells (panel C) and fibroblasts (panel D).
In this study, we showed that stand-alone exposure to SEF has no measurable effect in cell death in both, melanoma and fibroblasts (Figures 3 and 4 below the left). The SEF was tested in different intensities where 1000 V/cm had the most effective result in cytotoxic potentiation of etoposide among the tested intensities in 24 h. Values 50% higher than 1000 V/cm did not show an increase in VP-16 cytotoxicity (not shown to avoid redundancy).
The graphs in Figure 1A and 1B show the viability (using the MTT assay) of cells exposed to the SEF as a function of the VP-16 concentration. An inspection of these figures reveals that, consistently, the viability responds linearly to the VP-16 concentration interval in this experiment (that is, from 1.75 to 20 µM). From this line, we observe that the 50% inhibitory concentration (IC50) for VP-16 is equal to 13µM and 12.6µM, for fibroblasts and melanoma cells, respectively (Figures 1A and 1B).
As seen in Figures 1A and 1B, exposure to the SEF promoted an additional decrease in viability also responding linearly to the VP-16 concentration, but with a steeper slope. Equally, as for the experiment with VP-16 only, a straight line was obtained by best-fit providing 50% inhibitory concentrations (IC50) of (5.1 ± 2.4) µM in B16F10 melanoma cells (Figure 1A) and (3.2 ± 2.1) µM in FN1 fibroblasts (Figure 1B).
In addition to the use of VP-16 as a DSB-inducing chemotherapy (DSB stands for Double Strand Break), PTX was used in these studies as a chemotherapeutic agent with distinctive properties in cell death, to compare with VP-16. The results presented in Figure 1C (melanoma) and Figure 1D (fibroblast) showed a superposition of control trend lines (with only PTX) and those combined with the SEF. It is notable that there was no influence of the SEF in an increase in cell death by PTX after 24 h of treatment.
Values represent reduction percentages of viability comparatively to averaged viability from the VP-16 group (set as 0%) from for the 0, 1 and 2 h between the application of VP-16 and the SEF in Figure 2, shows results for reduction in cell viability by the action of the SEF, as a function of the time interval (t) following application of VP-16 (t=0 h). These values represent reduction percentages of viability comparatively to averaged viability from the VP-16 group (set as 0%) from for the 0, 1 and 2 h between the application of VP-16 and the SEF. The values shown were measured with 50% inhibitory concentration (IC50) in cell viability. determined by the MTT test results, where a significant reduction in the ability of the SEF to decrease cell viability was found within an increasing period after VP-16 application, indicating a fall in the mitigation of effect of the SEF effect on the viability in the at conditions of one hour or more in the combined treatment. The viability values within a 2-h interval of application have no statistical significance in relation to the results of cytotoxic effects of VP-16 alone.
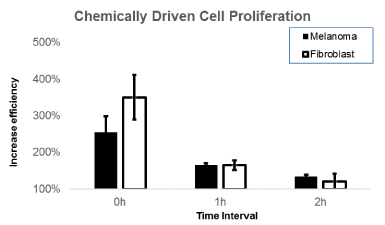
Figure 2. The increased efficiency on the reduction in cell viability by the action of a SEF as a function of the time interval (t) following application of VP-16 (t = 0h). These values represent reduction percentages of viability comparatively to averaged viability from the VP-16 alone group (set as 100%) taken at 0, 1and 2 h between the application of VP-16 and SEF, based on the Inhibitory Concentration of 50% obtained through the MTT test in melanoma cells (black) and fibroblasts (white).
The flow cytometry results at a concentration of 3µM of VP-16 for annexin/PI and caspase-3 (Figures 3 to 5). The PI intercalates between DNA bases, indicating necrosis, but when combined with annexin V staining indicates late or early apoptosis of the respective cell cultures after 6 h of exposure are shown above the graphs for annexin V/PI. The effect of the SEF in combination with the chemotherapeutic drug VP-16 increased the number of cells in early apoptosis (EA) in the 4-6 h of time interval treatment in melanoma cells (for significance levels of p ≤ 0.01 for fibroblast and p ≤ 0.05 for melanoma). However, fibroblasts (Figure 4) showed an increase of early (EA) and late apoptosis (LA) within 4 h of SEF treatment, Indicating a distinct but equivalent metabolic behavior. There was no evidence of apoptosis or necrosis induced by isolated exposure to the SEF for 24 h, providing values close to the control group for both markers annexin V/PI, which is in agreement with data showing that caspase-3 protein expression was unchanged. On the other hand, the induction of necrosis by VP-16 in fibroblast cells (figure 4) hasn’t changed during the exposure time (6 h) in the combined effect with VP-16, excluding the possibility of a necrosis increase by the combined action of the SEF and VP-16, as observed with apoptosis.
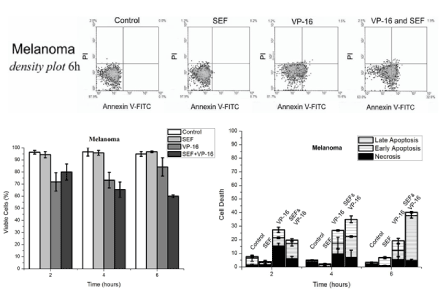
Figure 3. Above: Density plot of Annexin V -FITC and PI expression in murine melanoma cells after 6 h of treatment. Below the left: Bar graphs representing the number of cells that are viable under control conditions, with the application of etoposide (VP-16), an electric field (SEF) or combined treatment (VP-16 and SEF) after 2, 4 and 6 hours of treatment. Below the right: Cell death separated by: necrosis, initial apoptosis and late apoptosis by bar of overlapping graphs for treatments and periods equivalent to that of cell viability.
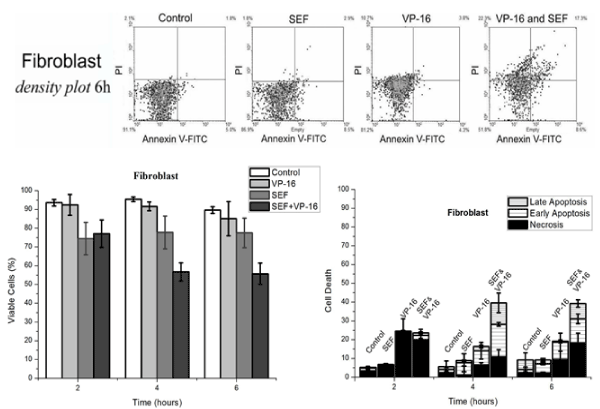
Figure 4. Above: Density plot of Annexin V and PI expression in normal human fibroblasts after 6 h of treatment under the same conditions as in Figure 3. Below: Comparative treatment effect in cells are viable (left) and death cell (right) of overlapping graphs undergoing necrosis, early apoptosis and late apoptosis, after 2, 4 and 6 h of treatment.
Figure 5 shows the levels of caspase-3 expression after VP-16 alone and combined with exposure to the SEF in melanoma and fibroblast cells (A and B, respectively). Caspase-3 is used as a marker of apoptotic activity, since it is present in different activated forms [27,28]. It was not possible to detect any statistically significant differences between samples obtained for no treatment conditions and those submitted to the SEF alone. In melanoma cell line, the cleavage of caspase-3 was decreased by the action of VP-16 within the first 4 h, in contrast to the increase induced by the SEF thereafter. The effect of the SEF increased apoptosis significantly, by approximately 30% for melanoma(A) and 35% for fibroblast (B), which continued up to the 24 h for time point. This result indicates an increase in the pro-apoptotic action of VP-16 during exposure to the SEF, supporting the increase of apoptosis indicated in the annexin V/PI trial and apoptosis markers.
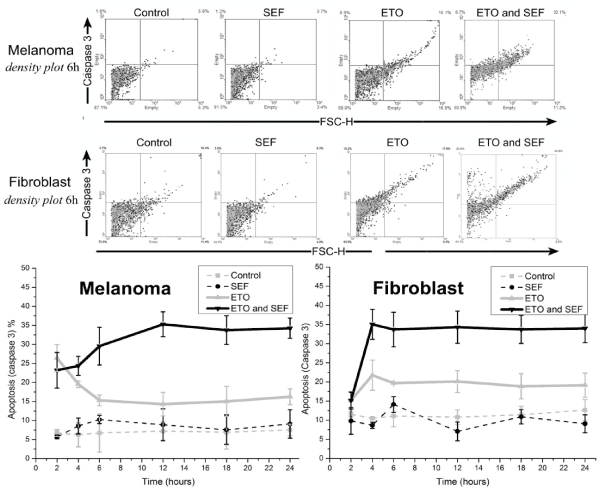
Figure 5. Above: Density plot figures for the 6-hour period, indicating molecular markers for caspase-3 activity, under control conditions, with the application of etoposide (VP-16), an electric field (SEF) or combined treatment (VP-16 and SEF) in melanoma and fibroblasts cell cultures. Below: Percentage of apoptotic cells with etoposide treatment alone (VP-16-▲-) and combined with exposure to SEF (-▼-). Stand-alone exposure to SEF (•) led to no death by apoptosis, with values close to those of control cells (◼) after the 24 h.
Discussion
Previous experimental results from our research group have shown that organisms submitted to gamma radiation and immediately after exposed exposure to a SEF demonstrate the persistence of the gH2AX histone [29], thus revealing the ability of SEFs to inhibit repair, while since the persistence of gH2AX reflects the presence of unrepaired DNA damage [30-32]. As with ionizing radiation, cells treated with VP-16 also show a response in the MRN complex which works in the ATR pathway, in response to various DNA damaging agents [31,33], revealing a connection with the response factors of repair via ATM and ATR which, similarly to gH2AX, work within a few minutes after the application of VP-16 [33,34].
The VP-16 action inhibits the DNA rebinding ability of Topoisomerase II enzymes, which acts in response to DNA damage [35], compromising cellular viability by creating structural lesions [36] causing damage accumulation of Double Strand Break (DSB) in cells [37]. These damages cannot be repaired and persists into the G2 phase, leading to cellular death by apoptosis [36,38,39]. This action of VP-16 effectively activates apoptosis [40], even in cells weakly affected by this mechanism, such as melanoma cells [38].
The sensitization is directly related to the concomitant application of VP-16 with SEF (Figure 2), suggesting that the SEF-mediated chemosensitizer effect has a direct action on non-repaired DSB, losing efficacy as the repair mechanism operates in the cell.
The VP-16 may cause damage which leads leading to a persistent DSB response [33], promoting the recruitment of the machinery for DNA fragment rebinding. The action of the SEF probably interferes with the polarization of polar molecules [41] and specially DNA fragments, by altering and redirecting small and large fragments within the field lines. Since a SEF is able to induce inflict torque in polar fragments, it is expected that this effect may interfere with the recruitment of molecules and proteins linked directly or indirectly with cellular repair [34]. This induces persistent non-repairable DSB, a condition which in turn activates the G2 checkpoint, induces apoptosis [42], and is likely responsible for the chemosensitizer effect between the SEF and VP-16.
The aforementioned evidence is consistent with the results shown in Figures 1A and 1B, where the inhibition of cell viability increased with the combination of the SEF and a DSB generating agent. The effect of this combined treatment allowed the use of a lower concentration of VP-16 to generate a higher index rate of cell death. These results are distinct from what happened with PTX, shown in Figures 1C and 1D, which promoted the inhibition of mitosis [43] by acting as a negative control for the effects of the SEF and another cytotoxic agent that does not generate DSB. In this case, the SEF did not show a chemotherapy sensitization effect regarding cell viability.
In At the higher concentration range (5–50 μM) PTX blocked the entry into S phase, which led to inhibition of cell proliferation and the induction of necrosis [44]. The result indicates that ion and molecule polarization by the SEF don’t interfere directly in the processes of cell death and, by considering the applied levels of concentration of PTX, that the electric field also doesn’t act directly in the cell death (by either necrosis or apoptosis). This result is supported by the stable levels of necrosis induced by VP-16 and measured via annexin V/IP in fibroblasts in (Figure 4) that which, in contrast to the apoptosis values, didn’t result in led to an increase when exposed to the SEF. As an example of damage formation, VP-16 in tumor cells (HL60 cells) induces an increase in apoptosis between 3-4 h during the exponential growth phase [38] at the same time that an increase in of DNA fragmentation takes place [37,40]. Caspase-3 is an effector of the apoptotic cascade (both intrinsic and extrinsic pathways) and works actively to generate nuclear fragmentation and DNA degradation. Moreover, as previously mentioned, previously apoptosis and DNA fragments are directly linked to unrepaired DNA [42], and the results of this study are consistent with apoptosis based on supported by the increase in caspase-3 expression and the annexin-PI assay. However, normal fibroblasts did not show significant changes in apoptosis after 2 h of treatment with VP-16. This result is consistent with the behavior of these cells, which in the presence of DSB inhibit the cell cycle [36]. The chemotherapy sensitizer effect of the SEF led to a significant increase in mortality (for both lineages, i.e. melanoma cells and normal fibroblasts), particularly after 2 h; this circumstance persisted for a period of 24 h, during which the analyses were performed. Regarding apoptosis in melanoma cells and fibroblasts, the results of this work are consistent with the accumulation of damage that has not been properly repaired. In fibroblasts, the expression of caspase-3 (Figure 5B) showed a continuous plateau of expression after 4 h in cells treated with VP-16 only or with the SEF, as well. However, the values of apoptosis were almost doubled with the combined treatment. The increase in caspase-3 expression after 2 h suggests the inhibition of mitosis and, as result, biochemical mechanisms are triggered, and so cells stop their cycling to repair. Although the periods of cell arrest were similar, the combined treatment led to higher values of caspase-3, indicating a higher index rate of apoptosis; thus, a smaller number of repaired cells is achieved. Melanoma cells showed similar results (Figure 5A) with the combined treatment, in which where an increase of apoptosis was observed. On the other hand, there was no plateau; such evidence is expected in a cell line that has not undergone cell arrest.
Unlike alternating electric fields, the use of a SEF leads to no energy transfer and no heat generation; such features allow for extended exposure of biological tissues in vivo. The results found in this study promote the use of Static Electric Fields the SEF to intensify the actions of chemotherapeutic treatments such as VP-16, due to enhanced apoptosis-like programmed cell death processes. The concomitant use of a SEF can be used as a basis to increase the efficiency of treatment in neoplastic tumors, in which the use of VP-16 and radiotherapy are indicated. The major advantages of this chemosensitizer are restricted to the application area of the electric field, thus directing increased mortality to only to the target and surrounding cells. This allows for intensifying the effects these drugs effects without major damage to other cells outside the tumor, thereby reducing the side effects associated with chemotherapy and radiation.
Final Remarks and Conclusions
It was dramatically demonstrated in this work that exposing cells to a SEF, following treatment with VP-16, nearly duplicates the apoptosis rate while not showing a induction of necrosis. Exposure to a SEF extends the apoptotic period up to 24h.
Educated guesses,
- The action of a SEF interferes with repair processes (those inhibiting apoptosis) by inducing apoptosis for extended periods of time.
- According to previous studies in our laboratory, repair interference by means of a SEF is driven by the reorientation of protein pathways to damaged sites.
References
- McCaig CD, Rajnicek AM, Song B, Zhao M (2005) Controlling cell behavior electrically: current views and future potential. Physiol Rev 85: 943-978.
- McCaig CD, Song B, Rajnicek AM (2009) Electrical dimensions in cell science. J Cell Sci 122: 4267-4276. [Crossref]
- Ross CL (2017) The use of electric, magnetic, and electromagnetic field for directed cell migration and adhesion in regenerative medicine. Biotechnology Progress 33: 5-16.
- Song B, Zhao M, Forrester JV, McCiag CD (2002) Electrical cues regulate the orientation and frequency of cell division and the rate of wound healing in vivo. Proc Natl Acad Sci U S A 99: 13577-13582. [Crossref]
- Wang E, Yin Y, Zhao M, Forrester JV, McCiag CD, et al. (2003) Physiological electric fields inhibit proliferation of vascular endothelial cells by block at G1. FASEB J 17: 458-460.
- Yin Y, Zhao M, Forrester JV (2003) Physiological electric fields control the G1/S phase cell cycle checkpoint to inhibit endothelial cell proliferation. FASEB J 17: 458-460.
- Bear JE, Haugh J.M (2014) Directed migration of mesenchymal cells: where signaling and the cytoskeleton meet. Curr Opin Cell Biol 30: 74-82. [Crossref]
- Li X, Kolega J (2002) Effects of direct current electric fields on cell migration and actin filament distribution in bovine vascular endothelial cells. J Vascu Res 39: 391-404.
- Schwab A, Fabian A, Hanley PJ, Stock C (2012) Role of ion channels and transporters in cell migration. Physiol Rev 92: 1865-1913. [Crossref]
- Sullivan K, Balin AK, Allen RG (2011) Effects of static magnetic fields on the growth of various types of human cells. Bioelectromagnetics 32: 140-147. [Crossref]
- Tuszyński JA, Portet S, Dixon JM, Luxford C, Cantiello HF, et al. (2004) Ionic wave propagation along actin filaments. Biophys J 86: 1890-1903. [Crossref]
- Tyner KM, Kopelman R, Martin A (2007) Philbert “Nanosized voltmeter” enables cellular-wide electric field mapping. Biophys J 93: 1163-1174. [Crossref]
- Priel A, Tuszynski JA, Cantiello HF (2005) Electrodynamic signaling by the dendritic cytoskeleton: toward an intracellular information processing model. Electromag Biol Med 24: 221-231.
- Priel A, Ramos AJ, Tuszynski JA, Cantiello HF (2006) A biopolymer transistor: electrical amplification by microtubules. Biophys J 90: 4639-4643. [Crossref]
- Sollazzo V, Palmieri A, Pezzetti F, Massari L, Carinci F, et al. (2010) Effects of pulsed electromagnetic fields on human osteoblastlike cells (MG-63): a pilot study. Clin Orthop Relat Res 468: 2260-2277. [Crossref]
- Heermeier K (1998) Effects of extremely low frequency electromagnetic field (EMF) on collagen type I mRNA expression and extracellular matrix synthesis of human osteoblastic cells. Bioelectromagnetics 19: 222-231.
- Jennings J, Chen D, Feldman D (2008) Transcriptional response of dermal fibroblasts in direct current electric fields. Bioelectromagnetics 29: 394-405.
- Beebe S (2015) Mechanisms of Nanosecond Pulsed Electric Field (NsPEF)-induced cell death in cells and tumors. J Nanomed Res 2: 00016.
- Rivera F, Gallego J, Guillen C, Benavides M, Lopez-Martin JA, et al. (2016) PANOVA: A pilot study of TTFields concomitant with gemcitabine for front-line therapy in patients with advanced pancreatic adenocarcinoma. Annals Oncol 27: ii37.
- Giladi M (2016) Alternating electric fields (TTFields) induce immunogenic cell death resulting in enhanced antitumor efficacy when combined with anti-PD-1 therapy. J Immunol 196: 75-26.
- Pavesi A, Adriani G, Tay A, Warkiani ME, Yeap WH, et al. (2016) Engineering a 3D microfluidic culture platform for tumor-treating field application. Sci Rep 6: 26584. [Crossref]
- Kirson ED, Dbaly V, Tovarys F, Vymazal J, Soustiel JF, et al. (2007) Alternating electric fields arrest cell proliferation in animal tumor models and human brain tumors. Proc NatL Acad Sci 104: 10152-10157. [Crossref]
- Lui LF (1989) DNA topoisomerase poisons as antitumour drugs. A Rev Biochem 58: 351-375.
- Baldwin EL, Osheroff N (2005) Etoposide, topoisomerase II and cancer. Curr Med Chem-Anti-Canc Agents 5: 363-372.
- Mosmann T (1983) Rapid colorimetric assay for cellular growth and survival: application to proliferation and cytotoxicity assays. J Immunol Methods 65: 55-63. [Crossref]
- Porter AG, Jänicke RU (1999) Emerging roles of caspase-3 in apoptosis. Cell Death Differentiation 6: 99-104.
- Faião-Flores F (2011) Boron neutron capture therapy induces cell cycle arrest and DNA fragmentation in murine melanoma cells. Appl Radiation Isotopes 69: 1741-1744.
- Jänicke RU (1998) Caspase-3 is required for DNA fragmentation and morphological changes associated with apoptosis. J Biolo Chem 273: 9357-9360.
- Arruda-Neto JDT, Friedberg EC, Bittencourt-Oliveira MC, Segreto HR, Moron MM, et al. (2010) The role played by endogenous and exogenous electric fields in DNA signaling and repair. DNA Repair 9: 356-357. [Crossref]
- Rogakou EP, Pilch DR, Ann H. Orr, Ivanova VS, Bonner WM, et al. (1998) DNA double-stranded breaks induce histone H2AX phosphorylation on serine. J Biol Chem 273:5858-5868.
- Chowdhury D, ChristopherKeogh M, Ishii H, Peterson CL, Buratowski S, et al. (2005) γ-H2AX dephosphorylation by protein phosphatase 2A facilitates DNA double-strand break repair. Mole Cell 20: 801-809.
- Foster ER, Downs JA (2005) Histone H2A phosphorylation in DNA double‐strand break repair. FEBS J 272: 3231-3240.
- Rong Fan J, Peng AL, Chin Chen H, Shu-Chi Lo, Hsiang Huang T, et al. ( 2008) Cellular processing pathways contribute to the activation of etoposide-induced DNA damage responses. DNA Repair 7: 452-463.
- Francis AC, Pluth JM, Anderson JA, Harper JV (2008 ) Biochemical kinetics model of DSB repair and induction of γ-H2AX foci by non-homologous end joining. Radiation Res 169: 214-222.
- Champoux JJ (2001) DNA topoisomerases: structure, function, and mechanism. Annual Rev Biochem 70: 369-413. [Crossref]
- Montecucco A, Biamonti G (2007) Cellular response to etoposide treatment. Cancer Letters 252: 9-18.
- Soubeyrand S, Pope Haché RJG (2010) Topoisomerase IIα-dependent induction of a persistent DNA damage response in response to transient etoposide exposure. Mole Oncol 4: 38-51.
- Negri C, Bernardi R, Braghetti A, Ricotti GC, Scovassi AI. et al. (1993) The effect of the chemotherapeutic drug VP-16 on poly (ADP-ribosylation) in apoptotic HeLa cells. Carcinogenesis 14: 2559-2564.
- Bernardi R, Negri C, Donzelli M, Guano F, Torti.M, et al. (1995) Activation of poly (ADP-ribose) polymerase in apoptotic human cells. Biochem 77: 378-384.
- Sordet O, Khan QA, Kohn KW, Pommier Y (2003) Apoptosis induced by topoisomerase inhibitors. Curr Med Chem-Anti-Canc Agents 3: 271-290.
- Kong, w.; Bulthuis, j. (2000) Orientation of asymmetric top molecules in a uniform electric field: Calculations for species without symmetry axes. The Journal of Physical Chemistry Agents 104:1055-1063.
- Roos WP, Kaina B (2006) DNA damage-induced cell death by apoptosis. Trends Mole Med 12:440-450.
- Long BH, Fairchild CR (1994) Paclitaxel inhibits progression of mitotic cells to G1 phase by interference with spindle formation without affecting other microtubule functions during anaphase and telephase. Cancer Res 54: 4355-4361.
- Yeung TK,Germond C, Chen X, Wang Z (1999) The mode of action of taxol: apoptosis at low concentration and necrosis at high concentration. Biochem BiophyS Res Communications 263: 398-404.


