Abstract
Introduction and objective: To report the hydrodynamic of a porous orifice (G) tube as replacement for the wrong Starling’ law
Material and method: Hydrodynamics of the G tube, based on capillary ultrastructure, were studied. The effect of changing G tube orifice diameter, proximal pressure and distal pressure on the side pressure and C pressure were evaluated. The literature on capillary physiology was reviewed.
Result: Hydrodynamics of the G tube showed that proximal, akin to arterial, pressure induces a negative side pressure gradient on the G tube wall, which is negative causing suction maximum near the inlet and turn positive maximum near the exit causing filtration. This created the rapid, autonomous magnetic field like fluid circulation phenomenon between G and C.
Conclusion: Hydrodynamic studies of the G tube challenge the role attributed to arterial pressure as a filtration force in Starling’s law. A perspective literature review shows that the oncotic pressure force has been previously cancelled and the law has failed to explain the capillary–ISF transfer in most parts of the body. A concept based on the new hydrodynamic phenomenon of the G tube is proposed to replace Starling’s law for the capillary–ISF circulation. A rapid autonomous dynamic magnetic field-like G–C circulation occurs between fluid in the G tube’s lumen and a surrounding fluid compartment C. Factors which initiate, regulate and affect the G–C circulation, its physiological and haemodynamic relevance and its clinical importance to the pathogenesis of oedema, shock and the MVOD/F syndrome are discussed.
Key words
capillary dynamics, starling’s law, fluid therapy
Abbreviations
VO: Volumetric overload, VOS: Volumetric overload shocks, VOS1: Volumetric overload shock, Type 1, VOS2: Volumetric overload shock, Type2, TURS: The transurethral resection of the prostate syndrome, ARDS: The adult respiratory distress syndrome, MVOD/F: The multiple vital organ dysfunction/ failure syndrome, HN: Hyponatraemia, BP: Arterial Blood pressure, CVP: Central venous pressure, PV: Plasma volume, ISF: Interstitial fluid volume, G Tube: The Porous Orifice Tube,
PP: Proximal pressure to the G tube akin to arterial Blood pressure, DP: Distal Pressure to the G tube akin to venous pressure, LP: Lumen pressure of the G tube, FP: Flow pressure is the positive pressure inside the G Tube, SP: Side pressure is the negative pressure inside the G Tube
Introduction
In 1886, Starling proposed a hypothesis for the capillary–interstitial fluid (ISF) transfer, in which the capillary was thought a tube of a uniform diameter and its wall is impermeable to plasma proteins [1]. The flow of fluid across its wall was thought dependent upon a balance between the hydrostatic pressure within its lumen (Pc), encouraging fluid to leave ‘filtration’, and the osmotic pressure of plasma proteins or oncotic pressure(c), tending to draw fluid back to the capillary lumen ‘absorption’, with similar opposing forces in the ISF space.
At the arterial end of the capillary, lumen pressure (LP) is greater than the oncotic pressure and fluid is pushed out. At the venous end, oncotic pressure is greater than LP and fluid is drawn in. The physical basis on which LP of a capillary was thought positive and responsible for filtration was Poiseuille’s work (1799–1869) on long Brass tubes of uniform diameters [2]. However, Burnoulli’s effect of a fluid jet and Venturi’s effect of a tube constriction are well known and must also be considered to be of significance even under laminal flow conditions. LP refers to the arterial pressure of a capillary.
Starling’s hypothesis has undergone extensive evolution to become a law prior to the discovery of the capillary ultra-structure of the pre-capillary sphincter [3] and its porous wall [4] plus the osmotic chemical composition [5], negative pressure of ISF [6] and lymph [7]. Inadequacy in explaining the capillary–ISF transfer in many parts of the body [8], particularly vital organs, has previously called for reconsideration of Starling’s hypothesis [9]. In 1984, clinical observations inconsistent with Starling’s hypothesis prompted a physical study to verify LP and fluid dynamics in a porous orifice tube with reference to the effect of the pre-capillary sphincter, arterial and venous pressures on the capillary–ISF transfer. The observation was: during hypotension shock in which prompt and adequate vascular expansion for resuscitation, all fluids leaked into and drowned the ISF space and filled the potential body cavities, demonstrated on post-mortem examination [10,11].
Perspective literature review of capillary physiology
Folkow and Neil [2] stated that: ‘The greatest discovery in medical science was made by William Harvey, who showed in 1628 that the heart pumped the blood around the circulatory system and understood that the circulation provided nourishment for the tissues. Four centuries earlier, however, Ebn Al-Nafis (1210–1298), discovered the pulmonary circulation. Both the systemic and pulmonary circulations exist to provide for tissues’ viability.
Capillary circulation is directly responsible for this vital function in every organ and tissue.
In 1886, Starling [1], a great physiologist, proposed a hypothesis for the capillary–ISF exchange. It was based on two known physical forces; LP based on Poiseuille’s tube as a filtration force and the oncotic pressure as a absorption force. In 1929, Landis [12] measured LP of a capillary, by a cannula facing up stream, which was 32 and 12 mmHg at the arterial and venous ends, respectively. In 1948, Pappenheimer and Soto-Rivera [13] studied the quantitative changes in the weight of isolated hind limbs of dogs induced by alterations of the arterial and venous pressures. Oedema was induced by increasing the venous pressure in order to match any increase in the arterial pressure (mmHg for mmHg). Such, ‘isogravimetric state’, in which capillary filtration exceeds absorption, as would be expected with high venous pressure, was thought in support of Starling’s hypothesis. The authors also found that the osmotic pressure of a concentrated plasma solution was 23–28 mmHg in vitro. Ever since, most physiologists have accepted Starling’s hypothesis as a physiological law.
However, most of the enlightening scientific evidence on microcirculation started to appear decades later. In 1960, Mellander [14] showed that ISF ‘absorption’ increased after autonomic stimulation, which narrows the lumen of ‘micro-vessels’ and increases arterial pressure. In 1962, Hendry [5] measured the oncotic pressure of various body fluids and found it identical to that of the plasma, pointing out: ‘the osmotic pressure of plasma proteins is too weak a force to return fluids back into the capillary lumen’. In 1963, Guyton and Colman [6] measured ISF tissue pressure, using a subcutaneously implanted perforated capsule, and found that it has a negative value of –7 cm water. In 1972, Calnan et al. [7] confirmed this finding and showed that molecules, including plasma proteins, pass freely and rapidly between the capillary blood and the implanted capsule, and vice versa. In 1967, Rhodin [3] showed that the capillary tube is encircled by a cuff of smooth muscle fibres at its arteriolar junction, named the pre-capillary sphincter (3–5 m), which is the narrowest part of the whole vascular system. Also, in 1967, Karnovesky [4] showed that the capillary wall is made of flat cells and their intercellular junctions are slits 10 to 20 nm wide which are the pores through which fluids, nutrients and protein molecules pass freely. His photographs show the stained horse radish globules, which are much larger than plasma protein molecules, passing through these pores. The findings, concerning plasma proteins and capillary pores alone, have cancelled the absorption force in Starling’s law.
In 1983, Mattfeldt and Mall [15] reported the ultra-structure dimensions of capillaries. The ‘ideal’ capillary is a tube connecting an arteriole to a venule. According to Crogh’s model it is a perfect, anisotropic, straight and un-branched tube with a diameter of 7–18 m. The pre-capillary sphincter and intercellular slits make the capillary a strait ‘porous orifice tube’, based on which the G tube was made on a larger scale. In 1982, Keele, Neil and Joels [8], pointed out that the concentration of tissue proteins in the liver, lung and muscles is 60% that of plasma proteins. In the pulmonary circulation the arterial pressure is less than the plasma oncotic pressure. Thus, fluid filtration in the lungs and absorption in the liver and muscles lacks explanation. The oncotic pressure neither can explain the negative pressure in ISF space [6] nor the speed and efficiency with which the capillary–ISF fluid, nutrients and oxygen transfer occurs. Lymph drainage cannot explain the negative ISF pressure [6,7]. This knowledge on capillary ultra-structure and permeability to macromolecules, prompted Renkin (1986) to call for reconsideration of Starling’s hypothesis but an alternative mechanism was evolving at this time.
The questions and logic
The above clinical observation, augmented with another that although arterial hypertension is very common it does not cause oedema, posed the questions: If LP is a filtering force in the capillary, how such massive fluid was filtered into ISF space during hypotension? Is LP truly responsible for filtration and, if not, what does it do? The logic that followed was that: if Dr Starling had based his hypothesis on Poiseuille’s results of physical experiments, similar studies on tubes built on a scale to the capillary ultra-structure, should answer the questions.
Background
This work was presented as an appendix in MD thesis [10] for explaining the haemodynamic disturbance of vascular volumetric overload (VO) culminating in irreversible shock, multiple vital organ dysfunction or failure
(MVOD/F) syndrome and massive ISF shift [11]. The study identified different roles of a dynamic LP and discovered a new hydrodynamic phenomenon that may be relevant to capillary physiology with important clinical implications. A perspective literature review on the capillary physiology contrasts a concept based on the new phenomenon with the received hypothesis under physiological and pathological conditions, proposing an alternative mechanism to starling’s law for the capillary–ISF circulation.
Material and method
Tubes with an orifice at the inflow end were used for investigating fluid dynamics. Flow of fluid was obtained by connecting the orifice tube either to a tap, a water reservoir or it is incorporating in a circulatory model, in order to obtain flow under stable inflow proximal pressure (PP), outflow distal pressure (DP) and known orifice/tube diameters. LP of a fluid jet inside a tube has two components: a. the pressure of the fluid as measured via a small
cannula, or a needle, facing up stream into the oncoming fluid; the flow pressure (FP). b. the pressure exerted by the fluid upon the sides of the tube, as measured by a perpendicular cannula or a needle facing downstream, called the side pressure (SP). An upscale model based upon the known capillary ultra-structure was later used. A porous orifice (G) tube, incorporated in a surrounding fluid chamber (C), made the G–C apparatus used to study fluid dynamics and transfer through side holes along the G tube’s wall. The G–C apparatus was connected to manometers for recording pressure changes inside the tube’s lumen as well as inside C chamber (CP). Fluid transfer between the lumen of the G tube and C, through the pores of the G tube, is called the G–C circulation.
Objectives
The objective was to verify the role attributed to LP and whether its effect in a porous orifice tube is filtration as in Poiseuille’s tube. The orifice and holes of the G tube represent the pre-capillary sphincter and pores in its wall, respectively. The G–C apparatus simulates a capillary–ISF unit. The G tube and G–C circulation mimic a capillary tube and capillary–ISF circulation model, respectively. PP and DP simulate arterial and venous pressures, respectively. FP and SP are the positive and negative energy pressure components of LP of a speedy fluid jet in the G tube lumen.
Result
In Poiseuille’s tube with a uniform diameter fluid exerts a positive SP gradient on its wall, causing fluid to leak out through holes all along its wall. In an orifice tube, however, fluid exerts a negative SP gradient, causing fluid to be drawn in by suction from the outside which is maximal over the proximal part near the inlet or ‘arterial’ end (Figure 1). SP turns positive at the distal part near the exit (Figure 2). Using the G tube partially immersed in water, fluid flows out from side holes near the outlet or the ‘venous’ end while it flows in by suction through holes near the inlet or ‘arterial’ end, re-entering back into the lumen of the G tube. Fluid around the G tube moves in an opposite direction to flow inside its lumen in a magnetic field-like pattern (Figures 2 and 3).
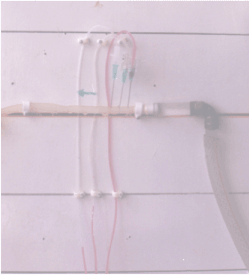
Figure 1. Perpendicular needles inserted into a rubber orifice tube at 10, 20 and 30mm distance from the orifice, with bevels facing downstream, demonstrate the negative energy SP gradient along the proximal part of the tube by the sucked columns of fluids in manometer tubes from a jar 300 mm below the tube
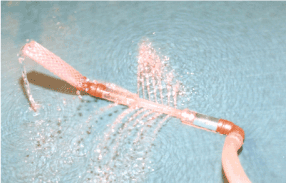
Figure 2. Fluid flows out autonomously through distally situated side holes of a porous orifice (G) tube where SP is positive. Air suction occurs through side holes of the proximal part, as shown in Figure 1, but is not seen here. The fluid around the G tube has magnetic field shape shown above the G tube
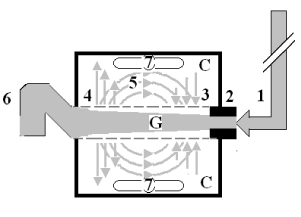
Figure 3. shows diagram of the porous orifice (G) tube enclosed in chamber (C) based on several photographs demonstrating the magnetic field-like G-C circulation phenomenon. The proximal inflow (arterial) pressure (1) pushes fluid through the orifice (2) creating fluid jet in the lumen of the G tube. The fluid jet creates negative side pressure gradient causing suction maximal over the proximal half of the G tube near the inlet (3) that sucks fluid into lumen. The side pressure gradient turns positive pushing fluid out of lumen over the distal half maximally near the outlet (4). Thus the fluid around G tube inside C moves in magnetic field-like fluid circulation (5) taking an opposite direction to lumen flow of G. tube. The inflow (arterial) pressure (1) and orifice (2) induce the negative side pressure energy creating the dynamic G-C circulation phenomenon that is rapid, autonomous and efficient in moving fluid out from the G tube lumen at (4), irrigating C at (5), then sucking it back again at (3), maintaining net negative energy pressure (7) inside C. The distal outflow (venous) pressure (6) enhances outflow at (4) and its elevation may turn the negative energy pressure (7) inside C into positive, increasing volume and pressure inside C chamber
The inflow PP and orifice induce a fluid jet. LP of a fluid jet has 2 components: FP is a positive energy LP component responsible for the flow. SP is a negative energy pressure gradient responsible for suction. Both suction and filtration are autonomous effects of a flow in the G tube. In the G–C model, a rapid mixing autonomous circulation occurs between fluid in the lumen of the G tube and chamber C compartments (Figure 3). This G-C circulation phenomenon also induces a net negative energy in chamber (CP), demonstrated in (Figures 4 and 5). A pressure gradient also occurs inside chamber C, causing fluid to move in an opposite direction to the main flow in the G tube lumen.
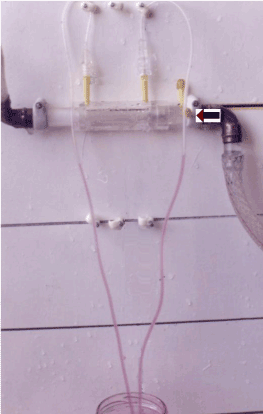
Figure 4. The net negative pressure of a closed chamber (CP) surrounding the G tube, is demonstrated by the sucked fluid in two vertical manometer tubes from a jar 300 mm below

Figure 5. The negative CP (Figure 4) collapses a membrane around the G tube
The inflow PP, orifice/tube ratio and the outflow DP interact to regulate pressure gradient of the G tube, the speed of the G-C circulation and fluid volume and CP in chamber C. Increasing PP augments the negative SP and CP, increases the speed and efficiency of the G–C circulation, and vice versa. Increasing DP augments filtration, counteracted suction, slowed down the G–C circulation and increased fluid volume and CP in chamber C.
The dynamic autonomous magnetic field-like G–C circulation phenomenon, its pressure gradient and relation to PP, orifice and DP are demonstrated in a circulatory system model (Figures 6,7 and 8). The G–C circulation is so fast in mixing fluid inside the G tube and chamber C that it cleared any injected ink into chamber C as soon as the injection ceased (Figure 8). Fluid and particles move freely between the G tube lumen and chamber C, limited only by pore diameter and flow kinetics. Reproducible results were obtained in hundreds of experiments done under steady PP head and using a circulatory system model. The physiological and clinical relevance of results are discussed with reference to its physiological equivalents outlined in the reviewed literature as well as known pathological conditions and mentioned clinical observations.
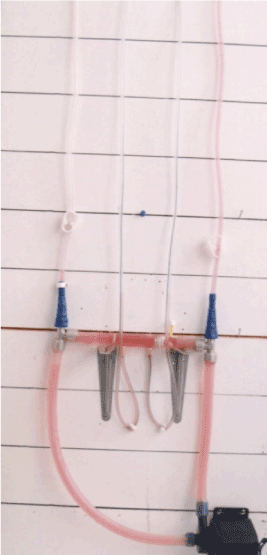
Figure 6. The G–C apparatus incorporated in a circulatory system model driven by a pump (bottom) in which fluid circulates anti clockwise. Horizontal lines are 100 mm apart and the 4 top vertical tubes are manometers for reading PP, CP1, CP2 and DP, respectively
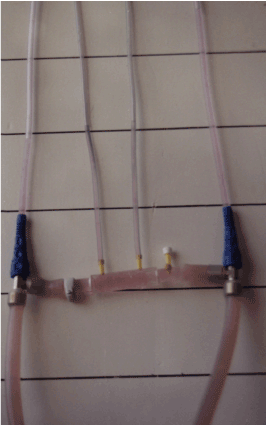
Figure 7. The same system as in Figure 6 with more water in the system. Volume expansion or elevating DP increased chamber volume and pressure (CP turned positive)
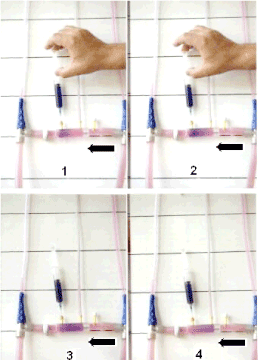
Figure 8. The same system as in Figures 6 and 7 after Injecting ink into the surrounding chamber near the exit of the G tube which moves in an opposite direction to the G tube flow and gets absorbed near the inlet. Note that the ink clears up by absorption very fast after ceasing the injection
The effect of orifice diameter on SP and CP are shown in (Figure 9), it is bell shape being maximum at orifice of 0.7 of tube diameter, which is 0.5 the surface area. The relation of DP to SP and CP is shown in (Figure 10), increasing DP causes elevation of SP and CP towards positive. Figure 11 shows the relation of PP to SP and CP. A high PP enhances suction negativity of SP and CP and augments the G-C circulation.
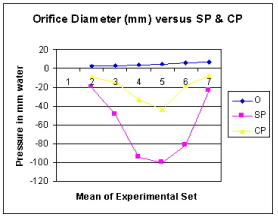
Figure 9. shows the relation of orifice diameter (O) to side pressure (SP) of the G tube and chamber pressure (CP). It is an inverted bell shape. The negative SP being maximum at orifice/tube diameter of 0.7 or surface area of 0.5
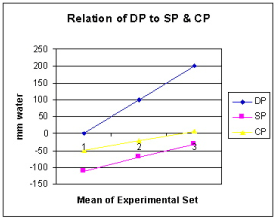
Figure 10. shows the relation of DP to SP and CP. Increasing DP reverted SP and CP towards positive value
Figure 11. Shows the relation of proximal pressure (PP) to side pressure (SP) and chamber pressure (CP). A high PP enhances suction negativity of SP and CP
Discussion
Results demonstrate that the hydrodynamics of the G tube are different from that of Hagen (1839)–Poiseuille’s tube (1840), which in turn challenge the role attributed to arterial pressure as the filtration force in the capillary circulation as proposed by Starling [1]. Inflow PP induces a fluid jet with LP inside both the G tube and Poiseuille’s tubes, which has the dynamic FP and SP components. Over the proximal part, the net effect of the negative energy SP gradient is suction (Figure 1) but in Poiseuille’s tube it is filtration. Both FP and SP components of a fluid jet are extensions of the well-known Bernoulli (1738) and Venturi effects.
The major difference between Poiseuille’s and the G tubes, is that the first induces an all positive energy pressure gradient which can only cause filtration along the entire length of a tube – hence it requires another force for absorption. The G tube has both its positive and negative energy pressure components which autonomously induce both filtration (Figure 2) and absorption (Figure 1), inducing the G–C circulation phenomenon (Figure 3) and the net negative CP in a surrounding fluid chamber C (Figures 4 and 5). Physiological relevance and clinical significance of the G–C phenomenon are discussed here. Preliminary report was previously published [16].
Relevance of physical data to physiological evidence
Results of studies on the G tubes would make sense when linked to its physiological and haemodynamic equivalents. PP akin to ‘arterial’ pressure induces a flow jet with its LP components. The negative energy SP component occurs maximally over the proximal part of the G tube (Figure 1) and is mainly responsible for suction akin to ‘capillary absorption’. Filtration occurs autonomously over the distal part of the tube (Figure 2). Both effects induce the G–C circulation phenomenon (Figure 3). SP also induces a net negative energy pressure in chamber C (Figure 4), demonstrated by the caving in of a membrane cover (Figure 5). A net negative CP is akin to the negative pressure of ISF and subcutaneous spaces [6,7]. Although fluid comes out autonomously through the distal holes of the G tube, it is greatly augmented by increasing the outflow DP akin to elevating venous pressure, augmenting ‘filtration’ and causing ISF shift or oedema.
The G-C circulation phenomenon causes rapid mixing of fluids in the lumen of the G tube and a surrounding fluid chamber compartment C (Figure 3). Its efficiency in exchanging materials between the G tube and chamber C, akin to ‘capillary and ISF compartments’ is remarkable. A few small G tubes contained in chamber C have commutative effect. The shape of the pores, either holes or slit, makes no difference. Large particles trapped in chamber C require regular cleaning. The negative energy of the G–C circulation is a considerable force, similar to that lifting a giant airplane in the air. This negative energy force effectively irrigates chamber C, allowing rapid transfer of fluid and particles into and from chamber C, akin to the passage of fluids with ‘oxygen and nutrients including protein molecules into the ISF space and washing out waste products while preventing excess ISF accumulation’. Guyton and Coleman’s capsule provided excellent evidence on the negative energy pressure of the ISF induced by the dynamic capillary flow, as demonstrated by the net negative CP in the G–C apparatus (Figures 3, 4 and 5).
Forces initiating and regulating the G–C circulation
The G–C circulation and negative CP are initiated and regulated by PP, orifice and DP. Changes which slow down the G–C circulation by decreasing the negative energy pressures of SP and CP are akin to that inducing shock and ISF shift. Changes which enhance the speed, augments its efficiency in fluid exchange akin to meeting increased physiological demands. Increasing PP causes greater suction effect and rapid G–C circulation by augmenting the negative energy of SP and CP (Figure 11). This is akin to arterial pressure keeping ISF space with its negative pressure almost ‘dry’ while effectively irrigated, ventilated and nourished under basic physiological conditions and autonomic stimulation during exercise. Decreasing PP, akin to arterial hypotension, decreases the jet speed, diminishes its negative SP and slows down the G–C circulation. Fluid stagnation and increased CP in chamber C occurs ‘CP moves towards 0 or become positive’. This is akin to inducing both shock and shift of circulatory fluid into the ISF space.
The role of the orifice or ‘pre-capillary sphincter, in collaboration with PP or arterial pressure’, is fine tuning the G–C, akin to capillary–ISF circulation, respectively. The orifice is not only responsible for most of the peripheral resistance maintaining PP akin to arterial pressure but is also the dynamo regulating the G–C circulation akin to the capillary– ISF circulation. Maximum negative SP energy with a most speedy and efficient G–C circulation is demonstrated when the orifice/tube diameter ratio is 0.7, the equivalent to orifice/tube area ratio of 0.5 (Figure 9). The relation of the orifice diameter to the negative SP and CP is bell shape (Figure 9). Adequate G–C circulation is preserved at high efficiency at a wide variation of PP through minor adjusting changes of the orifice or ‘pre-capillary sphincter’ diameter. Thus, adrenergic stimulation [14], which narrows the pre-capillary sphincter and elevates arterial pressure, increasing ISF fluid absorption [14] may be simulated by changing orifice diameter in the G–C circulation. Extreme changes of the orifice, too wide or too narrow, alter the G–C circulation. Removing the orifice makes the tube a Poiseuille’s tube with positive pressure gradient. Too narrow orifice prevents flow and slows down the G–C circulation akin to tissue ischaemia.
The autonomic tuning of pre-capillary sphincters is better known for effects on arterial pressure, but it is also important in regulating capillary–ISF circulation and tissues’ viability. Its dilatation causes hypotensive syncope or anaphylactic shock while severe constriction causes hypertension with tissue ischaemia. This indeed suggests that the pre-capillary sphincter is the master of both systemic and capillary circulations.
DP is always higher than CP and both are proportionally and closely related (Figure 10). When DP is 0, CP is sub-atmospheric. Elevating DP or ‘venous’ pressure increases CP and volume of fluids in chamber C, akin to drowning the ‘ISF’ space and inducing oedema. Such evidence is consistent with the known fact that high ‘venous’ pressure is primarily responsible for filtration, increased fluid shift into the ISF space and dropsy formation.
Relevance of hydrodynamics of the G–C circulatory model to haemodynamic
Analysis of the forces which initiate and regulate the G–C circulation with reference to its haemodynamic equivalents is best demonstrated by comparing the dynamics of PP, DP and CP of the G–C apparatus incorporated in a circulatory model (Figures 6 and 7). Before starting the pump an adequate volume of fluid induces a hydrostatic equilibrium in all manometer tubes. Running the pump (Figure 6) induces the dynamic pressure values in the manometers. In Figure 6, PP = 650 and DP = 50 while CP had negative values of –12 and –10 mm waters at points 1 and 2 in chamber C. Fluid in chamber C flows from point 2 to point 1, in an opposite direction to flow in the G–C circulatory system model, shown by injecting ink into chamber C (Figure 8).
Figure 7 demonstrates the effect of adding more fluid to the system mimicking VO or vascular expansion and increasing venous pressure. This means that increasing DP elevates CP and increases fluid volume in chamber C by a proportional amount of hydrostatic pressure. A pressure gradient remains between DP, CP2 and CP1, allowing fluid movement down it in an opposite direction to flow in the G tube (Figure 8).
Massive VO of the system model (Figure 7) increased DP. This increased fluid volume and CP in chamber C, which decreased the negative energy SP and slowed down significantly the G–C circulation. Most interestingly, such VO also reduced PP. The injected ink into chamber C moves very slowly in the opposite direction to fluid flow in the G–C circulatory system. Volumetric expansion until DP, CP and PP attain hydrostatic equilibrium, ceases the G–C circulation even while the pump is operating. This may mimic a pathological haemodynamic circulatory condition (vide infra).
In the G–C circulatory model, also decreasing PP eventually abolished the dynamic pressure forces and restores fluid hydrostatic equilibrium in manometers. This elevates DP, CP and fluid volume in chamber C which slows down the G–C circulation. This is akin to shock, inducing ISF shift and causing tissue hypoxia. It may be of practical significance in differentiating types of shock and deciding on its optimum fluid therapy.
Pitfalls of starling’s hypothesis
Dr Starling proposed his hypothesis 80 years prior to the discovery of the pre-capillary sphincter [3]. The hypothesis has failed to explain the capillary–ISF transfer in most parts of the body [8]. For the oncotic pressure to work, an impermeable membrane to plasma proteins must exist but it does not. For the capillary to work on the basis of a positive pressure gradient of Hagen–Poiseuille’s tube, which causes filtration all along the tube, another force must exist for re-absorption, and there is none. It neither explains Guyton and Colman’s discovery of the negative ISF pressure [6] nor how venous obstruction or pressure elevation causes oedema while arterial hypertension never does. The measured LP of the capillary tube by Landis (12) is akin to measuring FP in the G tube. At that time, there was no distinction between the components of a dynamic flow, as presented here. LP of the capillary was thought responsible for filtration and its elevation was thought possible by elevating venous or arterial pressures alike, as demonstrated by the isogravimetric experiments done by Pappenheimer and Soto-Rivera [13].
Clinical observations and evidence, though affirm that elevating venous pressure does increase filtration and cause oedema, elevating arterial pressure does not have such effect but on the contrary, it increases absorption [14]. Not only that, an increase in venous pressure has an opposite effect to arterial pressure on capillary filtration but also its augmentation of filtration far exceeds the effect of an equal increase in arterial pressure on re-absorption.
More importantly, is that the hypothesis represents the basis on which clinical decisions for fluid therapy are made, both in the cardiovascular (CVS) resuscitation of shock, burns and in the management of the acutely ill, trauma and surgical patients. Dynamic monitoring of central venous pressure (CVP) and arterial pressure, with reference to capillary circulation, dictate the rules. Fluid therapy has undoubtedly proved its value in saving millions of civilian and military lives suffering from haemorrhagic and hypovolaemic shocks, in which cases the rules do work well. Such rules, however, fail miserably when vascular expansion is indiscriminately used to elevate CVP and PCWP to high un-physiological levels of 15 to 22 cm water, respectively.
Received thinking that elevating CVP is synonymous with elevating arterial pressure is prevailing in current clinical practice during fluid therapy for shock and the management of the acutely ill patients [17]. This is undoubtedly correct during restoration therapy for hypovolaemic and haemorrhagic shock, but, vascular expansion or VO is a different issue.
Persistent attempts to elevate CVP and PCWP up to levels of 15 to 22 cm water are common received practice. The normal CVP, however, is around 0 and most textbooks report a range of –7 to +7 cm water [18]. The pointed out clinical observations demonstrate that, in addition to the well-known effect of high venous pressure causing oedema, arterial hypertension has no such effect, if not the exact opposite. In clinical practice, although arterial hypertension is common, ISF oedema is unknown among its complications. In the G–C model, a minor increase in DP increases fluid volume in chamber C, reverts its CP from negative to positive while slowing the G–C circulation (Figures 6,7,10). Increasing DP has similar effects to decreasing PP on the G–C circulation and chamber pressure and volume. Vascular expansion causes VO shocks [19-21].
The pathological effects of vascular VO have been overlooked for various reasons. Perhaps, because the above reported sophisticated components of a dynamic flow were unknown. Hypotension is always thought synonymous with hypovolaemia. Yet, vascular expansion may not elevate arterial pressure [17] and at times, it aggravates hypotension [18-20].
The maximal capacitance of an adult’s CVS is about 7 litres [18] and any excess VO overflows into the ISF space, causing flooding and drowning. Thus, both hypovolaemia and hypervolaemia of >2 litres have pathological haemodynamic effects. Understanding the correct mechanism of the capillary–ISF transfer in relation to CVS volume, capacitance and dynamic pressures in regulating a physiological capillary–ISF circulation is clinically important. It is relevant to the management of ISF shift, oedema, shock and the MVOD/F syndrome [18-20].
The G–C phenomenon as a concept for capillary–ISF circulation
Well documented physiological studies though have contributed to the evolution of Starling’s hypothesis, which has itself provided evidence for reconsideration but a mechanism for an alternative hypothesis was previously lacking. The autonomous magnetic field-like G–C circulation is the concept proposed as a mechanism for a new capillary–ISF circulation.
One appreciates the considerable differences between physical experiments and the biological situation in vivo.
The speed and autonomy of the G–C circulation, under similar ranges of dynamic pressures of a human circulatory system, can truly explain the efficiency of capillary– ISF circulation in transporting oxygen and nutrients into cells while removing carbon dioxide and metabolites from tissue space. It should work in every part and organ of the body under both physiological and pathological conditions.
The results of hydrodynamic studies on the G tube, chamber C and G–C circulation are in perfect agreement with the summarized physiological evidence on the capillary ultrastructure, interstitial fluid and the capillary–ISF circulation. It also explains the changes responsible for the pathogenesis of oedema and shock which are the main capillary dysfunctions from a clinical point of view. The lymphatic system cleans the ISF space from coarse particles and fat globules. Apart from suggesting that fluid flows in at the arterial end and out at the venous end, through the wide slit pores of the capillary wall, the reported results also suggest that both the absorption and filtration are autonomous features of the G tube. Venous pressure rather than arterial pressure, affects filtration while re-absorption is the primary effect of arterial pressure and orifice or ‘pre-capillary sphincter’. This explains the observation that arterial hypertension, though common, never causes oedema while an increase in venous pressure does. It is in agreement with the results of physiological studies. More importantly, it may resolve the puzzle of the MVOD/F syndrome.
2021 Copyright OAT. All rights reserv
Clinical relevance of the G–C circulation concept
The high incidence of the MVOD/F syndrome affecting postsurgical and trauma patients with its high morbidity and mortality [16] is a subject of increasing international attention and anxiety. Although, the role of microcirculation in its patho-physiology is recognized [17], its aetiology has remained elusive and the possible role of haemodynamic pressures and VO in its pathogenesis has been overlooked but is now reported [19-21]. VO shocks in which vascular expansion, aimed at correcting arterial hypotension by elevating CVP and PCWP to levels up to 15 to 22 cm water, may culminate into the MVOD/F syndrome [11,19]. Massive fluid shift drowns the ISF and/or intercellular spaces, depending on fluid type. The transurethral resection of the prostate (TURP) syndrome is induced by massive sodium-free fluid (VO1), induced mostly by irrigant absorption during endoscopic surgery. The diluted serum solutes are good serum markers, characterized by the dilutional hyponatraemic encephalopathic coma among features of the MVOD/F syndrome.
The main haemodynamic disturbance of VO1 is hypotensive shock with interstitial fluid shift initially and intracellular fluid shift later [11,19]. Despite the massive VO, the patient suffers from severe irreversible hypotension shock and appears hypovolaemic. Ironically and misleadingly, this shock induced by massive VO1 calls for further vascular expansion! Electrolyte-based fluids (VO2) are commonly used to combat this shock. It transfers VO1 into VO2, erases serum markers and causes internal drowning while establishing the MVOD/F syndrome [10,19-21]. Such situation may also complicate the management of any type of the recognized shocks using any type of VO2 fluids.
An identical situation can be reproduced using the G–C circulatory model system. A combination of low PP and high DP causes the G–C circulation to become extremely slow or ceases (Figure 7). It is relevant to appreciate that factors which slow down the G–C circulation are similar to those causing shock and tissue hypoxia in clinical practice. A drop in PP, extreme changes of orifice size and an increase in DP slow down the G–C circulation and increase fluid volume and CP, akin to ‘shock’ and ‘ISF shift’ of the MVOD/F syndrome. Although an adequate circulatory volume and pressure is essential for a physiological capillary–ISF fluid circulation, VO just like hypovolaemia, causes serious haemodynamic disturbance. A persistent attempt to elevate CVP to non-physiological level of 15–22 cm water causes VO shock and drowning of the ISF and/or intercellular spaces. VO may paradoxically make a shock irreversible. Depending on the type of fluid inducing VO, a drop-in serum solute concentration such as sodium and/or albumin may occur.
Further physical and physiological studies in which fluid flow in porous orifice tubes is integrated with capillary membranes, under physiological and pathological conditions are required. It is feasible to identify the exact aetiology of the MVOD/F syndrome, reduce its incidence among postsurgical and shock patients, find a current successful therapy [19-21] or devise future effective drugs.
Conclusion
Hydrodynamic studies on a porous orifice (G) tube, based on capillary ultra-structure, demonstrate results which differ from Poiseuille’s in a strait tube and hence challenge the role attributed to arterial pressure as a filtration force in Starling’s law. A perspective literature review shows that the oncotic pressure force has been previously cancelled and the law has failed to explain the capillary–ISF transfer in most parts of the body.
A concept based on a new hydrodynamic phenomenon is proposed for the capillary–ISF circulation. It explains this vital circulation in every organ and tissue under both physiological and pathological conditions. A rapid autonomous dynamic magnetic field-like G–C circulation occurs between fluid in the G tube’s lumen and a surrounding fluid compartment C. Based on results of studies on a circulatory model incorporating the G–C apparatus, factors which initiate, regulate and affect the G–C circulation, its physiological and haemodynamic relevance and its clinical importance to the pathogenesis of oedema, shock and the MVOD/F syndrome are outlined. The presented evidence does not only prove that Starling’s law is wrong, but also provide the correct replacement; the hydrodynamic of the G tube explaining the capillary-ISF circulation.
Acknowledgement
I thank Professors GD Chisholm, Eric Neil, Dr Antony Winward, Mr BJ Stoodley and Mr PL Brooks for helpful comments and encouragement, Mr Peter Holder, Designer Engineer, Eastbourne, for making the G–C model and board used for quantitative measurements and Mr and Mrs Freda and Robert Prentice for permitting the generous use of their premises at 70, Glendale Avenue, Eastbourne, BN21 UN, during the G tube studies.
Conflict of interest
None declared.
References
- Starling EH (1886) Factors involved in the causation of dropsy. Lancet ii: 1266-1270, 1330-1334 and 1406-1410.
- Folkow B, Neil E (1971) Circulation. Oxford University Press: London 1-125.
- Rhodin JA (1967) The ultra-structure of mammalian arterioles and precapillary sphincters. J Ultrastructure Research 18: 181-222.
- Karnovesky MJ (1967) The ultra-structural basis of capillary permeability studied with peroxidase as a tracer. J Cell Biol 35: 213-236. [Crossref]
- Hendry EB (1962) The osmotic pressure and chemical composition of human body fluids. Clin Chem 8: 246-265. [Crossref]
- Guyton AC, Coleman TG (1968) Regulation on interstitial fluid volume and pressure.Ann N Y Acad Sci150: 537-547. [Crossref]
- Calnan JS, Pflug JJ, Chisholm GD, Taylor LM (1972) Pathophysiology of tissue fluid.Proc R Soc Med65: 715-719. [Crossref]
- Keele CA, Neil E, Joels N (1982) Sampson Wright Applied Physiology. 13th Ed. Oxford University Press; Oxford.
- Renkin EM (1986) Some consequences of capillary permeability to macromolecules: Starling’s hypothesis reconsidered. Am J Physiol 250: H706–H710. [Crossref]
- Ghanem AN (1988) The Transurethral Prostatectomy (TURP) Syndrome: An Investigation of the Osmotic and Metabolic Sequelae of Volumetric Overload. MD Thesis. Institute of Urology and Nephrology, Mansoura University, Mansoura, Egypt.
- Ghanem AN, Ward JP (1990) Osmotic and metabolic sequelae of volumetric overload in relation to the TUR syndrome.Br J Urol66: 71-78. [Crossref]
- Landis EM (1929) Micro-injection studies of capillary blood pressure in human skin. Heart 31: 209-228.
- Pappenheimer JR, Soto-Rivera (1948) Effective osmotic pressure of plasma proteins and other quantities associated with capillary circulation in the hind limbs of cats and dogs. Am J Physiol 152: 471-491. [Crossref]
- Mellander S (1960) Comparative studies on the adrenergic neurohormonal control of resistance and capacitance blood vessels in the cat. Acta Physiol Scand Suppl 176: 1-86. [Crossref]
- Mattfeldt T, Mall G (1984) Estimation of length and surface of anisotropic capillaries.J Microsc135: 181-190. [Crossref]
- Ghanem AN (2001) Magnetic field-like fluid circulation of a porous orifice tube and its relevance to the capillary-interstitial fluid circulation: preliminary report. Med Hypotheses 56: 325-334. [Crossref]
- Webster NR (1999) Monitoring the critically ill patient.J R Coll Surg Edinb44: 386-393. [Crossref]
- Guyton AC (1986) Textbook of Medical Physiology. An HBJ International Seventh Edn. WB Saunders Company. Philadelphia London 19: 221.
- Ghanem SA, Ghanem KA, Ghanem AN (2017) Volumetric Overload Shocks in the Patho-Etiology of the Transurethral Resection of the Prostate (TURP) Syndrome and Acute Dilution Hyponatraemia: The Clinical Evidence Based on Prospective Clinical Study of 100 Consecutive TURP Patients. Surg Med Open Access J 1: 1-7.
- Ghanem AN, Ghanem SA (2016) Volumetric Overload Shocks: Why Is Starling’s Law for Capillary Interstitial Fluid Transfer Wrong? The Hydrodynamics of a Porous Orifice Tube as Alternative. Surg Sci 7: 245-249.
- Ghanem KA and Ghanem AN (2017) Volumetric overload shocks in the patho-etiology of the transurethral resection prostatectomy syndrome and acute dilution hyponatraemia: The clinical evidence based on 23 case series. Basic Res J Med Clin Sci 6: 35-43.