Craniosynostosis occurs when one or more skull sutures fuse prematurely, resulting in an abnormal skull shape. Surgery is usually performed not only for cosmetic reasons, but also to avoid a rise in intracranial pressure. Currently, surgeons use their clinical expertise and experience to decide how they will reshape the skull when doing a total or partial vault remodeling. However, after surgery, the skull will continue to grow, and therefore the shape of it will change. There are currently no tools to visualize the results of the planned surgery. The aim of the present study was to develop an algorithm to simulate skull development for the first few months after birth, leading to a platform for planning craniosynostosis modelling. We have extended our previous pressure-based model to a force-based model, to stabilize the skull growth simulation algorithm. The results of our normal skull simulation are shown to be in line with clinical datasets, and the results of abnormal skull growth simulations were much better than previous models.
computer simulation, craniosynostosis, modelling, predictable model
Skull development begins from outside the membrane enclosing the brain, and proceeds via separate sites of ossification [1], which then spread and approach each other until the spaces between them close to form sutures [2]. The sutures then become sites of skull growth, remaining patent while the ossification occurs at the skull fronts. This growth is triggered locally by growth signals, with the stimulus believed to be pressure exerted by the enlarging brain on the inner surface of the calvarium, thereby stretching the sutures and stimulating them to develop more bone to accommodate brain growth.
Sometimes one or more sutures close prematurely, leading to craniosynostosis - characterized by deformed head shape and excess intracranial pressure [3]. Most cases require surgery to correct the deformity, and to provide adequate room for brain growth. Our objective was to model normal and abnormal skull growths to simulate skull development over the few months after birth.
Previously, we developed a simpler pressure-based model to simulate both normal and abnormal head development [4]. The results of normal head development, scaphocephaly, and trigonocephaly were acceptable models, but the result for anterior plagiocephaly did not match well the clinical datasets. In addition, the brute-force triangle-based collision detection needed to model the concave shapes between the brain and skull model required a huge number of calculations during the simulation, leading to at least one week for a complete animation run. Furthermore, the system was sometimes numerically unstable. As a result, we developed a “craniogenesis” based model to address these shortcomings.
Our normal head model was developed based on CT scans from a normal three-week-old infant, who has been imaged for clinical reason. The skull structures were automatically segmented with Amira, a software that allows visualization and manipulation of three-dimensional (3D) images (Figure 1). 9 skull plates were manually segmented according to the skull anatomy (Figure 2). Even if the infant skull is not completely stiff over long time frames (ie. it bends over time scales of months and longer), we considered the bone as a rigid body over short time frames (ie. It is a rigid body over time scales of weeks and shorter), and we generated the model with surface mesh. The sutures were considered as soft tissue, and we therefore manually filled the gaps between the skull plates with hexahedral mesh structures (Figure 3). The skull base sutures as well as sutures in the face are different and have a much lower growth rate (while the human calverium changes rapidly over the first 2 years, the face changes later around age 7 years). Therefore, we further separated the sutures into three parts (Figure 4). We set the sutures that are attached to cartilaginous bones (face and skull base) with higher values of Young’s modulus, and for simplicity, did not apply skull growth on it. Details for material properties setup and dynamic model development were the same as in previous work [5]. In this section, we only focused on the difference from pressure-based model.
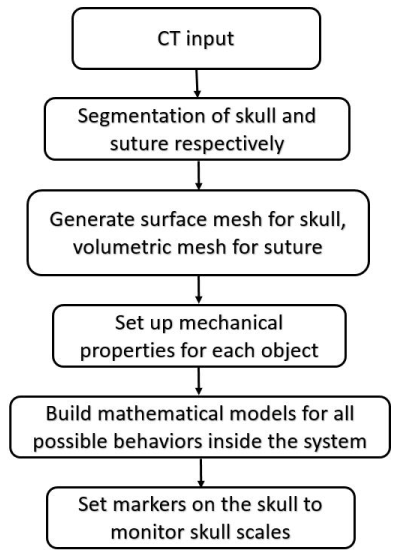
Figure 1. The flow chart of our simulation modelling.
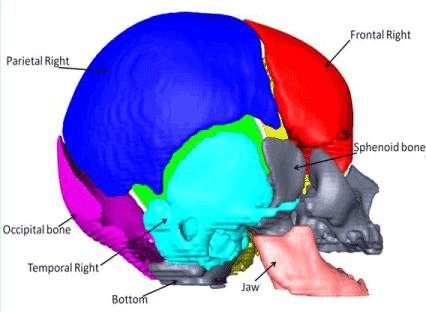
Figure 2. The different bones making up the skull model.
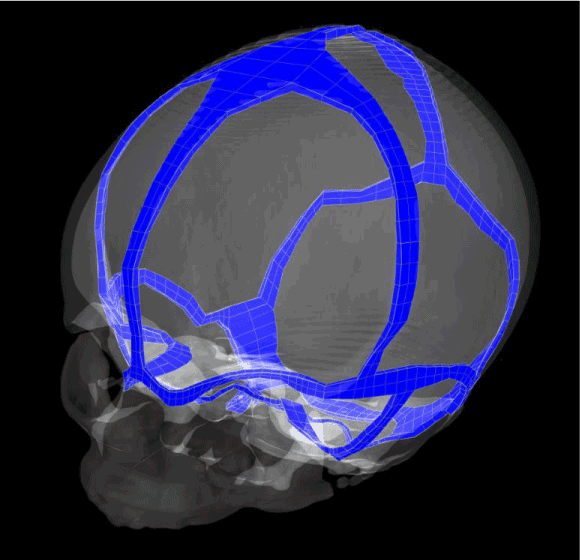
Figure 3. The different sutures between the skull plates.
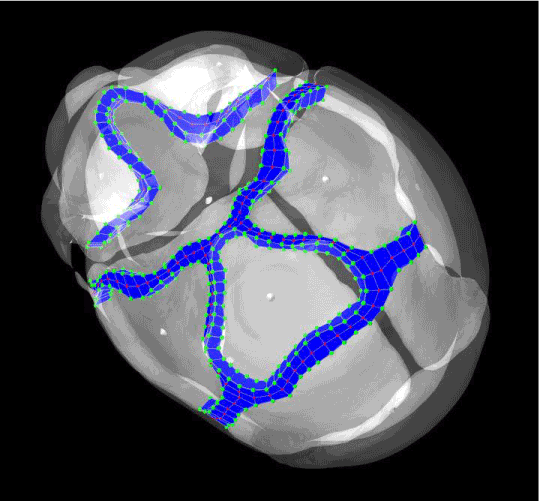
Figure 4. The sutures at the cranial base and across the face, which were segmented out from our original model.
Since using a brain model caused collision detections to the skull, we model forces that push the skull plates outwards in a force-based model, as a substitute to the brain model. In our model, we exert forces on the interior surface of the skull to push it outward, as done by the growing brain. With a force-based model, it is important to determine the best way to distribute the forces to achieve the same effect as brain expansion.
In the Artisynth simulation framework, we can attach a force point on a surface with a specific direction and scale. We decided to add a force point on each triangular face of the inner skull surface. Each force is decided by:
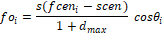
Where  is the force applied on the ith face
  , s is a scale that can be customized,
  is the center of this face,
  is the centroid of our skull,
  is the maximum distance between the skull centroid and an inner face of skull, and
  is the angle between the face normal and the direction along
  (Figure 5).
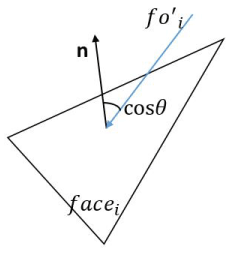
Figure 5. An indication of the relationship between face normal and the force  .
.
Normal head development
The normal head model at both its initial status and during the simulation, from three angles of view is shown in Figure 6. A colour map of tension was applied along the sutures, ranging from blue (no-tension) to red (maximum tension). The two skulls seen in Figure 6A show that the frontal and parietal bones extend in both lateral and longitudinal direction. The two skulls seen in Figure 6C indicate that the vertical growth of the cranial face was only from the stretch of the suture across the face, whereas the skulls at side view show that the posterior end of the skull experienced much more vertical growth at the parietal and occipital bones. Generally, since all of the sutures were open during the simulation of skull growth, the skull tends to become a sphere.
Figure 6. Modeling of normal skull growth: on the left initial time, on the right, at the end of the simulation. There are three different views respectively, A: a view from above, B a lateral view from the side, C an anterior view from the front.
Figure 7 indicates the skull scales and volumes over time during the normal simulation. However, it is important to be able to translate the time elapsed in our simulation (in seconds) into real time. Therefore, using normal growth head circumference charts and our simulated head charts, we can extrapolate what our simulation time in second would translate into weeks and months. To accomplish this, we first consulted the growth charts for head circumference for boys from birth to 36 months, published by the Centers for Disease Control and Prevention ( www.chartsgraphsdiagrams.com directory: HealthCharts/head-circum-birth-36-boys.html), and found that the average growth of infants’ head circumferences during the first year was approximately 36 to 46 months; representing a 27% increase. We assumed the development of circumference is approximately linear to the growth of skull length and width. Clinically the cranial index (skull width: bi-parietal diameter over skull length: longest diameter from frontal bone to occipital bone) is always measured, and therefore we also used that value to compare our simulations to published head growth. Therefore, in our model, we took an increment of 27% of the skull length (Figure 8) to represent the first year of human life, which in our simulation was 6.1 seconds. The corresponding cranial index during this 6.1 seconds developed from 81.5 to 86.8. As a result, the cranial index increased by 6.5% during the first year of life in our normal simulation.
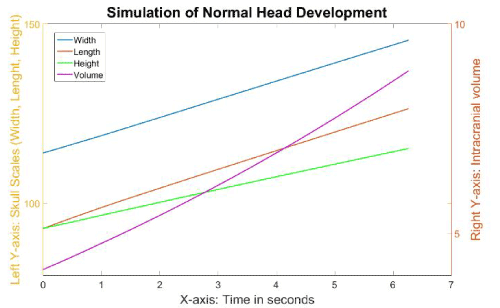
Figure 7. The different growth values of the skull during the simulation of normal head development.
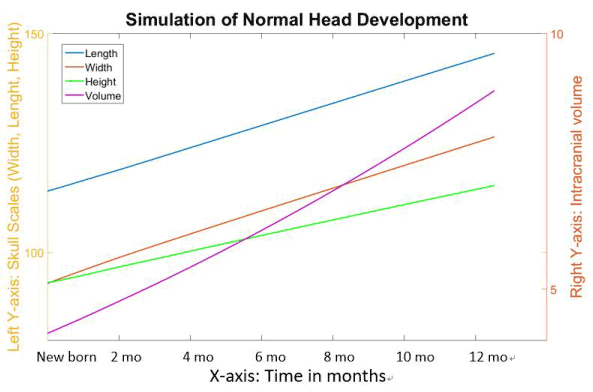
Figure 8. The normal simulation with time explained in real human life.
In Figure 8, the skull length (yellow line) and width (blue line) maintained the same growth ratio during the simulation, while the growth ratio for the skull height (green line) was slightly slower. The skull length rose from 114.1 to 144.2 (26.4%) within the first year, whereas the skull width grew from 93.1 to 125 (34%). The skull height started at the same level as width, but only grew to 114.2 during the first year (22%). The intracranial volume (represented by the purple line) increased from 4.1 to 8.8 (115%).
The blue line in Figure 9 represents a non-linear growth of cranial indices during the simulation. The values of cranial index rose quickly during the first second and then subsequently slowed down. The value raised to 86.7 at 6 seconds when the volume achieved double size from 81.5.
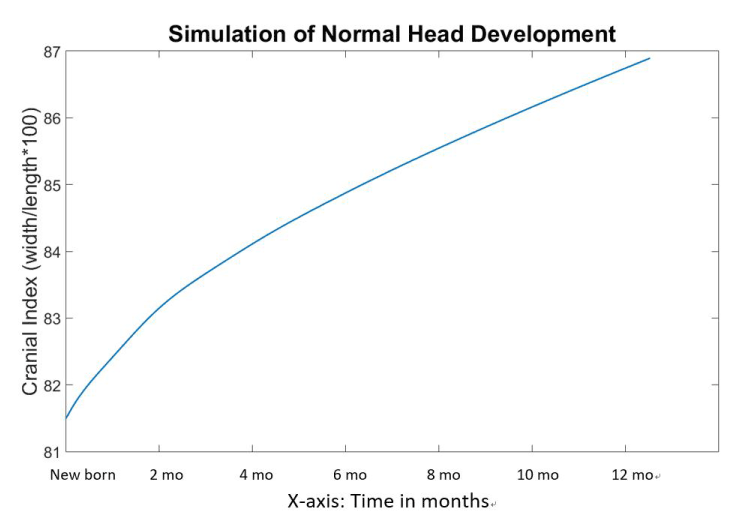
Figure 9. Cranial indices with respect to time during the normal head development simulation.
Scaphocephaly
Scaphocephaly is the “boatlike” shape resembling a skiff or vessel ("σκάφος”) that the skull takes after closure of the sagittal suture. In Figure 10, we display the scaphocephaly model from its initial state to the end of the simulation, in different angles of view. Since the sagittal suture was closed (Figure 10A), the skull could not develop in the lateral direction, thus leading to more development in the longitudinal direction compared to a normal skull. In addition, the cranial base was restricted to develop in the lateral direction (Figure 10B), whereas the frontal bones were limited to grow lateraly by the sagittal suture. As a result, the combined parietal bone was the only plate that was free to develop in both the vertical and lateral directions, thus leading to a protrusion at the posterior end (Figure 10C).
Figure 10. Scaphocephalic model: The skulls in the left column indicates initial status of the scaphocephaly simulation from three different views respectively (A: above, B: lateral and C: front), whereas the skulls in the right column demonstrates the skulls in the middle of the simulation
Since it is difficult to transfer the pathological simulation time to real human life, we only qualitatively analyse the rest of the simulations. Figure 11 is the result of this simulation with skull scales and intracranial volumes along simulation time. The skull width maintained the same during the simulation while the length and height had similar growth ratio. The skull length grew to 124.7 (9.3%) at 6 seconds in the scaphocephaly simulation, compared to 144.2 (26.4%) in the normal simulation, thus exhibiting a lower growth ratio than in the normal simulation. The skull height grew 10% within 6 seconds, which is slightly slower than the growth (22%) in the normal simulation. The volume increased by from 4.1 to 5 (approximately 22%) within the first 6 seconds, whereas the volume increased 125% in the normal simulation.
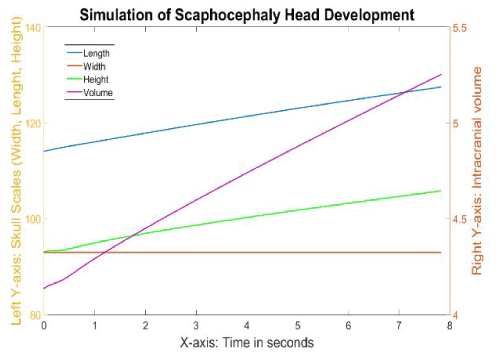
Figure 11. The different growth values of the skull during the simulation of scaphocephaly.
The cranial index (Figure 12) also exhibited a linear relationship with time, gradually decreasing from 81.5 to 72.9; which is compatible with clinical measures – scaphocephaly being described as any cranial index lower than 75. The overall shape over time was evaluated by 2 clinical experts who qualified the skull as a typical scaphocephalic head.
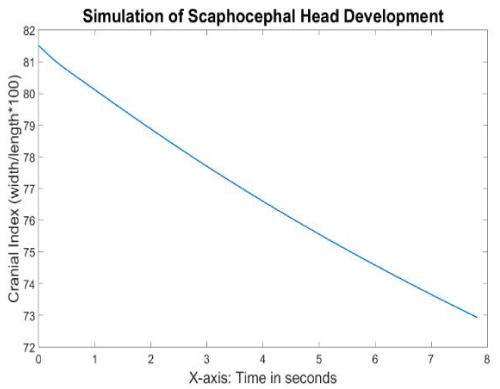
Figure 12. Cranial indices with respect to time during the scaphocephaly head development simulation.
Trigonocephaly
Trigonocephaly is a triangle-like shape that the skulls adopt after closure of the metopic suture (in between the frontal bones). Figure 13 displays the progression of the trigonocephaly model from its initial state to the middle of the simulation, from three angles of view. As seen in Figure 13A, although the skull was inflated in both the lateral and longitudinal direction, lateral growth of the frontal bones was limited, thus leading to a triangular forehead. Except for the frontal bones, all other skull plates developed normally, and appeared normal in shape from the other two angles of view. Although the parietal bones were the only two plates in the skull that were not restricted, they did not protrude as they did in the scaphocephaly simulation.
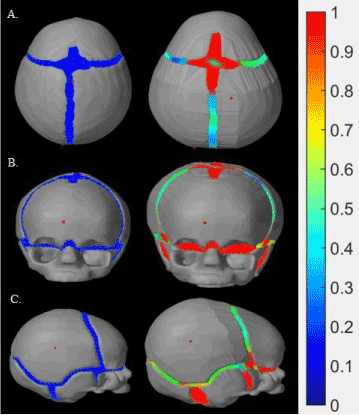
Figure 13. Trigonocephaly model: The skulls in the left column indicates initial status of the trigonocephaly simulation from three different views respectively (A: above, B: lateral and C: front), whereas the skulls in the right column demonstrates the skulls in the middle of the simulation.
The skull scales were plotted against the time span from the trigonocephaly simulation, and this graph is presented in Figure 14. The whole pattern appeared similar to the pattern of normal skull development, where the growth ratio of height was lower than that of width and length. The only difference was that the skull width grew slightly slower in the trigonocephaly simulation compared to the normal simulation, where the values rose to 121 (29%) compared to 125 (34%), respectively.
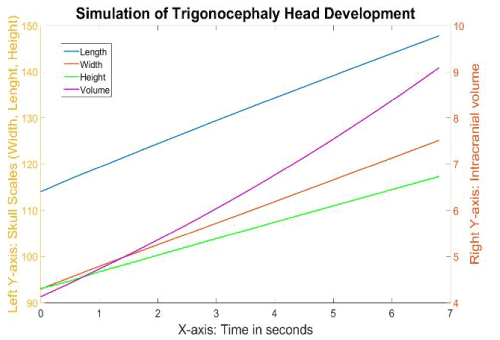
Figure 14. The different growth values of the skull during the simulation of trigonocephaly.
Figure 15 displays the cranial index values with respect to time. Since the growth pattern of the skull scales was similar to the pattern of the normal simulation, the cranial index trend should be similar as well. However, the growth rate of the cranial index was steady in the trigonocephaly simulation, unlike the rate in the normal simulation, which slowed down over time. In addition, the change of cranial index was slower in the trigonocephaly simulation compared to the normal simulation, where the value rose to 84.3 (3.5%) at 6 seconds in the trigonocephaly model, while increasing to 86.7 (6.3%) in the same amount of time in the normal model. Which is simlar as what is seen clinically.
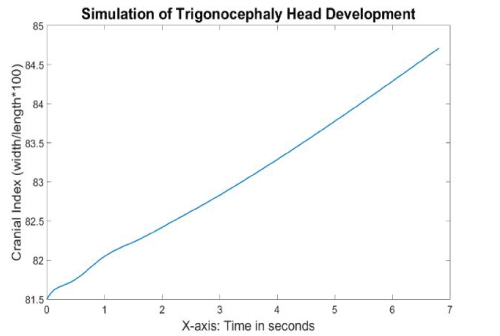
Figure 15. Cranial indices with respect to time during the trigonocephaly head development simulation.
Anterior plagiocephaly
In anterior plagiocephaly, the closed coronal suture can occur on either side of the skull. Such patients would have a protrusion on the unaffected side of the forehead compared to the affected side, which has less orbital ridge on top of the eye, making the eye appear as buldging. Comparing the progression of skull growth from Figure 16 (initial state of the simulation) to Figure 17 (the end of the simulation), normal expansion in the lateral direction can be seen. However, in the longitudinal direction, the right frontal bone exhibited normal growth while the left frontal bone grew excessively in the anterior direction to form an uneven forehead.
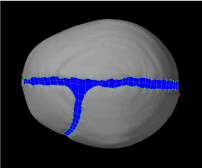
Figure 16. Initial model of a right anterior plagiocephaly by closing the right side of coronal suture.
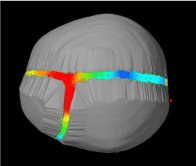
Figure 17. Top view of our right anterior plagiocephaly model in the end of the simulation.
Figure 18 displays the initial plagiocephaly model from a frontal view, and Figure 19 displays the model at the end of simulation. As seen in Figure 18, the yellow dashed is tangential to the ridges of both eye sockets, whereas the line only touched the right ridge of the eye socket in Figure 19. Thus, the unaffected eye socket in Figure 19 was slightly compressed compared to the affected side.
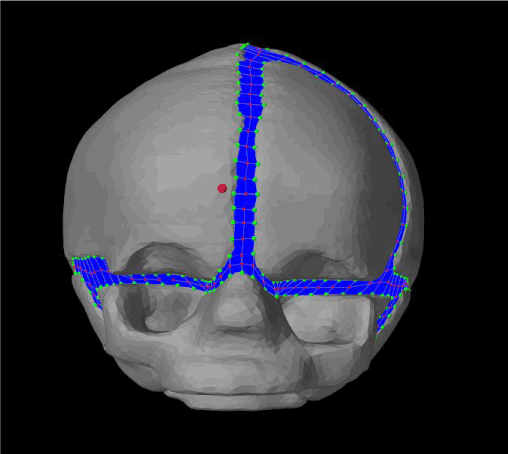
Figure 18. Front view of our initial plagiocephaly model.
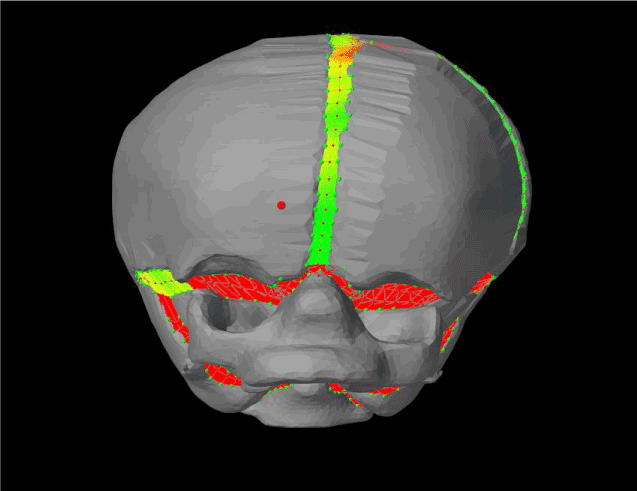
Figure 19. Front view of the result from plagiocephaly simulation.
The skull scales of this simulation are shown in Figure 20, and the cranial index in Figure 21. All the scales of the skull increased linearly during the simulation, with the skull width growing the fastest and the skull length growing the slowest. More specifically, the length in the anterior plagiocephaly model grew 1.4% within 6 seconds, while the width increased by 8.4%, which was faster than the rate of growth of the length, but still slower than that of the width of the normal case (34%). However, the cranial index rose from 81.5 to 87.12 within 6 seconds, which was close to the result of the normal simulation. Clinically that is also compatible with typical anterior plagiocephalic head growth, were the cranial index is unchanged from a normal skull between 76-90%, but asymmetrical, which isn’t reflected in the cranial index. The 2 clinical experts agreed qualitatively on the resulting shape from the simulation as representing an anterior plagiocephaly.
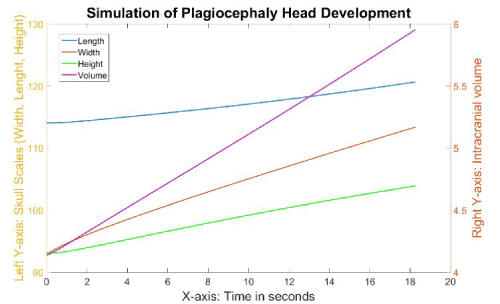
Figure 20. The different growth values of the skull during the simulation of the plagiocephaly model.
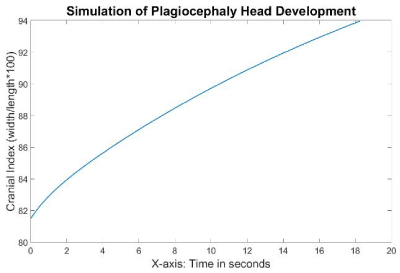
Figure 21. Cranial indices during the simulation of right anterior plagiocephaly.
We have been able to design a stable model of skull growth and compared it with growth values of normal and abnormal skull shapes. A recent 2014 paper by Likus et al. [6], collected cranial indices from healthy babies between 1 month to 12 months of age. The statistics from this study demonstrate a gradual incremental increase of cranial index during the first year of life, growing from 80.2 to 83.15, on average. An earlier study done in 1977 by Dekaban however, had shown a decrease in cranial index over the first year of life [7]. The cranial index might vary depending on the population studies, as geography does affect skull shapes. Since Likus is the most recent study in Caucasian babies, we used it as our reference.
Our simulated cranial index for a normal skull increased by 6.5% during the first year of life, which is slightly faster than the increase of 3.7% described by Likus et al. [6]. The overall shape of our normal skull over time was evaluated by 2 clinical experts who qualitatively described it as normal. The cranial indexes in the craniosynostosis models also all resulted in measures that were expected clinically.
The skull shapes of the normal and craniosynostosis models were all evaluated by clinical experts who agreed on the overall shape overtime and its modifications due to the synostosis. One limitation of our skull model is its rigidity. Since our models were generated using a surface mesh, the shape of our skull plates cannot be deformed under any conditions. Although the bone is a very hard tissue compared to the brain, it does posess the ability to deform during infancy, but does so over months [8,9]. From another point of view, the smoothness of the skull shape is maintained as ellipsoid-like while the intracranial volume was quickly increasing in the first year of human life, which illustrates that the curvatures of the skull plates must be remodeled within this period.
To be completely correct the curvatures of the skull plates would have to be adjusted during the growth of intracranial volume during brain expansion. The dashed yellow line in Figures 22 and 23 can be considered as a demonstration of how the skull shape would be adjusted during growth. From the top view (Figure 22), both parietal bones should be slightly flattered than previous shapes so as to increase the parietal bones in longitudinal direction and shrink back in lateral direction. From the side view (Figure 23), we can see that the occipital bone should instead be tilted downward, and skull would be slightly longer and not as tall. However, that makes the model incredibly complex, and didn’t seem to bring many advantages in term of realism when comparing values.
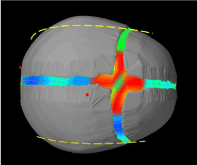
Figure 22. Example of how a model done with deformable skull plates instead of rigid bodies would look like – top view of a normal head - the dashed yellow line would indicate how the bone would have a slightly different curvature, both parietal bones should be slightly flattered than previous shapes so as to increase the parietal bones in longitudinal direction and shrink back in lateral direction.
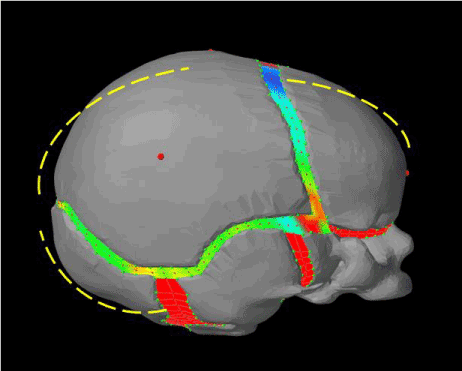
Figure 23. Example of how a model done with deformable skull plates instead of rigid bodies would look like – side view of a normal head - the dashed yellow line would indicate how the bone would have a slightly different curvature, the occipital bone should instead be tilted downward, the parietal and frontal bones would be slightly more curved, resulting in a skull that would be slightly longer and not as tall.
Another limitation of our normal simulation is the closing time of the sutures. As mentioned earlier, different sutures close at different times. For example, the frontal suture normally closes at around 2 months. From the simulation of trigonocephaly, we can see that closure of the frontal suture slows down the growth rate of the cranial index. Of course, the closure time of each suture is unique to each individual, which leads to a multitude of unique skull shapes; since closure time cannot be predicted it is unrealistic to try to include it in the model. We believe however that this does play only a minor role in accounting for differences between our model and published skull growths.
In summary, the major contribution that resulted in a discrepancy between our data and other general clinical data was the use of a rigid skull plate model. Our current modelling platform, Artisynth, would not allow us to model both the skull and the sutures as non-rigid bodies with different properties. We might be able to use SOFA, which enables the specification of various material properties on different parts of a finite element model for future modeling. With this function, we might be able to generate a skull as a whole, and characterize skull and sutures with different properties, at different locations. This might help to further, we expect our simulation will be more in line with reality. In addition, we could also simulate the skull extension by subdividing elements at the edge of the suture, whose size can be enlarged so as to expand the skull plates.
This is the first step in developing a model enabling the craniofacial team to look at growth of the skull once corrected and therefore predict different growth patterns depending on where the surgical cuts are made, and how the vault is remodelled. In this way, the craniofacial surgeons could safely experiment any possible surgeries on a patient and choose the most proper one for this specific patient without any concerns.
In this paper, we developed a force-based model as the simulation algorithm. We chose to simulate both normal and abnormal skull development first, in order to validate our simulation algorithms against the simulation results with clinical data. In clinical practice, cranial index (skull width: bi-parietal diameter over skull length: longest diameter from frontal bone to occipital bone) is normally used to evaluate skull shape, and previous studies [6,7] collected values from different patients between 1-12 months of age, which provided a valuable perspective as to how the cranial index develops during the first year of life. We were able to compare our simulation of normal head development with the data in this paper, in order to evaluate our simulation system. Although there isn’t many values to refer to with respect to abnormal skull development, we were able to characterize the typical skull shapes of each type of craniosynostosis. Both the cranial indexes and the overall shapes were aligned with expected clinical results.
2021 Copyright OAT. All rights reserv
The research was done with Western Univesrsity Research Ethics Board Approval. All the figures are our own.
Jing Jin: Modeling and running of the data, preparation of the manuscript; Roy Eagleson: Supervision of the modeling as well as design of the experiment, review of manuscript; Sandrine de Ribaupierre: General idea for research. Design of the experiment, preparation of manuscript.
Our project is supported by the Engage Grants from Natural Sciences and Engineering Research Council of Canada. Thank you to Marcus Lo for reviewing and formatting the manuscript.
No competing interests to declare.
- Carlson BM (1999) Human Embryology and Developmental Biology, Mosby.
- Opperman LA (2000) Cranial sutures as intramembranous bone growth sites. Dev Dyn 219: 472–485. [Crossref]
- Aviv RI, Rodger E, Hall CM (2002) Craniosynostosis. Clin Radiol 57: 93–102.
- Jin J, Shahbazi S, Lloyd J, Fels S, de Ribaupierre S, Roy E (2014) Hybrid simulation of brain–skull growth. Simulation 90: 3-10
- Jin J, De Ribaupierre S, Eagleson R (2016) Normal Brain-Skull Development with Hybrid Deformable VR Models Simulation. Stud Health Technol Inform 220: 150-153 [Crossref]
- Likus W, Bajor G, Gruszczyńska K, Baron J, Markowski J, et al. (2014) Cephalic Index in the First Three Years of Life: Study of Children with Normal Brain Development Based on Computed Tomography, Cephalic Index in the First Three Years of Life: Study of Children with Normal Brain Development Based on Computed Tomography. ScientificWorldJournal: 502836. [Crossref]
- Dekaban AS (1977) Tables of cranial and orbital measurements, cranial volume, and derived indexes in males and females from 7 days to 20 years of age. Ann Neurol 2: 485–491 [Crossref]
- Baumer TG, Powell BJ, Fenton TW, Haut RC (2009) Age Dependent Mechanical Properties of the Infant Porcine Parietal Bone and a Correlation to the Human. J Biomech Eng 131: 111006 [Crossref]
- Couper ZS, Albermani FG (2005) Biomechanics of shaken baby syndrome: physical testing and numerical modeling. In Developments in Mechanics of Structures and Materials. A A Balkema 213–218