Rectal bleeding and lung pneumonitis are the most common side effect following prostate and lung external radiotherapy treatments.
To assess retrospectively rectum and lung normal tissue complication probability (NTCP) at different dose-volume limits changing the number of fractions, 40 patients, half treated for prostate cancer and half treated for lung disease using a conformal radiotherapy treatment (3DCRT) or an intensity-modulated radiation treatment (IMRT) were included in our study. Rectum and lung complications were analysed changing the number of fractions and adjusting the total dose keeping the dose-volume limits fixed as per original standard dose plan (2 Gy/daily). Three different sets of parameters, two linear-quadratic and one seriality model, were employed to evaluate rectum and lung NTCP using Biosuite software.
An increased in rectum and lung complications was observed at low dose-volume values when the number of fraction was reduced from 38 given at 2 Gy/day to 5 given at 8 Gy/day. NTCP differences were substantially reduced to an average value of 4% when VD>40 Gy for rectum and VD>20 Gy for lung treatments were considered. A lower NTCP coefficient of variation was obtained for V70 and V30 for rectum and lung respectively.
Results indicate that more consideration should be given to the low dose-volume limits when the number of fractions are reduced and the dose per fraction increased in prostate and lung treatment to take under control rectum and lung toxicity for both 3DCRT and IMRT treatments.
normal tissue complication probability, 3DCRTt, IMRT, dose-volume limits, rectum and lung toxicity
Prostate cancer is one of the predominant malignancies in men through the world as well as non-small cell lung cancer (NSCLC) it continues to be the leading cause of cancer-related mortality. Radiotherapy is one of the main interventions applied in patients affected by those malignancies offering a chance of cure associated to a good tumor control and reduction in toxicity. If in the past, external beam irradiation regimes have been used delivering 2 Gy given in 5 days per week over 7.6 weeks for prostate treatments and 2 Gy daily for a total dose of 60-66 Gy over 6 weeks or more for lung, an increasing number of radiotherapy departments have implemented in the recent years hypofractionated regimens for both malignancies sites. The decision to clinically introduce the hypofractionated therapy is strongly supported by the results of all studies carried out in the last few years worldwide [1-7]
While standard radiation dose is given over a period of 7-9 weeks, hypofractionation is defined as dose per fraction in the range of 2.2 Gy up to 4.0 Gy or extreme hypofractionation with a single dose beyond 4.0 Gy allowing treatments over a shorter time span.
However, even though studies have shown hypofractionation can be safe and effective it is still entirely unclear regarding the effect of a large dose per fraction on normal tissues and organs at risk surrounding tumor volume. Uncertain is the benefit of extreme hypofractionation treatments to the risk of proctitis and pneumonitis in prostate [8] and lung treatments respectively. Adverse events seem to be dependent upon both the total radiation dose and the volume of the rectum and lung included in the high dose region.
Due to the high interest in hypofractionated treatments [9], the goal of this study is to investigate the normal tissue complication probability (NTCP) variation when the number of fractions is changed and the dose per fraction is adjusted to maintaining rectum and lung dose-limits constraints (VD) as per original standard (2 Gy/day) dose plan. For a different number of fractions over a pre-selected range (prostate: 38, 20, 10, 5 numbers of fractions; lung: 30, 20, 10, 5 number of fractions) a highest prescription dose not exceeding the VD limits was computed using BioSuite software [10].
Forty patients were analysed retrospectively to investigate the isotoxic dose, in terms of volume dose limits (VD) which are supposed to be correlated with the NTCP rate [11-14], when the number of fractions is changed.
Patients’ CT simulation scans were acquired using a dedicated Siemens Somatom Emotion CT scanner at supine patient position. All CT images were taken in 3 mm thick slice and exported via network to Pinnacle V10 (Philips) treatment planning system. All clinical target volumes (CTVs), planning target volumes (PTVs) and organs at risk (OARs) volumes were contoured by radiation oncologists.
Prostate patients
Twenty patients were treated for localized prostate cancer delivering 76 Gy in 38 fractions as per our institution standard protocol. Of this group, 10 were treated delivering a 3-dimensional conformal radiotherapy treatment (3DCRT) and 10 received an intensity-modulated radiation treatment (IMRT). Both 3DCRT and IMRT treatments were planned using five coplanar beams at gantry angles respectively of 0°, 45°, 95°, 265° and 315°.
The prostate PTV was defined as the CTV plus 7mm margin around except posteriorly were 5 mm margin were given. Contouring was determined using the ICRU guidelines.
Rectum, bladder, femoral heads and bowel were contoured as organs at risks.
Prostate patients’ average age was 72 years (ranged from 58 to 82 years) with a standard deviation of 15.32.
Lung patients
Ten of the remaining twenty patients received IMRT radiotherapy treatment at 2 Gy per fraction for a total dose of 60 Gy for lung (NSCLC) disease as established by Radiation Therapy Oncology Group (RTOG) [15] while the last 10 patients received 3DCRT treatment for a total dose of 55 Gy in 20 fractions given at 2.75 Gy per day. The CTV was defined as the gross tumor target volume (GTV) plus 8 mm margin while the PTV was defined as CTV plus 10 mm margin to account for tumor motion and set up uncertainty. For both groups, equidistant coplanar 6 MV or 10 MV photon beams were used. The number of beams used and their gantry angles were selected according to the target position minimizing the lung and critical structures involvement. PTV volumes at the CT scan acquisition ranged from 90 cc and 430 cc with a median value of 215cc.
Plan parameters
All plans were calculated and optimized to guarantee PTV coverage of 95% of the prescribed dose minimizing in all cases the dose to the normal tissue and organs at risk.
Analysis
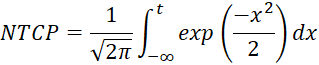
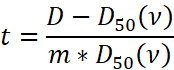
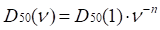
The original rectum and lung 3DCRT and IMRT DVHs calculated at standard dose were imported into BioSuite software to determinate the NTCP variation at different number of fractions. The optimal total dose was adjusted to maintain the dose-volume (VD) constrains as per original plans. In order to compare dose-volume parameters for a range of different number of fractions: V40, V50, V60 and V70 dose-volume constraints, differently correlated with the risk of developing late rectal bleeding toxicity [9,16-18] were analyzed. Similarly, V5, V13, V20, V30 and V40 dose-volume limits were considered as predictors of late radiation pneumonitis [19-26] Lung volumes were calculated for each plan as sum of right and left lung excluding the CTV volume. The normal tissue complication probability was evaluated by applying two different radiobiological models available in BioSuite: the Lyman-Kutcher-Burman (LKB) [27-29] :
and the relative seriality (RS) models [30] :
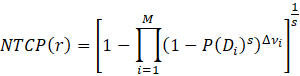
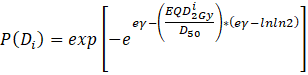
where P(Di) is the probability of response of an organ having the reference volume and being irradiated to dose Di.
Three sets of m, n, D50 and γ parameters (Table 1) were used to predict late rectal bleeding in prostate patients and to quantify the risk of developing radiation pneumonitis in patients treated for lung disease. A α/β value of 3 Gy was assumed for rectum and lung.
Table 1. LKB and seriality model parameters used for NTCP calculation
Study |
Reference |
LKB parameters |
Seriality parameters |
Prostate |
|
n |
D50 (Gy) |
m |
γ |
D50 (Gy) |
s |
Rancati et al. 2004 [31] |
0.23 |
81.9 |
0.19 |
- |
- |
- |
Rancati et al. 2008 [32] |
0.085 |
97.7 |
0.27 |
- |
- |
- |
Rancati et al. 2004 [31] |
- |
- |
- |
1.69 |
83.1 |
0.49 |
Lung |
|
n |
D50 (Gy) |
m |
γ |
D50 (Gy) |
s |
Emami et al.[33] / Burman et al.[28] |
0.87 |
24.5 |
0.18 |
- |
- |
- |
De Jeager et al. [34] |
1 |
29.2 |
0.45 |
- |
- |
- |
Seppenwoolde et al. [35] |
- |
- |
- |
0.9 |
34 |
0.06 |
The fractionation scheme was taken into account through the LQ corrected DVH. NTCP variation versus number of fractions was calculated for each patient and reported as a percentage of coefficient of variation (CV) that is defined as the ratio of the NTCP standard deviation to the NTCP mean. A paired t-test was performed to assess the difference between 3DCRT and IMRT treatment. A p-value less than 0.05 was considered statistically significant.
A Pearson method was used to verify the correlation among dose-volume constraints and NTCPs.
Prostate
The 3DCRT versus IMRT prostate group comparison did not point out statistically significant differences. A paired t-test was performed to compare VD, total dose and NTCP values for each fractionation scheme under examination. In all cases no differences were observed between the two groups (p > 0.05). Mean VD, mean total dose and mean NTCP values calculated for each prostate groups of treatment are reported in Table 2 and Table 3.
Table 2. Prostate 3DCRT mean summary data
Fraction# |
Mean
V40-LQ (%) |
Mean
Total Dose (Gy) |
Mean
NTCP (%) |
Mean
V50-LQ (%) |
Mean
Total Dose (Gy) |
Mean
NTCP (%) |
Mean
V60-LQ (%) |
Mean
Total Dose (Gy) |
Mean
NTCP (%) |
Mean
V70-LQ (%) |
Mean
Total Dose (Gy) |
Mean
NTCP (%) |
38 |
44.55 |
76 |
10.16 |
34.12 |
76 |
10.16 |
24.94 |
76 |
10.16 |
14.63 |
76 |
10.16 |
20 |
|
64.49 |
12.65 |
|
63.6 |
11.59 |
|
63 |
10.9 |
|
62.42 |
10.28 |
10 |
|
51.84 |
15.74 |
|
50.68 |
13.29 |
|
49.59 |
11.65 |
|
48.82 |
10.46 |
5 |
|
40.28 |
19 |
|
38.95 |
15.06 |
|
37.95 |
12.43 |
|
37.12 |
10.65 |
Table 3. Prostate IMRT mean summary data
Fraction
# |
Mean V40-LQ (%) |
Mean
Total Dose (Gy) |
Mean NTCP (%) |
Mean V50-LQ (%) |
Mean Total Dose (Gy) |
Mean NTCP (%) |
Mean V60-LQ (%) |
Mean Total Dose (Gy) |
Mean NTCP (%) |
Mean V70-LQ (%) |
Mean Total Dose (Gy) |
Mean NTCP (%) |
38 |
48.26 |
76 |
10.05 |
36.89 |
76 |
10.05 |
26.67 |
76 |
10.05 |
14.67 |
76 |
10.05 |
20 |
|
64.49 |
12.46 |
|
63.6 |
11.42 |
|
63 |
10.74 |
|
62.43 |
10.13 |
10 |
|
51.84 |
15.49 |
|
50.58 |
13.14 |
|
49.6 |
11.48 |
|
48.81 |
10.26 |
5 |
|
40.22 |
18.72 |
|
38.95 |
14.73 |
|
37.97 |
12.2 |
|
37.12 |
10.42 |
No mean dose difference was found between 3DCRT and IMRT prostate plans analysis when 38, 20, 10 and 5 fractions were considered (p > 0.05). Since the two groups did not show differences all patients were considered as part of a single group. NTCP percentage values for all patients and for all fractionation schemes were calculated at a fixed dose volume constraint (VD) for each set of parameters. Figure 1 shows rectum NTCP values calculated at V40 and V70 for all prostate patients at different number of fractions using Rancati’s32 parameters.
Figure 1. Rectum NTCP percentage values calculated for 38, 20, 10 and 5 fractions for all prostate patients at fixed V40 and V70 dose-constraints using Rancati et al. [32] parameters
At low dose value (V40) NTCP seems to depend on the number of fractions considered; its value increase with the dose per fraction showing a maximum and minimum difference of 91.87% and 21.11% for different groups of fractions. At higher doses (VD>40 Gy) the dependence on the number of fractions decreases significantly reaching a maximum and minimum difference of 6.50% and 0.93% respectively when the same number of fractions were considered. Similar results (ranging from 90.95% and 21.15% at low doses and 6.10% and 0.91% at higher doses respectively) were found using the others set of parameters reported in Table 1.
At V70 the rectum NTCP values increase according to the power-law relation (Figure 2) for all fractionation schemes. Statistically significant correlation (p < 0.05, mean-value = 0.955) between V70 and NTCP values calculated for all sets of radiobiological parameters used was found performing the Pearson test. No correlation was observed at lower VD constraints (mean- value = 0.12; p = 0.279).
Figure 2. NTCP versus V70 at different fractionation schemes using Rancati et al. [32] parameters
A coefficient of NTCP variation (CV) at each dose-volume limit was calculated using the Rancati et al. LKB and seriality model parameters (Figure 3). The CV coefficient decrease increasing VD values for all three groups of parameters considered. Higher CV differences were observed at low doses when the two Rancati [31,32] LKB parameters models were used. All three models converge at lower values when higher doses are considered. The three models intercept each other at V70 as reported in Figure 3.
Figure 3. CV coefficient of rectum NTCP variation defined as the NTCP standard deviation and NTCP mean ratio is reported for V40, V50, V60 and V70 for all three Rancati et al. model parameters used
Lung
No significant mean total dose and mean NTCP differences were observed at 20, 10 and 5 fractionation schemes between the two lung treatments when the paired t-test was calculated (p > 0.05) (Table 4 and Table 5). Mean VD differences ranging from a maximum of 66.7% and a minimum of 13.5% calculated for V13 and V30 respectively were observed between the two lung groups. Because the original prescription dose was different, 60Gy/30 fractions and 55Gy/20 fractions for IMRT and 3DCRT respectively, the two groups were analysed separately.
Table 4. Lung 3DCRT mean summary data
Fraction# |
Mean V40-LQ (%) |
Mean Total Dose (Gy) |
Mean NTCP (%) |
Mean V30-LQ (%) |
Mean Total Dose (Gy) |
Mean NTCP (%) |
Mean V20-LQ (%) |
Mean Total Dose (Gy) |
Mean NTCP (%) |
Mean V13-LQ (%) |
Mean Total Dose (Gy) |
Mean NTCP (%) |
Mean V5-LQ (%) |
Mean Total Dose (Gy) |
Mean NTCP (%) |
20 |
13.1 |
55 |
10.78 |
15.6 |
55 |
10.78 |
19 |
55 |
10.78 |
23.6 |
55 |
10.78 |
41.04 |
55 |
10.78 |
10 |
|
44.16 |
10.54 |
|
45.06 |
11.07 |
|
46.07 |
11.77 |
|
47.48 |
12.74 |
|
50.46 |
15.05 |
5 |
|
34.45 |
10.49 |
|
35.49 |
11.34 |
|
37.05 |
12.83 |
|
39.24 |
15.13 |
|
44.26 |
22.02 |
Table 5. Lung IMRT mean summary data
Fraction# |
Mean V40-LQ (%) |
Mean Total Dose (Gy) |
Mean NTCP (%) |
Mean V30-LQ (%) |
Mean Total Dose (Gy) |
Mean NTCP (%) |
Mean V20-LQ (%) |
Mean Total Dose (Gy) |
Mean NTCP (%) |
Mean V13-LQ (%) |
Mean Total Dose (Gy) |
Mean NTCP (%) |
Mean V5-LQ (%) |
Mean Total Dose (Gy) |
Mean NTCP (%) |
30 |
7.68 |
60 |
11.97 |
13.49 |
60 |
11.97 |
24.35 |
60 |
11.97 |
39.36 |
60 |
12.3 |
61.17 |
60 |
11.97 |
20 |
|
53.92 |
11.54 |
|
54.49 |
11.81 |
|
55.3 |
12.21 |
|
56.21 |
13.09 |
|
58 |
13.68 |
10 |
|
43.35 |
10.76 |
|
44.52 |
11.49 |
|
46.37 |
12.71 |
|
48.48 |
14.78 |
|
53.12 |
18.36 |
5 |
|
33.7 |
10.09 |
|
35.05 |
11.18 |
|
37.3 |
13.2 |
|
40 |
16.78 |
|
46.7 |
25.83 |
The percentage of lung that receives high dose (V30 and V40) was lower for IMRT than for 3DCRT plans and the relative NTCP values differ less than 3%. For VD was less than V20 the IMRT rate of complications increase (27%) when compared to 3D conformal plans.
A significant mean power-law correlation coefficient ranging from 0.931 to 0.86 and 0.910 to 0.81 (p< 0.05) was found for V30, V40 and NTCP in both 3DCRT and IMRT treatments respectively at all fractionation schemes and for all model parameters used. Lower correlation (<0.60) was found instead for all others dose-volume parameters and NTCP values.
Large NTCP variations were observed at V5 especially when the number of fractions was reduced to less than 10 (Figure 4). All others values (VD>13) remain constant changing the number of fractions.
Figure 4. NTCP variation at different number of fraction and for different dose-volume limits considered
A NTCP variation given as CV value for all lung VD values under examination was calculated using Emami [33], De Jaeger [34] and Seppenwoolde [35] model parameters reported in Table 1. 3DCRT and IMRT CV lung values were fitted by a polynomial of second order curve regardless of the model used as showed in Figure 5. The minimum percentage of volume was calculated for all three groups of parameters used. The minimum values were: V29.74, V28.37 and V28.58 for IMRT treatments and V33.95, V30.30, and V31.75 for 3DCRT lung treatments considering Emami, De Jaeger and Seppenwoolde parameters respectively.
Figure 5. 3DCRT and IMRT CV coefficient of lung versus V5, V13, V20, V30 and V40 dose limits for different parameters used
For both techniques the mean CV values obtained using Emami/Burman parameters were significantly higher than the values calculated for NTCP predicted by other sets of parameters under examination especially at lower VD values.
External beam irradiation regimens have been developed over several decades and the mode of apply 1.8-2.0 Gy given 5 days per week up to total doses exceeding 70 Gy have been shown to be safe with severe side effects being very rare events. Since most cancers and normal tissues behave differently when exposed to radiation, the linear-quadratic equation is used as a biomathematical model able to describe fractionation sensitivity of tissues and to calculate isoeffective doses when different dose per fraction is given.
In the recent years, the use of improved technology has fostered the increasing interest in hypofractionated radiotherapy for prostate cancer and lung treatments.
Multiple studies have confirmed the importance of delivering sufficiently high doses in order to cure patients. Modern radiotherapy techniques such as IMRT or VMAT may potentially be used to deliver hypofractionated treatments without increased toxicity. Studies based on the linear-quadratic model of radiation dose response have also shown that prostate cancer exhibits a low α/β value, which suggests that RT of fewer and larger fractions would increase therapeutic efficacy [36,37]. In addition, the rationale for the shorter treatment seems increased patient convenience and optimized use of resources.
Our study was focused on investigating rectum and lung NTCP variation at different fractionation schemes when dose-volume constrains, VD, were kept fixed and equal to the original 2 Gy daily fraction plan. The results show no statistically significant differences between 3DCRT and IMRT techniques for both rectum and lung organs. This effect can be due to the fact that all plans were optimised and calculated to fully satisfy the dose-volume constraints.
Larger differences were found just at lower VD. NTCP values were small for both 3D and IMRT and even if the mean NTCP for organs tend to be lower for IMRT than for 3D their differences were not significant especially for the rectum case. Similar results were reported by Koontz et al. [38] that comparing 3DCRT versus IMRT for prostate bed, they found no difference in the volume of rectum receiving at least 65 Gy (V65) between the two techniques. In addition they found that IMRT technique significant reduced the rectum volume receiving 40 Gy or more but despite these dosimetric differences no significant variation in the NTCP for either bladder or rectal injury were observed.
All sets of model parameters used in the present study pointed out that at higher doses the effect of organ complication seems to be independent from the number of fractions considered. In all cases larger differences among model parameters used were observed at lower doses as confirmed by the CV coefficient. The coefficient allows comparison of the variability of NTCP values versus scheme fractionation for each set of radiobiological parameters at different VD. The smaller the CV, the greater the uniformity.
The coefficient of variation in NTCP heterogeneity was estimated to be less than 10% for VD>60 Gy and VD> 20 Gy for the rectum and lung cases respectively.
In the rectum patients lower CV values were obtained for the Rancati 2008 LKB model that with its lower n value shows higher volume dependence at all VD values. Unlike these, the two sets of data calculated using Rancati 2004 LKB and seriality models resulted less uniform showing a percentage difference of 49% and 31% at V40 when compared to the previous set of parameters. All three models converge to the lower CV value when the dose-limit V70 was considered; this could confirm V70 to be a predictive value for rectum toxicity. Furthermore, this result seems to show a stronger NTCP rectal bleeding dependence on the volume parameter ( n) in agreement with studies that have shown as keeping the percentage of rectum receiving more than 70 Gy and 75 Gy (V70 and V75) below 25% and 5% respectively is predictive of a lower incidence of bleeding toxicity [39,40].
While, Zelefsky [41] in his study reporting the Memorial Sloan-Kettering IMRT experience suggests that doses in the intermediate range of 40-60 Gy may become important in patients who are receiving radiation prescriptions in excess of 78 Gy.
Generally VDose has not been found to be significantly associated with differences in rectal toxicity for doses ≤ 45 Gy.
However, several studies [42,43] have shown has a moderately (60 Gy in 20 fractions) hypofractionated RT for prostate cancer is not inferior to the standard regimen of 78 Gy in 39 fraction for intermediate-risk prostate cancer.
Radiation pneumonitis is a common side effect in primary or metastatic lung tumor radiotherapy treatment that can significantly affect patients’ quality of life. Several predictive factors as tumor volume, tumor location, smoking history total dose and dose per fraction were found to relate to lung pneumonitis toxicity. Studies [44,45] have shown as dose volume values are potentially factors to predict pneumonitis. In conventional fractionation, the Quantitative Analysis of Normal Tissue Effects in the Clinic (QUANTEC) recommends to maintain a V20 < 30% - 35% and a mean lung dose less than 20 - 23 Gy to reduce the risk of developing pneumonitis of about 20% while, GRAHAM showed no pneumonitis effect when V20 Gy was less than 22% and only 8% of Grade 2 pneumonitis was observed for V20 <22-31%.
In contrast, Marks et al. [46] in their study analysing patients treated with 3DCRT found that V30 was the best predictor factor of pneumonitis and fibrosis symptom using the NTCP Lyman model. This result seems to be in agreement with our CV analysis that showed a minimum in NTCP variability when VD ranges between V28.4 and V29.7 and V30 and V34 for both IMRT and 3DCRT techniques respectively when all model were considered.
We observed that NTCP doesn’t seem to depend on the number of fractions for VD>20 Gy showing a percentage difference among fractions less than 5% while larger differences (29-51%) were observed for VD<20 Gy. In the present study it was observed that low dose constraints seem to be more significant when smaller number of fractions are considered. Same results were observed for rectum complication; it was found that rectum NTCP increase decreasing the number of fractions going from a maximum difference of 47% at V40 to a minimum value of 4.6% at V70. According to our study, more attention should be given to low dose-volume constraints when a hypofractionated scheme is chosen for treatment due to an NTCP increase up to 50% when compared to the standard 2 Gy per fraction scheme.
However, there are no clear guidelines for dose-volume limits especially when hypofractionated schemes are used.
In addition, it should be stated that there are large uncertainties in the biological models used and its associated parameters. Because tissue irradiated with high doses is aspected to show different radiobiological response it can be difficult to predict toxicity using traditional radiobiological models.
There was no financial support for the conduct of the research and preparation of the article.
No conflicts of interest exist. This study had no sponsor involvement.
- Dearnaley D, Syndikus I, Sumo G (2012) Conventional versus hypofractionated high-dose intensity modulated radiotherapy for prostate cancer: preliminary safety results from the CHHiP randomised controlled trial. Lancet Oncol 13: 43-54. [Crossref]
- Pollack A, Walker G, Horwitz EM (2013) Randomized trial of hypofractionated external-beam radiotherapy for prostate cancer. J Clin Oncol 31: 3860-3868. [Crossref]
- Hoffman KE, Voong KR, Pugh TJ (2014) Risk of late toxicity in men receiving dose-escalated hypofractionated intensity modulated prostate radiation therapy: results from a randomized trial. Int J Radiat Oncol Biol Phys 88: 1074-1084. [Crossref]
- Arcangeli S, Strigari L, Gomellini S (2012) Updated results and patterns of failure in a randomized hypofractionation trial for high-risk prostate cancer. Int J Radiat Oncol Biol Phys 84: 1172-1178. [Crossref]
- Abratt RP, Bogart JA, Hunter A (2002) Hypofractionated irradiation for non-small cell lung cancer. Lung Cancer 36: 225-233. [Crossref]
- Sundstrøm S, Bremnes R, Aasebo U (2004) The effect of hypofractionated palliative radiotherapy (17 Gy per two fractions) in advanced non-small cell lung carcinoma is comparable to standard fractionation for symptom control and survival: Results from a national phase III trial. J Clin Oncol 22: 801-810.
- Gaze MN, Kelly CG, Kerr GR (2001) Fractionated thoracic radiotherapy gives better symptom relief in patients with non-small cell lung cancer. EJC 37: S29.
- Michalski JM, Gay H, Jackson A, Tucker SL, Deasy JO (2010) Radiation dose-volume effects in radiation-induced rectal injury. Int J Radiat OncolBiol Phys 76: S123-S129. [Crossref]
- Fowler JF, Tomé WA, Fenwick JD, Mehta MP (2004) A challenge to traditional radiation oncology. Int J Radiat OncolBiol Phys 15: 1241-1256. [Crossref]
- Uzan J, Nahum AE (2012) Radiobiologically guided optimization of the prescription dose and fractionation scheme in radiotherapy using BioSuite. Br J Radiol 85: 1279-1286.
- Milano M, Constine LS, Okunieff P (2007) Normal tissue tolerance dose metrics for radiation therapy of major organs. Semin Radiat Oncol 17: 131-140.
- Emami B, Lyman J, Brown A (1991) Tolerance of normal tissue to therapeutic irradiation. Int J Radiat OncolBiol Phys 21: 109-122.
- Bentzen SM, Constine LS (2010) The quantitative analysis of normal tissue effects in the clinic (Quantec). Int J Radiation Oncology Biol Phys 76: 1-160.
- Marks LB (2010) Use of normal tissue complication probability models in the clinic. Int J Radiation Oncology Biol Phys 76: 10-19.
- Perez CA, Stanley K, Rubin P (1980) A prospective randomized study of various irradiation doses and fractionation schedules in the treatment of inoperable non-oat-cell carcinoma of the lungs. Preliminary report by the radiation therapy oncology group. Cancer 45: 2744-2753.
- Huang EH, Pollack A, Levy L (2002) late rectal toxicity: Dose-volume effects of conformal radiotherapy for prostate cancer. Int J Radiat Oncol Biol Phys 54: 1314-1321.
- Vavassori V, Fiorino C, Rancati T (2007) Predictors for rectal and intestinal acute toxicities during prostate cancer high-dose 3D-CRT: Results of a prospective multicentre study. Int J Radiat Oncol Biol Phys 67: 1401-1410. [Crossref]
- Vargas C, Martinez A, Kestin LL (2005) Dose-volume analysis predictors for chronic rectal toxicity after treatment of prostate cancer with adaptive-guided radiotherapy. Int J Radiat Oncol Biol Phys 62: 1297-1308. [Crossref]
- Yorke ED, Jackson A, Rosenzweig KE (2005) Correlation of dosimetric factors and radiation pneumonitis for non-small-cell lung cancer patients in a recently completed dose escalation study. Int J Radiat Oncol Biol Phys 63: 672-682.
- Willer J, Jost A, Baier K (2003) A little to a lot or a lot to a little? An analysis of pneumonitis risk from dose-volume histogram parameters of the lung in patients with lung cancer treated with 3-D conformal radiotherapy. Stralenther Onkol 179: 548-556.
- Hernando ML, Marks LB, Bentel GC (2001) Radiation-induced pulmonary toxicity: A dose-volume histogram analysis in 201 patients with lung cancer. Int J Radiat OncolBiol Phys 51: 650-659.
- Kong FM, Hayman JA, Griffith KA (2006) Final toxicity results of a radiation-dose escalation study in patients with non-small-cell lung cancer (NSCLC): predictors for radiation pneumonitis and fibrosis. Int J Radiat Oncol Biol Phys 65: 1075-1086. [Crossref]
- Kim TH, Cho KH, Pyo HR (2005) Dose-volumetric parameters for predicting severe radiation pneumonitis after three-dimensional conformal radiation therapy for lung cancer. Radiology 235: 208-215.
- Wang S, Liao Z, Wei X (2006) Analysis of clinical and dosimetric factors associated with treatment-related pneumonitis (TPR) in patients with non-small-cell lung cancer (NSCLC) treated with concurrent chemotherapy and three-dimensional conformal radiotherapy (3D-CRT). Int J Radiat Oncol Biol Phys 66: 1399-1407. [Crossref]
- Schallenkamp JM, Miller RC, Brinkmann DH (2007) Incidence of radiation pneumonitis after thoracic irradiation: Dose-volume correlates. Int J Radiat Oncol Biol Phys 67: 410-416.
- Marks LB, Bentzen SM, Deasy JO, Kong FM, Bradley JD, et al. (2010) Radiation dose-volume effects in the lung. Int J Radiat Oncol Biol Phys 76: S70-76. [Crossref]
- Kutcher GJ, Burman C, Brewster L (1991) Histogram reduction method for calculating complication probabilities for three-dimensional treatment planning evaluations. Int J Radiat Oncol Biol Phys 21: 137-146.
- Burman C, Kutcher GJ, Emami B (1991) Fitting of normal tissue tolerance data to an analytic function. Int J Radiat Oncol Biol Phys 21: 123-135.
- Lyman JT, Wolbarst AB (1987) Optimization of radiation therapy III: a method of assessing complication probabilities from dose volume histograms. Int J Radiat Oncol Biol Phys 13: 103-109.
- Källman P, Agren A, Brahme A (1992) Tumour and normal tissue responses to fractionated non-uniform dose delivery. Int J Radiat Biol 62: 249-262. [Crossref]
- Rancati T, Fiorino C, Gagliardi G (2004) Fitting late rectal bleeding data using different NTCP models: results from an Italian multi-centric study (AIROPROS0101). Radiother Oncol 73: 21-32.
- Rancati T, Fiorino C, Vavassori V (2008) Late rectal bleeding after conformal radiotherapy for prostate cancer: NTCP modeling. Radiother Oncol 88: S332-S333.
- Emami B, Lyman J, Brown A (1991) Tolerance of normal tissue to therapeutic irradiation. Int J Radiat Oncol Biol Phys 21: 109-112.
- De Jaeger K, Hoogeman MS, Engelsman M (2003) Incorporating an improved dose-calculation algorithm in conformal radiotherapy of lung cancer: re-evaluation of dose in normal lung tissue. Radiother Oncol 69: 1-10.
- Seppenwoolde Y, Lebesque JV, De Jaeger K (2003) Comparing different NTCP models that predict the incidence of radiation pneumonitis. Int J Radiat Oncol Biol Phys 55: 724-735. [Crossref]
- Brenner DJ, Martinez AA, Edmundson GK (2002) Direct evidence that prostate tumors show high sensitivity to fractionation (low alpha/beta ratio), similar to late-responding normal tissue. Int J Radiat Oncol Biol Phys 52: 6-13.
- Miralbell R, Roberts SA, Zubizarreta E (2012) Dose-fractionation sensitivity of prostate cancer deduced from radiotherapy outcomes of 5,969 patients in seven international institutional datasets: α/β = 1.4 (0.9-2.2) Gy. Int J Radiat Oncol Biol Phys 82: 17-24. [Crossref]
- Koontz BF, Das S, Temple K (2009) Dosimetric and radiobiologic comparison of 3D conformal versus intensity modulated planning techniques for prostate bed radiotherapy. Med Dosim 34: 256-260.
- Fiorino C, Valdagni R, Rancati T, Sanguineti G (2009) Dose-volume effects for normal tissues in external radiotherapy: pelvis. Radiother Oncol 93: 153-167.
- Van der Laan HP, van den Bergh A, Schilstra C, Vlasman R, Meertens H, et al. (2008) Grading-system-dependent volume effects for late radiation-induced rectal toxicity after curative radiotherapy for prostate cancer. Int J Radiat Oncol Biol Phys 70: 1138-1145.
- Zelefsky MJ, Levin EJ, Hunt M (2008) Incidence of late rectal and urinary toxicities after threedimensional conformal radiotherapy and intensity-modulated radiotherapy for localized prostate cancer. Int J Radiat Oncol Biol Phys 70: 1124-1129.
- Lee WR, Dignam JJ, Amin MB (2016) Randomised phase III noninferiority study comparing two radiotherapy fractionation schedules in patients with low-risk prostate cancer. J Clin Oncol 34: 2325-2332.
- Dearnaley D, Syndikus I, Sumo G (2012) Conventional versus hypofractionated high-dose intensity-modulated radiotherapy for prostate cancer: preliminary safety results from the CHHiP randomised controlled trial. Lancet Oncol 13: 43-54.
- Borst GR, Ishikawa M, Nijkamp J, Hauptmann M, Shirato H, et al. (2009) Radiation pneumonitis in patients treated for malignant pulmonary lesions with hypofractionated radiation therapy. Radiother Oncol 91: 307-313. [Crossref]
- Barriger RB, Forquer JA, Brabham JG, Andolino DL, Shapiro RH, et al. (2012) A dose-volume analysis of radiation pneumonitis in non-small cell lung cancer patients treated with stereotactic body radiation therapy. Int J Radiat Oncol Biol Phys 82: 457-462. [Crossref]
- Marks LB, Munley MT, Bentel GC (1997) Physical and biological predictors of changes in whole-lung function following thoracic irradiation. Int J Radiat Oncol Biol Phys 39: 563-570.