The aim of this study is to develop a recovery system of platinum group metals (PGMs), such as palladium, platinum, and rhodium from wastewaters that contain [PdCl4]2-, [PtCl6]2- or [RhCl6-n(H2O)6]n-3 ions. A built-in electromotive force from a microbial fuel cell (MFC) was utilized for recovering the PGMs from its cathode chamber under the biofilm-coated anode. After 40 hours of reaction, the obtained Pd, Pt and Rh recovery efficiencies from MFC cathodes with an initial concentration of 200 ppm were 99.2%, 99.5%, and 98.7%, respectively. The highest maximum power density of 7.03 W/m2 with a fill factor of 0.638 was achieved at 1000 ppm Pd2+ catholyte concentration under the experimental range. Using an initial catholyte concentration of 500 ppm for comparison, the maximum power density that was achieved was 4.22 W/m2 for [PdCl4]2-, 5.04 W/m2 for [PtCl6]2-, and 2.44 W/m2 for [RhCl6-n (H2O)6]n-3, respectively. Finally, the electrical energy generation rate was obtained from discharging curves and remaining concentration data in the order of Pd-MFC (39.2 Wh/kg) > Rh-MFC (35.1 Wh/kg) > Pt-MFC (17.2 Wh/kg). The metals recovered on the electrode surface were found to be pure based on the SEM micrographs and EDS analysis.
platinum group metal recovery, built-in electromotive force, microbial fuel cell, biofilm-coated anode, electrical energy generation, wastewater treatment
Platinum group metals (PGMs) are widely used not only in healthcare, jewelry, machine, and but also in the chemical industry such as catalysts for chemical reactions, electrical, electronic industries and corrosion resistant materials. However, the demand for PGMs has not been balanced by supply due to consumed resources. Also, there are no alternatives to these costly metals. The production of PGMs from secondary and technogenous materials is becoming more demanding. Thus, recycling of spent catalysts, electronic scrap, wastes of non-ferrous metals and exhausted nuclear fuel is a matter of high importance [1]. The recovery of precious metals, such as palladium, platinum and rhodium, which belong to the PGMs, is even more economical and attractive. The increasing demand for catalytic metals and the limited resource for precious metals make the recovery of PGMs a strategic topic that have received a great deal of attention in the past decades [2]. Thus, considerable attention is given to the possibility of recovering dissolved platinum, palladium and rhodium ions from abundant wastes, such as spent electroless plating solutions, printed circuit boards and spent nuclear fuels. Furthermore, current pyrometallurgical and hydrometallurgical recycling processes contribute to the (growing) environmental concerns and need to be replaced by some more environmentally friendly technologies [3], such as microbial fuel cell (MFC) techniques [4]. MFCs has several advantages over other recovery techniques because they are cost-effective, require less energy, cause less pollution and raise less anode corrosion, and recovers both materials and electrical energy. Highly pure metal state Pd, Pt and Rh can be recovered from the cathode chamber of MFC. The cathode chamber is separated by a membrane from the anode chamber containing biofilms and organic electron donors, generating electrical energy as a byproduct. Pd2+ as [PdCl4]2-, Pt4+ as [PtCl6]2-, and Rh3+ as [RhCl6-n (H2O)6]n-3 function as potential electron acceptors in the cathode chamber of the MFC because of their high standard reduction potentials.
The electrochemical reactions and standard reduction potentials of precious metal ions of interest in this study with respect to standard hydrogen electrode (SHE) at 25°C are as follows:
NADH = NAD+ + 2H+ + 2e- (for example, a ratio of [NADH]/[NAD+] = 0.1 in biofilm)
E0a = -0.281 V (1)
[PdCl4]2-(aq) + 2e- = Pd(s) + 4Cl-(aq) E0c = 0.59 V (2)
Nicotinamide adenine dinucleotide (NADH) is produced in the citric acid cycle (CAC) of the bacteria metabolizing carbonaceous materials, such as acetate and glucose. It is oxidized to transfer electrons to the anode following Eq. (1) as an electron donor, and precious metal ions can be used as electron acceptors to be reduced at the cathode following Eq. (2). From these two equations, the built-in electromotive force from a microbial fuel cell (MFC), E0emf, is calculated to be 0.87 V. E0emf is utilized for recovering the PGMs from its cathode chamber under the biofilm-coated anode.
[PtCl6]2-(aq) + 2e- = [PtCl4]2-(aq) + 2Cl-(aq) E0c = 1.011 V (3)
[PtCl4]2-(aq) + 2e- = Pt(s) + 4Cl-(aq) E0c = 0.847 V (4)
From Eq. (3), the electromotive force is known to be E0emf of 1.292 V, and from Eq. (4) it is calculated to be E0emf of 1.128 V, which means that the Pt recovery reaction occurs through two two-electron processes. Finally, Rh+3 is the principal oxidation state among the oxidation states of the complexes usually dominating in chloride solutions. Rhodium recovery seems complex because there exists seven different chloro-complexes depending upon HCl concentration [5]. In most solutions there exist at least two species. These chloro complexes undergo aquation as below:
[RhCl6]3- + nH2O → [RhCl6-n(H2O)n]n-3 + nCl- (5)
The extent of each complex depends on chloride concentration, temperature, age, and pH of the solution. The complex undergoes hydrolysis (pH>3) as follows [5,6]:
[RhCl6-n(H2O)n]n-3 + H2O → [RhCl6-n(H2O)n-1OH]n-4 + H3O+, (6)
where n ≥ 1. Even though Rh(III) species exist in solution, the substitution of ligands in the system [RhCl6-n(H2O)n]n-3 is a very slow process and all the complexes are reduced at the same potential [7]. So, the electrochemical reaction and standard reduction potential with respect to standard hydrogen electrode (SHE) at 25°C are as follows:
Rh3+(aq) + 3e- = Rh(s) E0c = 0.431 V (7)
From Eq. (7), the electromotive force (Eoemf) is calculated to be 0.715 V.
Recovery of palladium, platinum, and rhodium metals have been performed by several separation methods solvent extraction, ion exchange, non-aqueous methods, chelating resins, cementation by sacrificial metals [8] electrochemical method [9] and microbial method [3]. Among these techniques, the microbial method would be closest to microbial fuel cell technique. In this method Pd (II) reduction with formate as the electron donor in the presence of Gram-negative bacteria has been investigated. The advantages of the cementation process include its relative simplicity, ease of control and its ability to recover valuable metals [10,11]. However, the consumption of sacrificial metals and the redox potentials of sacrificial metals limit the application of this process [12]. Bio-sorption represents a biotechnological innovation as well as a cost effective and excellent tool for recovery of precious metals from aqueous solutions [13]. This is due to the fact that the properties of certain types of inactive or dead microbial biomass materials allow them to bind and concentrate metal ions from industrial effluents and aqueous solutions [14].
Comparing the recovery techniques mentioned above, MFC can recover PGMs from its cathode chamber separated from the anode chamber containing anaerobic bacteria and organic electron donors, in addition to producing electric energy as a byproduct. Therefore, MFC would be a potentially advantageous technique in recovering PGMs from wastewaters coupled with electric power generation. It could be considered much more cost-effective than any method illustrated above when real wastewaters are used.
A lot of work on metal recovery in bio electrochemical systems has been conducted during the last decade. There is a review published in the literature. This article reviewed the state of art research of bioelectrochemical systems for removal and recovery of metal(loid) ions. Until now, removal of metal ions, i.e. Co(III/II), Cu(II), Hg(II), Ag(I), Se(IV), and Cd(II) from aqueous solutions has been demonstrated in the modeling of gold recovery from tetrachloroaurate wastewater using a MFC [15]. Recovering platinum from wastewater by charring biofilm of microbial fuel cells has been published by Liu et al. [16]. The results demonstrated a feasible and environmentally friendly approach to efficiently recover and concentrate Pt from simulated wastewater through charring the anodic biofilm of MFCs. Recently, simultaneous removal of chromium (VI) and chromium (III) using double microbial fuel cells has been published [17]. Electron transfer interpretation of the biofilm-coated anode of a microbial fuel cell has been addressed to provide a theoretical approach to MFC [18]. However, the recovery comparison study of PGMs, such as Pd, Pt and Rh, from the wastewaters using MFC has not been previously investigated.
Therefore, the goal of this study is to verify the feasibility of recovering the PGMs from the cathode chambers simultaneously generating electrical power. PGM’s include Pd2+-, Pt4+-, or Rh3+-containing artificial wastewaters as an electron acceptor of MFC. The effects of factors, such as initial Pd2+, Pt4+ and Rh3+ concentrations, and reaction time on remaining concentration and recovery efficiency, were also evaluated and compared. The surface morphology and composition of elements were analyzed.
Materials and instruments
Cation exchange membrane (CEM, CMI-7000) was purchased from Membrane International, Inc. (New Jersey, USA). Carbon fiber (PANEX® 35) was purchased from Zoltek (Missouri, USA). Carbon cloth with a gas diffusion layer (type w1s1005) was purchased from CeTech Co. Ltd. (Taichung, Taiwan). Anaerobic sludge was obtained from an Okcheon wastewater treatment plant in Okcheon, Republic of Korea to inoculate anaerobic bacteria. CH3COONa, NH4Cl, KH2PO4, K2HPO4, NaCl, a solution (1000 ppm Pd2+) of [PdCl4]2- in HCl, H2PtCl6∙xH2O, and RhCl3∙3.5H2O were purchased from Sigma-Aldrich (Seoul, Republic of Korea). Bacto yeast extract was purchased from DIFCO Laboratories (New Jersey, USA). LabVIEW system (National Instruments Model, NI-cDAQ NI 9219, Texas, USA), inductively coupled plasma-atomic emission spectroscopy (ICP-AES) (ICPE-9000, Shimadzu, Kyoto, Japan), energy dispersive spectroscopy (EDS) (Quantax 200, Bruke, Seoul, Republic of Korea), scanning electron microscopy (SEM) (XL-30S FEG, Philips, Amsterdam, Netherlands), and pH-410 meter (Thermo Orion, Massachusetts, USA) were applied.
MFC configuration
A cubical dual-chambered MFC, home-made from acrylic, was used in this study, of which the chambers (length: 6.5 cm, width: 6 cm, height: 6 cm) was of an effective volume of 224 mL. Carbon brush was used as an anode (length 2.5 cm, outer diameter 2.5 cm) in the anode chamber, which was prepared by twisting carbon fibers as reported in literature [18,19]; and carbon cloth, with gas diffusion layers, was used as a cathode (surface area of 2.2 cm2; 1.7 × 1.3 cm) in the cathode chamber. The back surface of the cathode was connected to titanium wire with silver paste (Elcoat, Type P-100, Cans, Seoul, Republic of Korea) and was covered with nonconductive epoxy to expose only one side of electrode to the catholyte. Before connecting the titanium wire, the carbon cloth was pretreated as previously demonstrated [20]. Both these anode and cathode chambers were physically separated by a cation exchange membrane with an effective surface area of 36 cm2 (6 cm × 6 cm) with bolts and nuts.
MFC start-up and operation
A mixture of 112 mL sludge and 112 mL artificial water (AW) was pumped into the anode chamber of MFC and then purged thoroughly with pure nitrogen gas for about 20 minutes prior to conducting experiments. The AW (pH = 7) contained the following: 1 g/L (1.22 mM) CH3COONa as electron donors, 100 mM PBS buffer (mixture of 1.05 g/L KH2PO4 and 2.2 g/L K2HPO4) and 2.2 g/L Bacto yeast extract. The Bacto yeast extract is the water-soluble portion of autolyzed yeast, and it is a source of naturally occurring B-complex vitamins and other growth-promoting substances, making this product an excellent complement for a large variety of microorganisms. Two MFCs were prepared to confirm repeatability of the experiments. (1) When growing biofilms on the bio-anodes in MFCs, the anolyte was pumped into the anode chambers in a batch mode. And 100 mM PBS buffer (mixture of 1.05 g/L KH2PO4 and 2.2 g/L K2HPO4) was used as a catholyte in the cathode chambers, and continuously purged with air to utilize the dissolved oxygen as an electron acceptor [21]. For each fed-batch cycle, as the voltage drops below 50 mV, fresh AW was supplied to the anode chamber. After 3 repeatable stable voltages were obtained by continuously bubbling air into the cathode chamber, the MFC was assumed to have started successfully. The biofilm was coated on the brush anode, which functioned as a bio-anode, while the oxygen in the air was utilized as electron acceptors in the cathode chamber. (2) The above-mentioned anolyte conditions for anode were kept constant throughout this study to obtain the constant anode voltage, when the PGM recovery operation was conducted. The supply of organic electron donor through the anode chamber was kept constant for the polarization and discharge experiments by continuously passing the donor solution from the reservoir containing 4 L solution with a peristaltic pump at a flow rate of 10 mL/min (hydraulic retention time (HRT) = 22.5 min). The catholyte was pumped into the cathode chamber in a batch mode to analyze the catholyte parameters of MFC. When the two MFCs functioned steadily to give stable power, the cathode chamber of each MFCs was replaced by diluted [PdCl4]2-, [PtCl6]2- or [RhCl6-n(H2O)n]n-3 as an electron acceptor in a fed-batch mode with purging N2 (10 mL/min) and continuously stirring magnetic bar to ensure thorough mixing and also eliminating the direct electron consumption effect by dissolved oxygen. (3) The [PdCl4]2- solution was prepared diluting the solution of [PdCl4]2- in HCl commercially purchased. [PtCl6]2- and [RhCl6-n(H2O)n]n-3 solutions were prepared by dissolving H2PtCl6∙xH2O and RhCl3∙3.5H2O (II) chloride, respectively, with distilled water. These solutions were formed to stock solutions of 1000 ppm Pd2+, Pt4+ and Rh3+ each, which were used as electron acceptors. Then, the solutions were further diluted to desired concentrations of interest with distilled water. A 0.2 or 1.0 M KCl (based on experimental condition) solution was added to the catholyte to support the ionic conductivity of the solution, and the pH was adjusted to 2 with diluted HCl and KOH solutions.
MFC performance and electrochemical properties were measured with a LabView system. The voltage between the external resistance was measured by changing the resistance at a rate of 0.5 kΩ from 100 kΩ to 0.01 kΩ during the polarization test. The stable voltage was collected after about 2 minutes. Power density was calculated, as previously reported [22]. Based on the voltage measurements with different resistors, the voltage vs. current density (V-J) curves of MFC were portrayed by obtaining voltage (V) and current density (J=V/RA). From the V-J curves, the fill factor (F.F.) was defined by
F.F. = Pmax/V0 x Jsc, (8)
where Pmax is the maximum power (at the maximum power point), V0 is the open circuit voltage and Jsc is the short circuit current density, which can be assumed to be peak current density Jpeak. Pmax is the largest area (Vmax x Jmax) over the J axis that can be drawn under the V-J curve. The F.F. specifies the cell performance that relates to maximum power. The cell that involves a high overvoltage due to factors like high internal resistance would show a low F.F. The internal resistance (Rint) was roughly determined as the slope of the linear part of the voltage vs. current (V-I) curve or as the maximum power point of the power vs. current (P-I) curve. To obtain the correct internal resistance data the impedance measurement technique should be applied. V0, Vmax, Jmax, Pmax, Rint, and F.F. as electrochemical parameters are presented in the table.
An external resistance of 1.0 kΩ was connected for discharging operation of the cell except when noted otherwise, and all experiments were performed at 25 ± 1° C under atmospheric pressure. At the scheduled sampling interval of about 20 hours, the sample of catholyte was withdrawn from the outlet for measurement of total Pd2+, Pt4+ or Rh3+ analysis using an inductively coupled plasma-atomic emission spectroscopy (ICP-AES) to determine the recovery rate of Pd, Pt, or Rh metals. The concentration was determined by using a standard curve prepared with the known concentrations for the instrument in a 1 ppm - 4 ppm range. The detection limit was 0.5 mg/kg (or ppm). The recovery rates of PGMs were determined as follows:
RE% = ∆[PGM]/[PGMinitial] x 100%, (9)
∆[PGM] is initial metal ion concentration ([PGMinitial]) - remaining concentration of metal ion after a period of time, and [PGMinitial] is initial concentration of metal ions.
This represents the recovery rate of PGMs that can be recovered after the MFC reaction.
Coulombic efficiency (CE%) of the cathode reaction is defined as follows:
 (10)
(10)
where m, I, n, F, V, and ∆[PGM] are molecular mass, current passed, number of electrons involved, Faraday constant, volume, and difference of concentration before and after the reaction of MFC.
The morphologies and atomic compositions of the metal solids on the cathode surface were identified with a scanning electron microscopy (SEM) and energy dispersive x-ray spectrometer (EDS). SEM scans a beam of electrons over a specimen to produce a magnified image of an object. Electrons from the beam hit the surface of the object and bounce off it. A detector registers these scattered electrons and turns them into a picture. EDS systems are typically integrated into a SEM instrument. A typical EDS spectrum is portrayed as a plot of x-ray count rates (counts per second; cps) vs. energy (in keV). Energy peaks correspond to the various elements in the sample. EDS systems include a sensitive x-ray detector, a liquid nitrogen dewar for cooling, and software to collect and analyze energy spectra. To make it clear whether the metals were removed from the catholyte to the surface of the cathode electrode by reduction and not just translocated to the anolyte, the SEM and EDS of PGM on the cathode were analyzed. [PdCl4]2-, [PtCl6]2- and [RhCl6]3- cannot be translocated to the anolyte because they are not ion-exchanged by cationic exchange membrane used as a separator. Therefore, Eq. (9) represents a removal efficiency of PGM.
Effects PGM concentrations on the performances of the PGM-MFC
To characterize the electrochemical properties of the MFC using platinum group metal (PGM) ions as electron acceptors, the working voltage vs. current density (V-J) curves of MFCs for different initial concentrations of [PdCl4]2-, [PtCl6]2-, and [RhCl6-n(H2O)n]n-3 in the catholytes were obtained. The electrochemical parameters are presented in table 1. 0.2 M KCl or 0.2 M NaCl was added to the catholyte to increase the solution conductivity, but 1 M KCl was added to the [RhCl6-n(H2O)n]n-3 electron acceptor solution to keep [RhCl6-n(H2O)n]n-3 in the soluble range. The curves were obtained by changing the external resistance from 100 kΩ to 0.01 kΩ, while the working voltage was measured between the resistor. Onset voltage (V0) is defined as the voltage at zero current of the cell, and F.F. as JmaxVmax/V0Jpeak as well as Pmax, using Jpeak close to Jsc, which were represented in table 1. Based on these curves, power density vs. current density (P-J) curves were obtained and displayed in figure1 and table 1. The power density was linearly increased and maximized with an increase in current density, and subsequently decreased rapidly with further current density increase due to the limited mass transfer (Figure 1). Even if there exists a power decrease with a high current density, the PGM recovery still functions well, but maximum current density can be selected to maintain the maximum power density. The ion exchange membrane’s physical and chemical properties are very critical to achieve high maximum power and high PGMs recovery because lowering of the membrane resistance, Rmem, is a major factor for decrease of the total internal resistance, Rint.
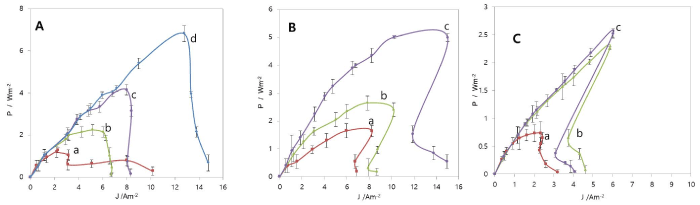
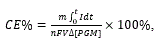
Figure 1. Power vs. Current density (P-J) curves of MFC with different initial concentrations; (A) 50 ~ 1000 ppm Pd2+ as [Pd(II)Cl4]2- with 0.2 M KCl at pH 2, (B) 100 ~ 500 ppm Pt4+ as [Pt(IV)Cl6]2- with 0.2 M NaCl at pH 2, and (C) 50 ~ 500 Rh3+ as [Rh(III)Cl6-n(H2O)n]n-3 with 1.0 M KCl at pH 2.0. a: 50 ppm; b: 100 ppm; c: 200 ppm; d: 500 ppm. Data were measured in duplicate.
Table 1. Electrochemical parameters of MFC in different initial concentration solutions
Concentration/
ppm |
V0/Va |
Jpeak/Am-2b |
Vmax/Vc |
Jmax/ Am-2d |
Pmax/Wm-2e |
Rint/Ωf |
F.F.g |
| |
|
|
Pd2+ |
|
|
|
|
50 |
0.751 |
2.52 |
0.442 |
2.23 |
0.99 |
850 |
0.521 |
100 |
0.782 |
3.1 |
0.535 |
2.43 |
1.3 |
470 |
0.536 |
200 |
0.788 |
6.21 |
0.596 |
4.52 |
2.96 |
220 |
0.551 |
500 initial |
0.767 |
8.53 |
0.526 |
7.95 |
4.18 |
130 |
0.639 |
500 second |
0.773 |
9.09 |
0.528 |
8 |
4.22 |
130 |
0.601 |
1000 initial |
0.742 |
12.31 |
0.542 |
12.32 |
6.68 |
70 |
0.731 |
1000 second |
0.782 |
14.09 |
0.556 |
12.64 |
7.03 |
70 |
0.638 |
| |
|
|
Pt4+ |
|
|
|
|
100 |
0.441 |
8.9 |
0.19 |
8.64 |
1.64 |
110 |
0.42 |
200 |
0.682 |
11.3 |
0.341 |
7.75 |
2.64 |
172 |
0.34 |
500 |
0.91 |
15.2 |
0.333 |
15.14 |
5.04 |
138 |
0.64 |
| |
|
|
Rh3+ |
|
|
|
|
50 |
0.584 |
2.14 |
0.228 |
1.73 |
0.39 |
874 |
0.316 |
100 |
0.586 |
3.18 |
0.331 |
2.51 |
0.83 |
339 |
0.445 |
200 |
0.592 |
5.89 |
0.389 |
5.89 |
2.29 |
130 |
0.657 |
500 |
0.594 |
6.08 |
0.401 |
6.08 |
2.44 |
115 |
0.675 |
aV0; onset potential, bJpeak; peak current density, cVmax; maximum voltage, dJmax; maximum current density, ePmax; maximum power density, fRint; internal resistance, gF.F.; fill factor (F.F. = Pmax / V0 x Jpeak).
V0 is Vc - Va, where Vc and Va are cathode potential and anode potential, respectively. Va is measured to be -0.281 V and kept constant by supplying the anode chamber with a continuous carbonaceous material (HRT = 22.5 min). Because the focusing electrode is cathode recovering PGMs, the anode is assumed not to vary during the operation of the MFC. V0 is obtained from table 1, Vc is V0 - 0.281 V. For example, if V0 is 0.773 V for 500 ppm Pd2+, Vc is 0.773 V – 0.281 V = 0.492 V. The theoretical cathode potential can be calculated for 500 ppm Pd2+ and [Cl-] = 0.2 M using the Nernst equation at 25ºC. Vc = 0.59 V – (RT/2F) ln[Cl-]4/[PdCl42-] = 0.59 V – (0.0592 V/2)log[(0.2)4/4.70x10-3] = 0.604 V. Therefore, the measured Vc is 0.112 V lower than the theoretical value. For the same concentration of [PtCl4]2-, the theoretical cathode potential is calculated to be Vc = 1.011 V – (RT/2F)ln([Cl-])2/[PtCl42-] = 1.011 V – (0.0592 V/2)log(0.04/0.00256) = 0.976 V, so that the measured cathode potential of [PtCl6]2- is 0.910 V – 0.281 V or 0.629 V, which is 0.347 V lower than theoretical value. Finally, for 500 ppm Rh3+, the theoretical cathode potential is calculated to be Vc = 0.431 V – (RT/3F)ln1/[Rh3+] = 0.431 V – (0.0592 V/3)log(1/0.00486) = 0.385 V. The observed cathode potential of Rh3+ is 0.594 V – 0.281 V or 0.313 V, which is 0.072 V lower than theoretical value. Generally, the observed cathode potential is lower than the theoretical value due to the overvoltage.
Interestingly, the maximum power point (Pmax) shifted towards the higher current density with an increase in Pd2+ concentration as [PdCl4]2- (Figure 1A). When the initial curves are considered, almost all parameters improved significantly with an increase in the [PdCl4]2- concentration (Table 1), even if the onset potential (V0) was increased from 50 ppm to 200 ppm, and then decreased from 200 ppm to 1000 ppm. Interestingly, the repeated polarization curves for 500 ppm and 1000 ppm show improvements in all parameters except F.F. with an increase in the concentration, when compared to the initial curves (Table 1). Internal resistance, Rint, determined by the slope of rising portion of the voltage vs. current, decreased from 850 Ω to 70 Ω, as [PdCl4]2- concentration was increased from 50 ppm to 1000 ppm. This represents that the Ohmic resistance decreased in the bulk of the electrolyte when [PdCl4]2- concentration was increased. Increasing [PdCl4]2- concentration could also reduce charge transfer resistance (Rct), expressed by Rct = η/i = RT/i0F, where η is overpotential. i and i0 are current and current density.
i0 = FAk0CO*(1-α)CR*α, (10)
where k0, CO*, and CR* are standard rate constant, concentrations of the oxidized form and reduced form of the bulk species, respectively. α is symmetry factor. The remaining symbols are of conventional meaning. Rct decreases with an increase in initial concentration of the electron acceptor according to Eq. (10). Therefore, Rint also seems to be affected by Rct and concentration of the electron acceptor.
The highest Pmax was found to be 7.03 W/m2 with a F.F. of 0.638 at 1000 ppm (9.40 mM) of Pd2+, as shown in table 1, which is the test solution with the highest concentration in this study. At this power density, the resulting maximum voltage (Vmax), maximum current density (Jmax), and internal resistance were 0.556 V, 12.64 A/m2, and 70 Ω, respectively (Table 1). Under the same concentration (100 ppm [PdCl4]2-) and the same anolyte condition, the Pmax (1.30 W/m2 as shown in table 1) obtained from this study was 3 times higher than the reported value (0.433 W/m2) for Hg2+ at pH 2.0.19 The Pmax (7.03 W/m2) with 1000 ppm Pd2+ from this study is 1.63 times higher than the Pmax (4.3 W/m2) produced for MFC of which the catholyte was a 50 mM K3Fe(CN)6 solution in 100 mM KH2PO4 (adjusted to pH 7 with 1 N NaOH) [24]. Power production in cube air-cathode MFC containing brush anode reached 2.4 W/m2 (normalized to the projected cathode surface area). This power density is currently high value achieved by an air-cathode system [25]. The anolyte and anode were similar to the present study, but the cathode was still different in the sense that the present study adopted a carbon cloth cathode of the two-chambered MFC. The Pmax value of the present study was 3 times higher than the air-cathode MFC. The superior results of the present study would be rendered by a fast electron transfer rate of the carbon cloth cathode with [PdCl4]2- in the cathode chamber of MFC (Table 1).
Figure 1B shows P-J curves of Pt-MFC with [PtCl6]2- electron acceptors, and the electrochemical parameters are summarized in table 1. The Pmax point was also shifted towards the higher current density with an increase in Pt4+ as [PtCl6]2- concentration; This trend was similar to that of Pd-MFC. When Pt4+ concentration was increased from 100 ppm to 500 ppm, the Jmax, Rint and F.F. were improved significantly (Table 1). The Pmax was 5.04 W/m2 with a F.F. of 0.64 for 500 ppm Pt4+. The Vmax, Jmax, and Rint were 0.333 V, 15.14 A/m2, and 138 Ω, respectively, at the Pmax point (Table 1), while that of Pd-MFC was 4.22 W/m2 with a F.F. of 0.601, Vmax of 0.528, Jmax of 8.00 A/m2, and 130 Ω for the same concentration (Table 1).
Figure 1C shows P-J curves of MFC with [RhCl6-n(H2O)n]n-3 electron acceptors, and the electrochemical parameters are also summarized in table 1. The Pmax point shift was similar to that of Pd-MFC and Pt-MFC. The Jmax has a rapid increase from 50 ppm to 200 ppm, but from 200 ppm to 500 ppm, the Jmax was minimally increased. After determining the optimum conditions of pH value (pH = 2) and electrolyte concentration (KCl = 1 M), the effect of initial concentration of Rh3+ as [RhCl6-n(H2O)n]n-3 was examined. Increasing the initial Rh (III) concentration from 50 ppm to 200 ppm increased the Pmax from 0.39 W/m2 to 2.29 W/m2 by a factor of 5.18 with the Rint decreased by a factor of 6.72 from 874 to 130 Ω. Although the Pmax was still improved from 2.29 W/m2 to 2.44 W/m2 only by a factor of 0.06 with further increase in initial concentration from 200 ppm to 500 ppm with Rint decreased by a factor of 1.13. A Pmax of 2.44 W/m2, a Vmax of 0.401 V, a Jmax of 6.08 A/m2, a Rint of 115 Ω, and a F.F. of 0.675 were achieved for the 500 ppm Rh3+ solution.
As a result, the magnitude of Pmax for 500 ppm was in the order of [PtCl6]2- (5.04 W/m2) > [PdCl4]2- (4.22 W/m2) > [RhCl6-n(H2O)n]n-3 (2.44 W/m2) (Table 1). Jmax is in the same order as Pmax (15.14 A/m2 for [PtCl6]2-, 8.00 A/m2 for [PdCl4]2-, and 6.08 A/m2 for [RhCl6-n(H2O)n]n-3). However, Vmax was in the order of [PdCl4]2- (0.528 V) > [RhCl6-n(H2O)n]n-3 (0.401 V) > [PtCl6]2- (0.333 V). Rint was in the order of [RhCl6-n(H2O)n]n-3 (115 Ω) < [PdCl4]2- (130 Ω) < [PtCl6]2- (138 Ω). F.F. is in the order of [RhCl6-n(H2O)n]n-3 (0.675) > [PtCl6]2- (0.64) > [PdCl4]2- (0.601) (Table 1).
According to Table 1, the Vo of Pt4+ was changed to a higher potential side as the Pt4+ ion concentration increased, while those of Pd2+ and Rh3+ were pinned at the constant values. Deposited Pt can work as a catalyst for reduction of protons and incur no onset pinning. A repeated curve of Pd2+ showed higher current density than the initial curve (Table 1). Also, the second polarization curve after the initial polarization experiments showed an increase in current density due to exposure of the catalytic surface deposited with Pd to the solution (Table 1). Again, it is found that this new surface does not only catalyze H+ reduction, but also Pd2+ reduction. At a high Pd2+ concentration, most of the reduction reaction seems to occur from Pd2+, although hydrogen evolution reaction also increases significantly in the low working voltage region of MFC. In order to achieve high rates of Pd recovery, a low pH range is undesirable due to Eq. 11, because the σ becomes low due to the side reaction by proton reduction.
η = σQ, (11)
where η = efficiency, σ = fraction of main recovery, and Q = total charge passed.
When the anode reaction is fast enough not to affect the full cell reaction, the limiting current density (JL) in the V-J curve increased with respect to an increase of PGM ion concentration, and is represented by Eq. (12), where it is proportional to the bulk concentration (Cbulk) of the PGM ions in the solution over the JL region.
JL = nFDCbulk/δ, (12)
where D is the diffusion coefficient of PGM ions, Cbulk is the bulk concentration, δ is the thickness of diffusion layer, n is number of electrons transferred, and F is Faraday constant. If one draws a relationship of JL vs. PGM ion bulk concentration, JL was clearly observed to increase proportionally with an increase in PGM ion concentration by mass transfer of reducible species. This means that the JL is solely affected by the diffusion control on the cathode. A concentration change of [PtCl6]2- from 100 ppm to 500 ppm incited large V0 shifts from 0.895 V to 0.385 V, compared to the equilibrium cell voltage Ecell, if Ecell is assumed to be 1.316 V (Table 1). The V0 shift rate (681 mV/decade) is 31 times higher than expected from a Nernstian behavior (15 mV/decade) from 100 ppm [PtCl6]2- to 500 ppm [PtCl6]2- presumably because there is a catalytic effect due to a metal deposit. V0’s of [PdCl4]2- and [RhCl6-n(H2O)n]n-3 did not show such a shift (Table 1).
Usually the Pt deposit reaction from [PtCl6]2- solution occurs through a two-step reaction, as shown in Eq. (3) and (4) (E0emf = 1.295 V from Eq. (2) and (3), and E0emf = 1.131 V from Eq. (2) and (4)), which could be deciphered from the literature [26,27]. However, such processes in this study were not distinguishable and resulted in a merging of two processes. The catalytic effects of Pt deposit (at the onset potential) make the shapes of power curves of [PtCl6]2- and V0 dissimilar from other two kinds of reactions, such as [PdCl4]2- and [RhCl6-n(H2O)n]n-3 (Figure 1, Table 1). An aged electrode of Pd-MFC actually showed significant improvements in the electrochemical parameters, as shown in table 1. The V0 pinning phenomena of [RhCl6-n(H2O)n]n-3 were similar to Pd-MFC (Table 1).
Knowledge of the amount by which the working voltage of a cell delivers a particular level of the current deviating from its equilibrium value, Ewk, is of central importance in assessing the performance of a practical battery system [28]. This working voltage can be associated with Rint, and overvoltages, as discussed in the introduction. Solely correlating the Pmax improvement of the cell with the lowered Ohmic resistance could be misleading because it is increased not only by lowering Rint as Ohmic resistance, but also by lowering the charge transfer resistance inversely related to PGM ion concentration. The electrochemical parameters should also be compared between the MFCs, such as onset voltage (V0), peak current density (Jpeak), maximum voltage (Vmax) at the Pmax, maximum current density (Jmax) at the Pmax, fill factor (F.F.), and internal resistance (Rint) including charge transfer resistance, as criteria for judging the cell performance.
Discharge curves of the MFC with different initial concentrations of PGM
To characterize the discharging behavior of the MFC, the working voltage vs. time in relation to Pd2+ concentration with 1000 Ω load resistor was recorded with different Pd2+ concentrations (Figure 2A). When the anode chamber conditions remained unchanged, the cathode chamber contained different initial Pd2+ concentrations from 50 ppm to 500 ppm using 0.2 M KCl as a supporting electrolyte. Through the anode chamber, the electron donor solution was passed continuously, so that the dissipation of the fed-batch catholyte could represent the discharge of the MFC. The discharge voltage increased initially as the concentration of Pd2+ was increased; the voltage changed from 0.51 V to 0.70 V when the initial concentration of Pd2+ increased from 50 ppm to 500 ppm. At 50 ppm, the discharge voltage dropped to a very low level within 1 hour; but from 100 ppm to 200 ppm, the voltage plateaued for a progressively longer time with a progressive increase in Pd2+ concentration; then the voltage rapidly dropped again. At 500 ppm, the voltage retained a plateau region up to 40 hours, and then finally started to drop slowly. In the fed-batch catholyte system with an initial concentration of 500 ppm, the discharging showed electrical energy production rate approximately higher than 39.2 Wh/Kg(Pd) as a byproduct along with Pd metal recovery. In reality, the concentration range from 50 ppm to 500 ppm tested could exist because the Pd2+ concentration of the spent solution disposed from the manufacturing of glass fiber catalysts for purification of automobile exhaust gasses is as high as 1000 ppm, as mentioned in the introduction. The difference between this study and the bacterial reduction reported in the literature [3] shows that the former can produce electrical energy while recovering Pd metals on the cathode in a separate chamber, but the latter can only recover Pd metals associated with the bio-cells in the same container with organic material located. The MFC method allows for a clean Pd metal recovery, as well as electric power generation.
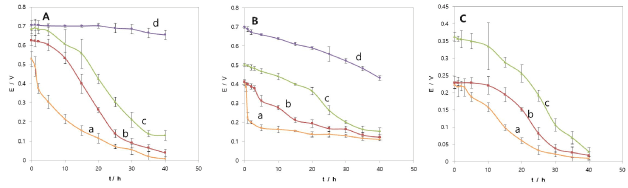
Figure 2. Discharge curve of MFC with different initial concentration of (A) Pd2+ (0.2 M KCl at pH 2), (B) Pt4+ (0.2 M NaCl at pH 2), and (C) Rh3+ (1 M KCl at pH 2) in wastewater according to reaction time with a simulation load of 1000 Ω resistor. a: 50 ppm; b: 100 ppm; c: 200 ppm; d: 500 ppm. Data were measured in duplicate.
Figure 2B shows the discharging characteristics of the MFC with Pt4+ as [Pt(IV)Cl6]2- electron acceptors in the cathode chamber with 0.2 M NaCl as a supporting electrolyte. The experimental conditions were the same as those for Pd2+. The initial discharging voltage increased as the concentration of Pt4+ was increased; it was changed from 0.4 V to 0.7 V with an increase of the initial concentration of Pt4+ from 50 ppm to 500 ppm. At 50 ppm, the discharging voltage dropped to a very low level within 1 hour; but from 100 ppm to 500 ppm, the voltage decreased monotonously with time. From 50 ppm to 100 ppm, the discharging voltage dropped to the minimum level within 40 hours, but from 200 ppm to 500 ppm, the level of voltage remained high even until 22 hours, but it dropped quicker after 22 hours. With the fed-batch system, having an initial concentration of 500 ppm, discharge curves showed an electric energy production rate greater than about 17.2 Wh/kg(Pt) as a byproduct. This rate is lower than that of Pd-MFC.
Figure 2C shows discharging curves of Rh-MFC with Rh3+ as [Rh(III)Cl6-n(H2O)n]n-3 electron acceptors. As the Rh3+ concentration increases from 50 ppm to 200 ppm, the discharging voltage becomes higher. At an initial concentration of 50 ppm, discharging voltage dropped quickly, but from 100 ppm to 200 ppm it was slowly decreased. With the fed-batch system having an initial concentration of 200 ppm, the electrical energy production rate was greater than about 35.1 Wh/kg(Rh) as a byproduct. Discharging time lasted 40 hours for all concentrations tested.
Coulombic efficiency (CE%) could be calculated according to Eq. (10) with a sample. It was found to be about 49.6% for 500 ppm [PdCl4]2-, 37.4% for 500 ppm [PtCl6]2-, and 29.1% for 200 ppm [RhCl6]3+. Total volume was 224 mL, and the reaction time was 40 hours for 99% recovery rate. The Coulombic efficiency was in the order of Pd-MFC > Pt-MFC > Rh-MFC.
Pd-MFC seemed to have better discharging characteristics than Pt-MFC at 500 ppm because the discharging voltage was kept constant for 40 hours. At 200 ppm, Pd-MFC kept a voltage as high as 0.7 V with a load of 1000 Ω, compared to 0.5 V for Pt-MFC and 0.38 V for Rh-MFC. From 50 ppm to 100 ppm, the discharging voltage also kept higher for Pd-MFC than for the rest of MFCs (Figure 2). The electrical energy generation rate was in the order of Pd-MFC (39.2 Wh/kg) > Rh-MFC (35.1 Wh/kg) > Pt-MFC (17.2 Wh/kg).
Effects of initial PGM concentrations on PGM remaining concentrations (RC) and recovery efficiency (RE).
To study the effects of initial Pd2+ concentration on RC and RE, MFC reaction time is increased. The concentration of Pd2+ was increased from 50 ppm to 200 ppm (Figure 3A). The RC data were monitored by ICP-AES, and the RE was calculated with the equation given in Eq. (9). Fig. 3A shows that the REs increased correspondingly with time from 50 ppm to 100 ppm. However, at 200 ppm, the RE increased slightly slower with time. The results showed high REs; 99.6%, 99.7%, and 99.2% for initial concentrations of 50 ppm, 100 ppm, and 200 ppm, respectively, after 40 hours reaction. The remaining concentration of Pd2+ in the solution at the end of operational cycle slightly increased from 50 ppm to 200 ppm; 0.21 ± 0.01 ppm, 0.26 ± 0.00 ppm, and 1.68 ± 0.05 ppm for the same initial concentrations after 40 hours reaction time (Figure 3A). These RE and RC results represent that the MFC could remove Pd2+ efficiently, and further it could be accelerated by increasing the surface areas of anode and cathode. When the MFC operates, the anionic movement into the anode chamber would be inhibited, but cationic movement into the cathode chamber would occur ideally due to the installation of cationic membrane as a separator. Therefore, the cationic species could accumulate into the cathode chamber from the anode chamber by migration of cations as well as diffusion. The cationic species will be mostly K+, H+, NH4+, and Na+ ions, which are known as the composition of the anolyte in this study. Because only K+, H+, and [PdCl4]2- exist in the cathode chamber of the MFC, the cationic species cannot be adsorbing or precipitating species with [PdCl4]2- or Pd metals. The [PdCl4]2- consumption from the catholyte occurs only by way of reduction at the cathode. The quality Pd metal was obtained, and this will be discussed with SEM and EDS later on. Therefore, the calculation of REs performed using ICP-AES data, as given in Eq. (9), would be realistic. The MFC method was very promising for Pd recovery because of high recovery efficiency.
Figure 3. Recovery efficiency and remaining concentration of (A) Pd2+, (B) Pt4+, and (C) Rh3+ metals vs. time with different concentration from 50 ppm to 200 ppm in 0.2 M NaCl or 1.0 M KCl solution at pH 2. a, a’: 50 ppm; b, b’: 100 ppm; c, c’: 200 ppm. Data were measured in duplicate.
The concentration of Pt4+ as [Pt(IV)Cl6]2- was changed from 50 ppm to 200 ppm to study the concentration effects of Pt4+ on its recovery efficiency with time. The trend was similar to the Pd2+ remaining concentration and Pd recovery efficiency. Figure 3B shows that within 40 hours, the REs of Pt reached 99.9%, 99.5%, and 99.5% for the initial concentrations of 50 ppm, 100 ppm, and 200 ppm, respectively. The results generally represented a high recovery efficiency. The RC level of Pt4+ in the solution containing the high initial concentration of Pt4+ was also a little higher than in low initial concentrations in the 40-hour time interval-RCs at the initial concentrations of 50 ppm, 100 ppm, and 200 ppm were 0.10 ± 0.0 ppm, 1.23 ± 0.25 ppm, and 4.30 ± 0.61 ppm, respectively (Figure 3B). The initial Rh3+ as [Rh(III)Cl6-n(H2O)n]n-3 concentration was also varied from 50 ppm to 200 ppm to evaluate the effect of initial Rh3+ on Rh recovery efficiency (RE) and remaining concentration (RC) of Rh3+ for about 40 hours (Figure 3C). The trend was similar to the RCs of Pd2+ and Pt4+ and REs of Pd and Pt. As Rh3+ concentration was increased from 50 ppm to 100 ppm, the RE was increased from 97.8% to 99.2%. And with further increase to 200 ppm, the RE was slightly lowered to 98.7% in 40 h time interval. Additionally, RCs at the initial concentrations of 50 ppm, 100 ppm, and 200 ppm were 1.10 ± 0.02 ppm, 0.76 ± 0.02 ppm, and 2.54 ± 0.03 ppm, respectively. In conclusion, the MFC recovery systems could be utilized to recover PGMs because all PGMs were recovered at a high recovery efficiency (RE).
Surface analysis of cathodes deposited with PGMs
SEM micrographs of palladium (Pd), platinum (Pt), and rhodium (Rh) metals deposited on carbon cloths of the same area were given in Figure 4, where Pd, Pt, and Rh metal deposition time was 30 hours in 200 ppm solution. Typical Pd deposits were of compact crystalline continuous spots. Rh deposits were of smaller round-like layered shapes than the Pd deposits (Figure 4A and Figure 4C), while Pt deposits were of powdery particles (Figure 4B). “a” represents a SEM micrograph of the plain carbon cloth without any deposit with a magnification of 10000x. It is known that the deposition current is an expression of reaction rate through Faraday’s Law in an electrochemical reaction, and the morphologies of metal deposits would be influenced by the nucleation and growth rate of metal deposit. The surface morphology of Rh deposits was of smaller particles than Pd particles because its deposition current was lower than that of Pd deposition; Rh deposition also showed a lower power density production partially caused by the lower current, compared with Pd or Pt production. EDS analysis showed typical specific peaks for Pd, Pt, and Rh (Figure 5). Especially Pd, Pt, and Rh showed very strong peaks at energy levels of 2.9 keV, 2.2 keV, and 2.7 keV, clearly indicating metals were the main elements in the deposits, while there was no peak for the plain carbon cloth in this range (Figure 5D), showing that pure metal deposits were formed on the carbon cloth surface. However, Pt peak was weaker than Pd and Rh peaks, even though the peak showed a specific peak at an energy level of 2.2 keV. The reason for why the peak intensity is relatively weaker for EDS of Pt is not known.
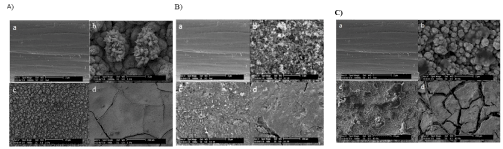
Figure 4. Scanning electron microscopy (SEM) micrographs of carbon cloth with deposition of Pd (A), Pt (B) and Rh (C) metals. Here “a” corresponds to the plain carbon cloth electrode surface with a magnification of 10000x for control, and b, c, and d correspond to Pd, Pt and Rh metal depositions on the electrodes for 30 hours in 200 ppm concentration solution with magnifications of 10000x, 1000x and 100x, respectively.
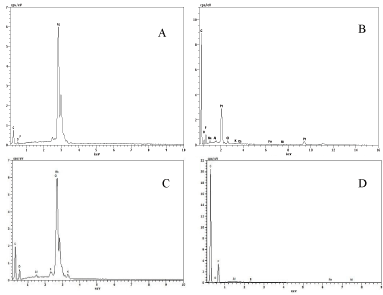
Figure 5. Energy dispersive X-ray (EDS) data of (A) Pd, (B) Pt, and (C) Rh metals deposited on carbon cloth electrodes under 10.0 kV, compared with the fresh carbon cloth cathode (D). The metals were deposited in the same concentration solution of 200 ppm for the same reaction time of 30 hours.
Based on the finding of this study, the two-chamber MFC system could be successfully applied to the recovery of PGMs from artificial wastewaters containing Pd2+, Pt4+, or Rh3+ with electrical power generated simultaneously. The power generated was found to be increased with an increase in PGM concentration. And with 1000 ppm initial Pd2+ concentration, the highest Pmax of 7.03 W/m2 with a fill factor of 0.638 was achieved from this study. The electrical energy generation rate was in the order of Pd-MFC (39.2 Wh/kg) > Rh-MFC (35.1 Wh/kg) > Pt-MFC (17.2 Wh/kg). After 40 hours reaction, the removal efficiency range of 98.7% ~ 99.5% was achieved for all PGMs with initial concentrations ranging from 50 ppm to 200 ppm. In future, higher Pmax can be expected from a system optimized with a large-scale reactor design.
This research work was funded by National Research Foundation (NRF), South Korea (UID-2016-02900001). We are grateful to Dr. Euree Choi for English correction and Mr. Janghoon Back for graphic correction of this paper.
- Kononova ON, Melnikov AM, Borisova TV, Krylov AS (2011) Simultaneous ion exchange recovery of platinum and rhodium from chloride solutions. Hydrometallurgy 105: 341-349.
- Nikoloski AN, Ang KL, Li D (2015) Recovery of platinum, palladium and rhodium from acidic chloride leach solution using ion exchange resins. Hydrometallurgy 152: 20-32.
- Bunge M, Søbjerg LS, Rotaru AE, Gauthier D, Lindhardt AT, et al. (2010) Formation of palladium (0) nanoparticles at microbial surfaces. Biotechnol Bioeng 107: 206-215. [Crossref]
- Kakarla R, Min B (2014) Photoautotrophic microalgae Scenedesmus obliquus attached on a cathode as oxygen producers for microbial fuel cell (MFC) operation. International journal of hydrogen energy 39: 10275-10283.
- Nancharaiah YV, Mohan SV, Lens PN (2015) Metals removal and recovery in bioelectrochemical systems: a review. Bioresour Technol 195: 102-114. [Crossref]
- Benguerel E, Demopoulos GP, Harris GB (1996) Speciation and separation of rhodium (III) from chloride solutions: a critical review. Hydrometallurgy 40: 135-152.
- Stephen WISIG, Ezerskaya NA, Prokofeva IV, Fedorenko NV, Shlenskaya VI (1975) Analytical chemistry of platinum metals: Halsted Press-Wiley, New York; pp: 673.
- Pletcher D, Urbina RI (1997) Electrodeposition of rhodium. Part 1. Chloride solutions. Journal of Electroanalytical Chemistry 421: 137-144.
- Aktas S (2011) Rhodium recovery from rhodium-containing waste rinsing water via cementation using zinc powder. Hydrometallurgy 106: 71-75.
- Doyle FM (2005) Teaching and learning environmental hydrometallurgy. Hydrometallurgy 79: 1-4.
- Habashi F (2005) A short history of hydrometallurgy. Hydrometallurgy 79: 15-22.
- Lee SS, Lee HM, Park MJ, An KS, Kim JK, et al. (2008) Synthesis of novel platinum precursor and its application to metal organic chemical vapor deposition of platinum thin films. Bull Korean Chem Soc 29: 1491-1494.
- Das N (2010) Recovery of precious metals through biosorption—a review. Hydrometallurgy 103: 180-189.
- Dobson RS, Burgess JE (2007) Biological treatment of precious metal refinery wastewater: A review. Minerals Engineering 20: 519-532.
- Choi C, Hu N (2013) The modeling of gold recovery from tetrachloroaurate wastewater using a microbial fuel cell. Bioresour Technol 133: 589-598.
- Liu Y, Song P, Gai R, Yan C, Jiao Y, et al. (2019) Recovering platinum from wastewater by charring biofilm of microbial fuel cells (MFCs). Journal of Saudi Chemical Society 23: 338-345.
- Li F, Jin C, Choi C, Lim B (2019) Simultaneous Removal and/or Recovery of Cr (Vi) and Cr (Iii) Using A Double Mfc Technique. Environmental Engineering & Management Journal (EEMJ) 18.
- Yang Y, Choi C, Xie G, Park JD, Ke S, et al. (2019) Electron transfer interpretation of the biofilm-coated anode of a microbial fuel cell and the cathode modification effects on its power. Bioelectrochemistry 127: 94-103.
- Wang Z, Lim BS, Lu H, Fan J, Choi CS (2010) Cathodic reduction of Cu 2+ and electric power generation using a microbial fuel cell. Bull Korean Chem Soc 31: 2025-2030.
- Cai H, Wang J, Bu Y, Zhong Q (2013) Treatment of carbon cloth anodes for improving power generation in a dual‐chamber microbial fuel cell. Journal of Chemical Technology & Biotechnology 88: 623-628.
- Kakarla R, Min B (2014) Evaluation of microbial fuel cell operation using algae as an oxygen supplier: carbon paper cathode vs. carbon brush cathode. Bioprocess Biosyst Eng 37: 2453-2461. [Crossref]
- Choi C, Cui Y (2012) Recovery of silver from wastewater coupled with power generation using a microbial fuel cell. Bioresour Technol 107: 522-525. [Crossref]
- Wang Z, Lim B, Choi C (2011) Removal of Hg2+ as an electron acceptor coupled with power generation using a microbial fuel cell. Bioresour Technol 102: 6304-6307. [Crossref]
- Rabaey K, Boon N, Siciliano SD, Verhaege M, Verstraete W (2004) Biofuel cells select for microbial consortia that self-mediate electron transfer. Appl Environ Microbiol 70: 5373-5382. [Crossref]
- Logan B, Cheng S, Watson V, Estadt G (2007) Graphite fiber brush anodes for increased power production in air-cathode microbial fuel cells. Environ Sci Technol 41: 3341-3346. [Crossref]
- Garrido P, Gómez E, Vallés E (1998) Simultaneous electrodeposition and detection of platinum on silicon surfaces. Journal of Electroanalytical Chemistry 441: 147-151.
- Chen SM, Li SH, Thangamuthu R (2009) Electrochemical Preparation, Characterization, and Electrocatalytic Properties of OsPtCl6 Film Electrodes Towards Reduction of NAD+, Chloroacetic Acids, and Nitrous Oxide. Electroanalysis: An International Journal Devoted to Fundamental and Practical Aspects of Electroanalysis 21: 1505-1513.
- Vincent CA, Bonino F, Lazzari M, Scrosati B (1984) Modern batteries; An introduction to electrochemical power sources, Edward Arnold Ltd.