Abstract
Japan enjoys the highest life expectancy at birth among OECD member countries, but Japanese elderly face the risk of long-term care (LTC) needs and high dementia prevalence. After reviewing the prevalence of dementia among elderly people in developed countries, we estimated the number of Japanese elderly living with dementia for the period of 2020-2070, using the results of the projection of the elderly by dependency level obtained from the INAHSIM 2018 simulation. We discussed the importance of reducing the prevalence of dementia among the elderly population, which is both necessary and possible.
Keywords
dependency level of the elderly, prevalence of long-term care, prevalence of dementia, population-household projection
Introduction
Japan enjoys the highest life expectancy at birth among OECD member countries. Healthy lifestyles, as well as good access to healthcare services, are expected to contribute to extending life expectancy further in the future. Given the long life expectancy, the Japanese healthy life expectancy is also long. However, Japanese elderly face the risk of long-term care (LTC) needs and high dementia prevalence. According to the OECD, Japan has the highest dementia prevalence (2.3% of the population) among OECD countries in 2017, and is projected to reach 3.8% by 2037 [1].
Japan has the lowest obesity rates and relatively low alcohol consumption rates among the OECD countries [2]. Japanese healthcare systems offer universal coverage with relatively low rates of cost-sharing. All these factors contribute to the highest life expectancy. Health spending as a share of GDP is 10.7% in Japan [2], and Japan has a high number of beds per capita, often occupied by elderly patients in need of long-term care [1].
Japanese LTC Insurance has been implemented since April 2000. The main beneficiaries of the Japanese LTC Insurance are the elderly aged 65 or over, and elderly assessed with the lowest care needs have been moved to a preventive scheme since 2006 [3]. The health care and long-term care systems could be better coordinated and managed to promote more efficient and effective services [1]. People in Japan are more likely to spend the night in hospitals than in any other country, partly because people who could be cared for at home nevertheless end up in hospitals [1]. A large share of long-term care is still provided in hospitals compared to other OECD countries (11% of hospital spending compared to an OECD average of 4%) [1]. Furthermore, the average length of hospital stays in Japan is still one of the highest among OECD countries, despite significant efforts having been made for many years in reducing it.
Dementia is a growing, global challenge. As the population ages, it has become one of the most important health and care issues facing the world. The UK adopted a national strategy on dementia care in 2009, and hosted the dementia summit meeting of Group of Eight nations in December 2013. Japan’s first national strategy on dementia, Orange Plan (2013-2017), was formulated by the Ministry of Health, Labor, and Welfare. But a revised version of the New Orange Plan (2015-2025) was adopted under the leadership of the Prime Minister, involving many governmental organizations. The new strategy calls for increased professional and nonprofessional support across the country for dementia sufferers and their families, making it easier for individuals with dementia to receive care in their own communities. In the preamble of this strategy, it was stated that 4.6 million elderly people aged 65 or over were estimated to live with dementia in Japan in 2012, and the number would increase to 7 million in 2025 as the country’s postwar baby boomers get older.
In this paper, the prevalence of dementia among elderly people by age group is reviewed for developed countries in Section 2. The present situation and future prospects concerning the number of Japanese elderly living with dementia are estimated in Section 3. Projection is done using the INAHSIM 2018 simulation results. In section 4, based on an international comparison on the prevalence of dementia, we discussed the challenge Japan is facing with its population ageing.
Prevalence of dementia among elderly people
Today, 47 million people live with dementia worldwide, and the number is projected to increase to more than 131 million by 2050, as populations age [4]. For all studies combined, the incidence of dementia doubled with every 5.9-year increase in age, from 3.1 per 1000 person-years at age 60-64 to 175.0 per 1000 person-years at age 95+ [5]. Worldwide, 7.7 million new cases of dementia were anticipated each year, and for the year 2010, prevalence (35.6 million cases) is 4.6 times annual incidence, suggesting an approximate average survival from the onset of dementia till death of 4.6 years [5]. Nearly two-thirds of people with dementia are women, and dementia is a leading cause of death among women – higher than heart attack or stroke [6].
Table 1 shows the prevalence of dementia among the elderly aged 65 or over in 6 countries, with a reference to the prevalence of their LTC needs. Except for France, about 7 to 9 percent of the elderly live with dementia [7-9], which comprises more than half of the prevalence of LTC. There exist public LTC insurance in Germany, and the percentage of German elderly who receive LTC services was 13.9% in 2015 [10]. The prevalence of LTC in France and the US in Table 1 might be underestimated. The primary types of long-term support and services in the US are institutional care (nursing homes, intermediate care facilities for individuals with developmental disabilities, and mental health facilities), assisted living/residential care, adult day services (center-based), and home care, and in 2014 about 7 million people ages 65 or older needed assistance to perform everyday activities [11], composing about 15% of the elderly.
Table 1. Prevalence rate of the elderly (65+) on LTC and dementia in 6 countries.
| |
|
|
|
|
|
|
(in %) |
|
France |
Germany |
Japan |
Sweden |
UK |
USA |
LTC recipients, 2016 a in institutions (other than hospitals) at home |
10.1 |
13.6 |
11.8-15.2 |
b |
15.4 |
|
9.9 |
4.1 |
4.1 |
2.7 |
a |
4.5 |
|
2.4 |
6.0 |
9.5 |
|
|
10.9 |
|
7.5 |
Prevalence of dementia |
10.0 |
9.0 |
6.0-9.0 |
|
9.3 |
7.1 |
8.8 |
Year |
2012 |
2012 |
2015 |
|
2012 |
2012 |
2012 |
Source |
c |
c |
Table 2 |
|
c |
d |
e |
Note: : a [2], b from Table 2, c [7], d [8], e [9].
Typical examples of the prevalence of dementia by age group are shown in Figure 1 [1,8,12]. The Japanese result explained in 3.1 is also shown in this figure, for the sake of convenience. The prevalence rate for age group 85-89 is about 20%, and the rate increases rapidly beyond 90 years old. The elderly aged 65 years or over as a whole, the prevalence rate is 8.0% for Japan (Table 2) and 7.1% for the UK [8].
Table 2. Prevalence of LTC and dementia of the elderly by age group: 2015. a [14].
| |
Population by dependency (million) a |
LTC (%) |
Prevalence of dementia (%) |
| |
Total |
L0 |
L1 |
L2 |
L3 |
Total |
Prime |
Low |
Middle |
High |
65+ |
33.5 |
18.0 |
11.5 |
2.7 |
1.2 |
15.2 |
11.8 |
6.0 |
8.0 |
9.0 |
65-69 |
9.6 |
6.4 |
3.1 |
0.1 |
0.0 |
2.3 |
1.7 |
0.9 |
1.2 |
1.3 |
70-74 |
7.7 |
4.6 |
2.8 |
0.2 |
0.1 |
4.8 |
3.6 |
1.8 |
2.4 |
2.7 |
75-79 |
6.3 |
3.3 |
2.5 |
0.4 |
0.1 |
10.7 |
7.8 |
3.9 |
5.2 |
5.9 |
80-84 |
5.0 |
2.3 |
1.8 |
0.6 |
0.2 |
23.9 |
17.4 |
8.6 |
11.6 |
13.1 |
85-89 |
3.1 |
1.1 |
1.0 |
0.8 |
0.3 |
44.1 |
34.1 |
17.1 |
22.9 |
25.8 |
90-94 |
1.3 |
0.3 |
0.3 |
0.5 |
0.3 |
66.3 |
56.3 |
29.2 |
38.6 |
43.2 |
95+ |
0.4 |
0.0 |
0.0 |
0.2 |
0.2 |
84.7 |
78.7 |
44.1 |
56.2 |
62.3 |
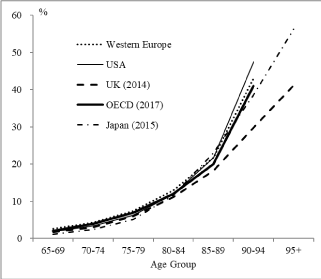
Figure 1. Prevalence of dementia by age group. Source: Western Europe and US from Prince et al. (2013), UK from Alzheimer’s society (2014), Japan from table 2 (middle scenario).
OECD (2017) estimated the number of the elderly with dementia for each member country by using the same prevalence rate by age group [1]. Therefore, the prevalence of dementia per 1000 population is closely related to the aging rate of each country as seen in Figure 2. It is also suggested from this figure that aging of the elderly population will bring the Japanese dementia prevalence on the regression line in the future.
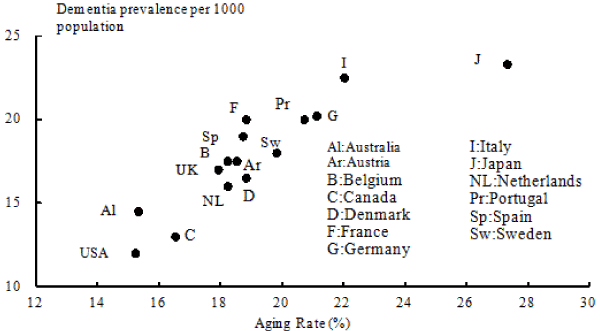
Figure 2. Aging rate (2016) and prevalence of dementia per 1000 population (2017) in 15 countries. Source: OECD Health statistics 2017 and OECD Health at a Glance 2017.
Number of the elderly living with dementia in Japan: Now and in Future
Prevalence of dementia in 2015
(1) Dependency level of the elderly
The dependency of the elderly aged 65 or over is classified into 5 levels as follows [13]:
Level 0: No disability and completely independent;
Level 1: Some disability but basically independent;
Level 2: Slightly or moderately dependent; and
Level 3: Heavily dependent.
Level 4: Death
Levels 2 and 3 correspond to persons eligible for the Japanese LTC Insurance, and Level 3 corresponds to care need assessments 4 and 5 in particular.
(2) Prevalence of dementia in 2015
Table 2 shows the distribution of the elderly aged 65 or over according to dependency level and age group [14] as well as prevalence of LTC and dementia by age group in 2015. In the Japanese LTC Insurance, care need assessment ranges from cautious levels to care need levels 1 to 5. Those elderly who are assigned as cautious levels receive preventive care services instead of prime LTC services. Concerning to the prevalence of LTC, we use two rates: Total and Prime. Total LTC includes cautious levels, and Prime LTC means care needs levels 1 to 5, excluding cautious levels. The prevalence of Prime LTC increased from 1.7% at age group 65-69 through 34.1% at age group 85-89 to 78.7% at age group 95+ in 2015.
Estimating the prevalence of dementia, we assumed the following three scenarios:
-Low scenario: 40% of L2 population and 75% of L3 population are with dementia;
-Middle scenario: 60% of L2 population and 85% of L3 population are with dementia; and
-High scenario: 70% of L2 population and 90% of L3 population are with dementia.
Resulting prevalence of dementia by age group is also shown in Table 2. The elderly as a whole, the prevalence of dementia in 2015 was 6.0% in the Low scenario, 8.0% in the Middle scenario and 9.0% in the High scenario. The prevalence of dementia by age group in 2015 (Middle scenario) is shown in Figure 1.
Figure 3 shows the prevalence of LTC and dementia of the elderly by sex and age group in 2015. Female elderly are more likely to use LTC services and to live with dementia than males, but the pattern of prevalence with age is quite similar between males and females.
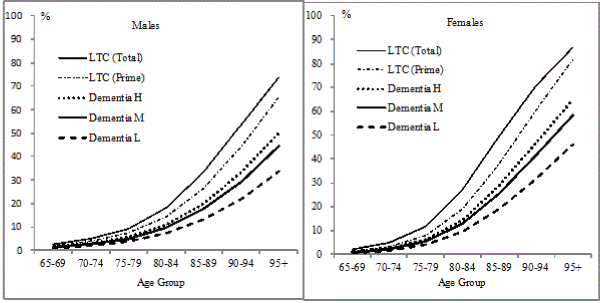
Figure 3. Prevalence of LTC and dementia of the elderly by sex and age group: 2015.
Projection
The distribution of the elderly aged 65 or over according to dependency level and age group in future years are obtained from the INAHSIM 2018. A detailed explanation of the INAHSIM model is found in Fukawa (2010) [13], and a summary of the INAHSIM 2018 Simulation is found in Fukawa (2018a) [15].
Projection results of the elderly by dependency level as well as the prevalence of LTC from 2020 to 2070 are shown in Table 3. The number of the elderly aged 65 or over will increase from 33.5 million in 2015 to 37.3 million in 2040, then decrease afterwards. However, the number of the elderly in dependency level 3 will continue increasing from 1.2 million in 2015 to 3.0 million in 2070, and the proportion of those in dependency level 3 will increase from 3.6% in 2015 to 9.8% in 2070.
Table 3. Population by dependency and prevalence of LTC of the elderly (65+): 2020-2070. (Note) Values in 2015 above the dotted line are based on Fukawa [14].
Year |
Population by dependency (million) |
LTC |
Proportion (%) |
Total |
L0 |
L1 |
L2 |
L3 |
million |
L0 |
L1 |
L2 |
L3 |
LTC |
2015 |
33.5 |
18.0 |
11.5 |
2.7 |
1.2 |
3.9 |
53.9 |
34.3 |
8.2 |
3.6 |
11.8 |
2020 |
35.6 |
18.8 |
11.9 |
3.5 |
1.4 |
4.9 |
52.7 |
33.4 |
9.8 |
4.0 |
13.9 |
2030 |
36.2 |
18.3 |
12.0 |
4.0 |
1.9 |
5.9 |
50.6 |
33.2 |
11.1 |
5.1 |
16.2 |
2040 |
37.3 |
18.5 |
12.3 |
4.5 |
2.1 |
6.5 |
49.6 |
33.0 |
11.9 |
5.5 |
17.5 |
2050 |
37.0 |
17.7 |
12.4 |
4.7 |
2.2 |
6.9 |
47.8 |
33.6 |
12.6 |
6.0 |
18.6 |
2060 |
34.1 |
15.3 |
11.2 |
4.8 |
2.8 |
7.5 |
45.0 |
33.0 |
14.0 |
8.1 |
22.1 |
2070 |
30.8 |
13.4 |
9.9 |
4.5 |
3.0 |
7.5 |
43.5 |
32.1 |
14.6 |
9.8 |
24.4 |
Concerning to the prevalence of LTC, we focus on Prime LTC in Table 3, because those elderly in cautious levels represent 16% in terms of the number of LTC recipients but represent less than 5% in terms of LTC expenditure [16]. Those elderly with dependency levels 2 and 3 are the LTC users, and the number will increase from 3.9 million in 2015 to 7.5 million in 2060. The proportion of those elderly who are the LTC recipients will increase from 11.8% in 2015 to 24.4% in 2070.
Table 4 shows the prevalence of dementia among Japanese elderly in 2020-2070 under three different scenarios. The number of the elderly aged 65 or over with dementia will increase from 3.3 million in 2020 to 5.3 million in 2070 under the Middle scenario. Under the Middle scenario, the prevalence of dementia for the elderly aged 65 or over will increase from 9.3% in 2020 to 17.1% in 2070, but the prevalence for the elderly aged 85 or over will increase from 28.1% in 2020 to 37.9% in 2070.
Table 4. Prevalence of dementia by 3 scenarios in Japan: 2020-2070.
|
Number in million |
Prevalence in percent |
Year |
65+ |
85+ |
65+ |
85+ |
L |
M |
H |
L |
M |
H |
L |
M |
H |
L |
M |
H |
2020 |
2.5 |
3.3 |
3.7 |
1.3 |
1.6 |
1.8 |
7.0 |
9.3 |
10.5 |
21.4 |
28.1 |
31.5 |
2030 |
3.0 |
4.0 |
4.5 |
1.7 |
2.2 |
2.4 |
8.3 |
11.0 |
12.4 |
22.8 |
29.7 |
33.2 |
2040 |
3.3 |
4.4 |
5.0 |
2.1 |
2.8 |
3.1 |
8.9 |
11.9 |
13.3 |
23.7 |
31.0 |
34.7 |
2050 |
3.5 |
4.7 |
5.3 |
2.2 |
2.8 |
3.1 |
9.5 |
12.7 |
14.2 |
25.3 |
32.8 |
36.6 |
2060 |
4.0 |
5.2 |
5.8 |
2.7 |
3.5 |
3.9 |
11.6 |
15.3 |
17.1 |
26.8 |
34.5 |
38.3 |
2070 |
4.1 |
5.3 |
5.9 |
3.0 |
3.8 |
4.3 |
13.2 |
17.1 |
19.0 |
29.7 |
37.9 |
42.0 |
Figure 4 shows the number of the elderly with dementia in Japan in 2020-2070. Under the Middle scenario, the number of the elderly aged 65 or over living with dementia will increase from 3.3 million in 2020 to 5.3 million in 2070, and the number of the elderly aged 85 or over living with dementia will increase from 1.6 million in 2020 to 3.8 million in 2070. It is inevitable that the number of the elderly with dementia will increase in future, but if we can reduce the incidence of dementia, then the social pressure caused by dementia will be mitigated remarkably.

Figure 4. Number of the elderly (65+) with dementia in japan: 2020 -2070.
Discussions
Estimating the prevalence of dementia in Japan has been always an upwards operation. However, what is stated in the Japanese new strategy may seem to be an apparently overestimation. The number of the elderly with dementia is increasing globally, but recent studies suggest that age-specific incidence or prevalence of dementia has been decreasing in the UK, Sweden, the Netherlands, France, USA, and Canada [17]. The future scale of the dementia epidemic may be blunted through improvements in population health; our best current estimates suggest that around 10-20% of incidence may be avoided [5]. Viewing several international studies, the age-specific prevalence of dementia is gaining consensus within certain ranges as seen in Figure 1. There is no reason so far to believe that Japanese elderly are more likely to develop dementia. In this paper, the number of the Japanese elderly with dementia has been estimated for 2020-2070 using the INAHSIM 2018 projection results of the elderly by dependency level, and resulting prevalence rates by age group in future years differed slightly from 2015 data, but only slightly. Therefore, it is almost safe to say that assuming the prevalence of dementia in 2015, the number of the Japanese elderly aged 65 or over living with dementia will increase from 2.7 million (8.0% of the elderly) in 2015 to 5.3 million (17.1%) in 2070.
Advanced dementia can be very difficult for the individual and their family and it is not always possible at this late stage of the condition to “live well”, but there is a great deal that can be done to help people with dementia at the earlier stages [6]. If diagnosed in a timely manner, people with dementia and their caretakers can receive the treatment, care and support (social, emotional and psychological, as well as pharmacological) to enable them to better manage the condition and its impact [6].
Weighing the available evidence for diagnosis in dementia in a series of systematic reviews, the 2011 World Alzheimer Report concluded that there was value for people with dementia themselves, their caretakers, and society as a whole in clinical and economic terms on the basis of the optimization of medical management; the relief gained from better understanding of symptoms; maximizing decision-making autonomy; access to services; risk reduction; planning for the future; improving clinical outcomes; avoiding or reducing future costs; and diagnosis as a human right [18]. Research data presents evidence of a sustained change for the better in dementia diagnosis and treatment and support the development and delivery of policies to improve care for people with dementia [18].
Dementia is not curable currently, but medicines and other interventions can lessen symptoms. Medicines to cure Alzheimer diseases are undertaken in developed countries, and there is evidence that the prevalence of dementia can be lowered by reducing risk factors and living a healthier lifestyle. It is possible that substantial reduction in dementia risk for whole populations can balance out growing numbers of older people, and reduction in absolute inequalities including improvement in living conditions, better access to education and healthcare systems are likely to have influenced multiple risk and protective factors across the life-course related to physical, mental and cognitive health, and thus reducing risk of dementia in later life [19].
All current projections of the scale of the coming dementia epidemic assume that the age- and gender-specific prevalence of dementia will not vary over time, and that the increasing number of older people at risk drives the projected increases [5]. However, the basis for this assumption is uncertain. A decline in age-specific incidence is theoretically possible, driven by changes in exposure to suspected developmental, lifestyle and cardiovascular risk factors for dementia. The strongest evidence for possible causal associations with dementia (plausible, consistent, strong associations, relatively free of bias and confounding) are those of low education in early life, hypertension in midlife, and smoking and diabetes across the life course [5]. A 10% reduction of key risk exposures would lead to an 8.3% reduction in the prevalence of dementia through to 2050, with a 15.3% reduction in the prevalence of dementia anticipated assuming a 20% reduction in exposure prevalence [20].
The main objectives of the Finnish Geriatric Intervention Study to Prevent Cognitive Impairment and Disability (FINGER) study is to find out if a multi-domain intervention could prevent cognitive decline among older people, and to investigate the effect of the multi-domain intervention on disability, quality of life, depressive symptoms, the use of health care services and vascular risk factors [21]. Evidence from longitudinal population-based studies indicates that many vascular risk factors (for example high blood pressure, high cholesterol, diabetes, and obesity) increase the risk for memory decline and dementia, and high education, physical activity, active lifestyles and healthy diets are linked to a lower risk of dementia [21]. The Lancet Commission on Dementia Prevention, Intervention, and Care suggested that as the following nine factors accounted for 35% of the population dementia risk, a third of dementia cases would be potentially preventable: education (early life), hearing loss, hypertension, and obesity (mid-life), smoking, depression, physical inactivity, social isolation, and diabetes (late life) [22].
Japan has the highest share of elderly people in the population now, and Japanese future aging rate will be very high, never anticipated in any other developed country. The challenge of dealing with age-related diseases such as dementia is, therefore, more acute in Japan than in many other countries. The Japanese Government has been taking an integrated approach to build a community which is sensitive to the needs of people with chronic conditions such as dementia, as well as their families. The strategy aims to improve coordination of care at the community level among medical care, long-term care, and social services; promote public awareness and disease prevention; and create a safe and healthy living environment for the elderly [1]. According to our simulation, the number of the elderly living with dementia will be reduced by 30% in Japan, if the Low scenario instead of the High scenario will be realized. It is essential to lower the prevalence of dementia by reducing risk factors and living a healthier lifestyle, as well as by developing medicines and other interventions which lessen symptoms of dementia.
Conclusions
By using widely agreed age-specific prevalence of dementia, we estimated the number of the Japanese elderly aged 65 or over living with dementia. It will increase from 2.7 million (8.0% of the elderly) in 2015 to 5.3 million (17.1%) in 2070 in the Middle scenario. Evidence has been accumulated to supporting the claim that the prevalence of dementia can be lowered by reducing risk factors and living a healthier lifestyle. Public health and disease control measures targeting smoking, under-activity, obesity, hypertension, and diabetes are considered effective to lower the prevalence of dementia. According to our simulation, the number of the elderly living with dementia will be reduced by 30% in Japan, if the Low scenario instead of the High scenario will be realized.
References
- Campos L1 (2018) A Perspective on the OECD Report "Health at a Glance 2017. Acta Med Port 31: 9-11. [Crossref]
- OECD (2018) Health Statistics 2018.
- Fukawa T (2017a) Elderly Population Projection and Their Health Expenditure Prospects in Japan. Modern Economy 8: 1258-1271.
- O'Donnell MJ, Chin SL, Rangarajan S, Xavier D, Liu L, et al. (2016) Global and regional effects of potentially modifiable risk factors associated with acute stroke in 32 countries (INTERSTROKE): a case-control study. Lancet 388: 761-775. [Crossref]
- WHO (2015) The Epidemiology and Impact of Dementia: Current state and future trends. Word Health organization.
- Department of Health (2015) Prime Minister’s challenge on dementia 2020.
- Alzheimer Europe (2013) Dementia in Europe Yearbooks.
- Alzheimer’s Society (2014) Dementia UK update.
- Langa KM, Larson EB, Crimmins EM, Faul JD, Levine DA, et al. (2017) A Comparison of the Prevalence of Dementia in the United States in 2000 and 2012. JAMA Intern Med 177: 51-58. [Crossref]
- Statistisches Bundesamt (2017) Statistisches Jahrbuch. D Statis.
- Nguyen V (2017) Long-Term Support and Services, Fact Sheet, AARP Public Policy Institute.
- Prince M, Bryce R, Albanese E, Wimo A, Ribeiro W, et al. (2013) The global prevalence of dementia: a systematic review and metaanalysis. Alzheimers Dement 9: 63-75. [Crossref]
- Fukawa T (2010) Household Projection and Its Application to Health/Long-term Care Expenditures in Japan Using INAHSIM-II. Social Science Computer Review 29: 52-66.
- Fukawa T (2017b) Dependency of the elderly and expectation of independent living at birth in Japan. Health and Primary Care 1: 1-6.
- Fukawa T (2018a) Projection of Living Arrangements of the elderly in Japan Using INAHSIM. Studies in Asian Social Science 5: 2.
- Fukawa T (2018b) Recipients of LTC services among the elderly in Japan and Germany. IFW DP Series 2018-1.
- Orgeta V, Mukadam N, Sommerland A, Livingston G (2018) The Lancet Commission on Dementia Prevention, Intervention, and Care: a call for action. Irish Journal of Psychological Medicine.
- Donegan K, Fox N, Black N, Livingston G, Banerjee S, et al. (2017) Trends in diagnosis and treatment for people with dementia in the UK from 2005 to 2015: a longitudinal retrospective cohort study. Lancet Public Health 2: e149-e156.
- Wu YT, Beiser AS, Breteler MMB, Fratiglioni L, Helmer C, et al. (2017) The changing prevalence and incidence of dementia over time - current evidence. Nat Rev Neurol 13: 327-339. [Crossref]
- Norton S, Matthews FE, Barnes DE, Yaffe K, Brayne C (2014) Potential for primary prevention of Alzheimer's disease: an analysis of population-based data. Lancet Neurol 13: 788-794. [Crossref]
- Ngandu T, Lehtisalo J (2015) A 2 year multidomain intervention of diet, exercise, cognitive training, and vascular risk monitoring versus control to prevent cognitive decline in at-risk elderly people (FINGER): a randomized controlled trial. The Lancet 385: 2255-2263.
- Soininen H, Solomon A, Visser PJ, Hendrix SB, Blennow K, et al. (2017) 24-month intervention with a specific multinutrient in people with prodromal Alzheimer's disease (LipiDiDiet): a randomised, double-blind, controlled trial. Lancet Neurol 16: 965-975. [Crossref]