Background: Childhood hyperglycaemia is a critical observation because of its links to complications ranging from prolonged hospitalisation to mortality. This study reports the prevalence, clinical patterns and factors associated with hyperglycaemia among children under-five years of age at Holy Innocents Childrens’ Hospital (HICH), Mbarara in south-western Uganda.
Materials and methods: This was a hospital based, cross-sectional study conducted during the period between April to July, 2017. The study enrolled children under-five years attending out patients department (OPD) whose caregivers had consented. Random blood glucose levels, height and weight of children were taken; in addition, a structured questionnaire was administered.
Results: We enrolled 284 children, of whom, 40.3% (n=114) were aged between 12 to 23 months (mean age: 24.6 months, median age: 9.7 months; IQR: 5.8–46.8 months). There were 124 boys (43.7%). Thirty-nine participants were hyperglycaemic, giving a prevalence of 13.7%, (95% Confidence Interval: 8.4-18.2), with varied clinical patterns. Obese children were six times more likely to be hyperglycaemic (P=0.000). Although those who were overweight did not show statistical significance of hyperglycaemia, they were four times more at risk.
Conclusion: Childhood hyperglycemia is highly prevalent in this setting, with the majority of the affected cases being unknown to both health workers and the caregivers. This impedes their medical intervention, and also inclines to very poor glycaemic control. This compels the need to regularly monitor glucose levels to subside preventable deaths.
Hyperglycemia, Random blood glucose, Uganda Abbreviations: AOR- Adjusted odds ratio, BMI- Body mass index, CI- Confidence interval
Hyperglycemia is an endocrine and metabolic disorder characterized by raised blood glucose levels [1,2]. It presents as type 1 diabetes mellitus (T1DM) that is due to an absolute insulin deficiency, or type 2 diabetes mellitus (T2DM) that occurs secondary to obesity [3,4]. Although it is rarely diagnosed, hyperglycemia among children under-five years is associated with both acute and long-term complications which worsens its prognosis [5]. While most of research in Uganda has focused on the burden of communicable and infectious diseases, there is irresistible evidence that non-communicable diseases including diabetes and obesity are increasing. This is in part ascribed to a generation paradigm shift characterized by unhealthier life-style [6], which augments childhood hyperglycemia. Other associated factors are linked to childhood nutrition, Apgar score, birth weight, glycemic control, gender, nature and severity of the illness [7-10]. The burden of childhood hyperglycemia varies in different African countries, for example it is reported at 4.4/100,000 in Algeria, 20/100,000 in Morocco, 10.3/100,000 in Sudan and 1.5/100,000 in Tanzania [11,12]. Presently, childhood obesity is a rising nutrition health concern in sub-Saharan Africa and is seen as an independent predictor of childhood hyperglycemia [12]. Obesity is defined as having an excess of body weight due to a chronic caloric imbalance as measured by body mass index (BMI). This is set as a child’s z-score based on weight and height in reference to the 95 percentile of age and gender.
In Uganda, childhood hyperglycemia is under-diagnosed, and even then, there is a high risk of late diagnosis due to lack of regular monitoring coupled with inequalities in accessing care. This leads to very poor glycemic control whichpotentiates a high risk ofearly presentation of diabetic complications including prolonged hospitalization, chronic diabetes and eventual mortality. This study reports on the prevalence, clinical patterns and factors associated with hyperglycaemia among children under-five years of age at HICH, Mbarara in south-western Uganda.
Study design, duration and setting
This was a hospital based, cross-sectional study that was conducted between April and July 2017. It was carried out from the OPD at Holy Innocent Childrens Hospital (HICH) located in Nyamitanga ward, in Mbarara Municipality, south-western Uganda. Founded in 2009, HICH is a private, not-for-profit faith-based funded paediatric hospital under the Roman Catholic Archdiocese of Mbarara that serves a mixed population of both a semi-urban for the urban dwellers and rural subsistence farmers who are referred from peripheral health facilities in the region, and some parts of South-western Tanzania. Its outpatient clinics (OPD) serve about 100 children daily, while the in-patient department admits 2500 children under age of fifteen years annually.
Study population and recruitment criteria
We enrolled children under-five years of age seeking medical care at the OPD of HICH, and with clinical suspicion of blood glucose associated disorder and unknown to a caregiver. Participants were recruited into the study if they were not in comma, unconscious, not on insulin or low doses of dopamine therapy and their care givers had consented.
Sample size estimation, sampling and data collection techniques
We used Kish and Leslie formula (1965), given as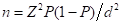 ; where n is the desired sample size, Z is the normal distribution at 95%, P is the proportion of hyperglycaemia among the under-five age category (20% as of HICH records, 2016), (1-P) is the proportion of without hyperglycaemia and d is the allowable error set at 5%.
On substitution, 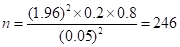 children.
Participants were sequentially enrolled until the required sample size was attained. Laboratory random glucose levels were assayed, as well as anthropometric measures (weight and height). Weights of children to the nearest 0.1 Kilogram (Kg) were taken while in light clothing using a portable digital scale calibrated to the nearest zero. In instances where the child was unable to stand, the caregiver was told to stand on the weighing scale, his or her measurement was taken first then both the child and caregiver were weighed. To obtain the weight of the child, the weight of the caregiver was subtracted from the measurement of both child and the caregiver. Their height to the nearest 0.1 centimeter (cm) was obtained using a calibrated, fixed base portable wooden scale measurement. These were done twice, and their mean values were used for analysis. Children who were less than 2 years or less than 87 cm were measured while lying down. The research assistant held the child’s body (head and legs) in the appropriate position to ensure accuracy. A questionnaire was used to collect the socio-demographic characteristics of each consenting participant in a language preferred by the participant. The body mass index (BMI) was used to classify obesity [13], and was based on the percentiles as given by the expert committee recommendations in which; underweight was for children less than the 5th percentile, normal or healthy for those with a 5th percentile to less than the 85th percentile, overweight was considered for those with 85th to less than the 95th percentile, while obesity was considered for those equal to or greater than the 95th percentile [14,15].
Specimen collection and laboratory analyses
Blood sample was obtained from a heel or finger prick after careful disinfection with sterile cotton immersed in 70% ethanol. The first blood drop was wiped off, and the subsequent was allowed to enter the test strip by capillary action. The strip was placed into the portable glucometer for determination of glucose concentration, and results were displayed on a digital screen and recorded to the nearest 0.1mmol/L. Hyperglycaemia was considered for random blood glucose values >126mg/dL (7.0mmol/L). It was classified into mild hyperglycaemia (126-160mg/dL/7.0-9.0mmol/L), moderate hyperglycaemia (161-200mg/dL/9.0-11.0mmol/L) and severe hyperglycaemia (>200mg/dL/11.0mmol/L) [16]. To ensure the reliability, controls were run daily and results suggestive of hyperglycaemia were confirmed using the automated COBAS C111 analyser (Roche Diagnostics International Ltd, Rotkreuz, Switzerland).
Data analysis
Data was entered using EPI INFO, cleaned and analyzed using SPSS (version 17.0). The prevalence of hyperglycaemia was determined as a proportion of those with elevated blood glucose levels compared to the total participants. Pattern of hyperglycaemia were determined using reference levels of mild, moderate and severe categories. Logistic regression was used to explore the associated factors, and the association was determined using odds ratio.
Ethical consideration
Ethical approval was obtained from the research and ethics committee of Clarke International University (Formerly, International Health Sciences University). The approved protocol was also reviewed and cleared by the Faculty of Medicine research and ethics committee of Mbarara University of Science and Technology. Permission to conduct the study was obtained from the hospital director, and written consent to participate in the study was sought from participants’ guardian/caregivers.
We enrolled 284 children; of these, 124 (43.7%) were boys. There were 54 (19.0%) children aged ≤11 months. Majority of the children were in the category of 12 to 23 months (40.3%, n=114). Participants’ mean age was 24.6 months with a standard deviation of +11.7 (median age: 9.7 months; IQR: 5.8-46.8 months). The socio-demographic characteristics are presented in the Table 1.
Table 1. Socio-demographic features of study participants.
Variable |
Frequency (n=) |
Percentage (%) |
Gender Male Female |
124 160 |
43.7 56.3 |
Age (Months) ≤11 12 to 23 24 to 35 36 to 47 48 to 59 |
54 114 28 27 61 |
19.0 40.3 9.9 9.5 21.5 |
Guardian’s education level None Primary level Secondary level Post-secondary Knew about the child’s glycaemia status No Yes |
87 138 54 5 284 0 |
30.6 48.6 19.0 1.8 100.0 0 |
Hyperglycaemia was found in 39 (13.7%, 95% Confidence Interval: 8.4-18.2). Among the hyperglycaemic participants, random glucose levels (mmol/L) and body mass index (BMI, Kg/m2) were determined as given in Table 2.
Table 2. Pattern of hyperglycaemia among study participants.
Variable |
Frequency, n= |
Percentage, % |
Random blood glucose levels Mild hyperglycaemia (110-160mg/dL/ 6.0-9.0mmol/L) Moderate hyperglycaemia (161-200md/dL/ 9.0-11.0mmol/L) Severe hyperglycaemia (>200mg/dL/ 11.0mmol/L) |
18 16 03 |
46.2 41.0 7.8 |
Body mass index (BMI, Kg/M2) Optimal weight (5th percentile to less than the 85th percentile) Underweight (5th percentile) Overweight (85th to less than the 95th percentile) Obese (equal to or greater than the 95th percentile) |
08 03 22 06 |
20.5 7.8 56.4 15.3 |
From analysis, variables of gender, age category and BMI were assessed for statistical association with hyperglycaemia as indicated in Table 3. Results showed that being obese was six times more to be hyperglycaemic (P=0.000). While those who were overweight didn’t show statistical significance, they were four times more at risk.
Table 3: Factors associated with Hyperglycaemia.
Variable |
Hyperglycaemic, n (%) |
Bivariate analysis AOR* (95% CI) |
P value |
Gender Male Female |
23 (59.0) 16 (41.0) |
1 0.89 (0.77-1.4) |
0.441 |
Age (Months) 6 to 11 12 to 23 24 to 35 36 to 47 48 to 59 |
02 (5.1) 12 (30.8) 09 (23.1) 06 (15.4) 10 (25.6) |
1.05 (0.98-1.73) 1.12 (0.98-1.76) 1.18 (1.03-2.64) 1.24 (0.78-2.31) 1 |
0.755 0.067 0.883 0.642 - |
Body mass index Optimal weight Underweight Overweight Obese |
08 (20.5) 03 (7.8) 22 (56.4) 06 (15.4) |
1 0.93 (0.86-1.1) 3.88 (2.81-4.26) 6.48 (4.33-8.82) |
- 0.417 0.123 0.000 |
The 13.7 % prevalence of hyperglycemia in this study is higher than the 0.4% that was reported in Tunisia [17], and 0.3% found in Iran [18] among school children population. The prevalence from this study is high and is ascribed to the fact that critically ill children who delayed to seek for health care were the study participants whose clinical state could have a surge in glucose levels following stress. Most of the children on our study who had hyperglycemia had only a mild-to-moderate degree. The phenomenon is similar to what was reported in Tunisia [17]. While this may not appear worrisome at first glance, numerous reports have indicated that even mild or moderate hyperglycemia is associated with increased morbidity and mortalities [2,4,7,11]. As found in other studies, obesity was strongly associated with hyperglycemia, a finding similar to reports in other countries [8,12]. This is ascribed to the metabolic dysfunction that involves mitochondrial patterns to regulate both fat accumulation (obesity) and glycolysis (hyperglycemia) [2]. Limitations of our study include that we did not determine glycated hemoglobin levels, the gold standard for hyperglycemia due to cost barriers. Further, the study participants were not fasting, it therefore leaves a gap in elucidating the actual picture based on fasting blood glucose levels. Additionally, our study was at a referral hospital and hence may be highly selective with the more severe forms of hyperglycemia being seen in this setting. Being a cross sectional study, causality is not well established.
Based on the study findings, we draw the following conclusions: a) hyperglycemia was prevalent among children under-five years attending OPD clinics at HICH for illness, b) most of the affected children had a mild-to-moderate hyperglycemia and not suspected by either health workers or the caregivers. This lack of suspicion impedes their medical support. The findings suggest that glucose testing needs to become part of routine care in the OPD clinic. When abnormal, counseling needs to be emphasized. If the child is obsess, even more efforts are needed to address the problem. Community outreaches to the settings served by this referral hospital are needed to determine how widespread the problem is and how best intervention can be managed. This is needed to decrease complications and mortality over time.
The authors wish to thank the staff of Holy Innocent Childrens’ Hospital who supported this work. We are grateful to Micro Research (www.Microresearch.ca ) particularly Noni E MacDonald for the help with final editing of the manuscript.
This work did not receive any funding.
GFS, CA and IMT participated in study conception and design, data acquisition, analysis and interpretation, manuscript drafting and revising. CA and IMT critically revised the manuscript. All authors read and approved the final manuscript.
The author reports no conflicts of interest in this work.
- Kelishadi R (2007) Childhood overweight, obesity and the metabolic syndrome in developing countries. Epidemiol Rev 29: 62-76. [Crossref]
- Lloyd L, Langley-Evans S, McMullen S (2011) Childhood obesity and risk of the adult metabolic syndrome: a systematic review. International Journal of Obesity 36: 1-11.
- Wabitsch M, Hauner H, Hertrampf M, Muche R, Hay B, et al. (2004) Type II diabetes mellitus and impaired glucose regulation in Caucasian children and adolescents with obesity living in Germany. International Journal of Obesity and Related Metabolic Disorders 28: 307-313.
- Osei K, Schuster DP, Amoah AG, Owusu SK (2003) Diabetes in Africa. Pathogenesis of type 1 and type 2 diabetes mellitus in Sub-Saharan Africa: implications for transitional populations. J Cardiovasc Risk 10: 85-96. [Crossref]
- Reilly JJ, Kelly J (2011) Long-term impact of overweight and obesity in childhood and adolescence on morbidity and premature mortality in adulthood: Systematic review. Int J Obes 35: 891-898. [Crossref]
- Thibault H, Contrand B, Saubusse E, Baine M, Maurice-Tison S (2010) Risk factors for overweight and obesity in French adolescents: Physical activity, sedentary behavior and parental characteristics. Nutrition 26: 192-200. [Crossref]
- Maddah M, Nikooyeh B (2010) Factors associated with overweight in children in Rasht, Iran: Gender, maternal education, skipping breakfast and parental obesity. Public Health Nutr 13: 196-200. [Crossref]
- Weiss R, J Dzuira, Burgert T, Tamborlane WV, Taksali SE, et al. (2004) Obesity and the metabolic syndrome in children and adolescents. N Engl J Med 350: 2362-2374. [Crossref]
- Hendrie G, Coveney J, Cox D (2011) Defining the complexity of childhood obesity and related behaviours within the family environment using structural equation modelling. Public Health Nutr 15: 48-57. [Crossref]
- Kilpatrick E, Rigby A, Atkin S (2007) Insulin resistance, the metabolic syndrome, and complication risk in type 1 diabetes. Diabetes Care 30: 707-712. [Crossref]
- Faustino E, Bogue C (2010) Relationship between Hypoglycemia and Mortality in Critically ill Children. Pediatr Crit Care Med 11: 690-698. [Crossref]
- Wintergerst K, Buckingham B, Gandrud L, Wong BJ, Kache S, et al. (2006) Association of Hypoglycemia, Hyperglycemia, and Glucose Variability with Morbidity and Death in the Pediatric intensive Care Unit. Pediatrics 118: 173-179. [Crossref]
- Zimmermann M, Gubeli C, Puntener C, Molinari L (2004) Detection of overweight and obesity in national sample of 6-12-y-old Swiss children: Accuracy and validity of reference values for body mass index from the US Centers for Disease Control and Prevention and International Obesity Task Force. American Journal of Clinical Nutrition 79: 838-843.
- Centre for Disease Control & Prevention (2015) Healthy Weight, Assessing Your Weight About Child & Teen BMI.
- Cole T, Bellizzi MC, Flegal KM, Dietz WH (2000) Establishing a standard definition for child overweight and obesity worldwide: International survey. BMJ 320: 1240-1243. [Crossref]
- American Diabetes Association (2005).
- Ghannem H, Harrabi I, Gaha R, Trabelsi L, Chouchene I, et al. (2001) Epidemiology of diabetes in a school children population in Tunisia. Diabetes &Metabolism 27: 613-617.
- Chahkandi T, Taheri F, Kazemi T, Bijari B (2015) The Prevalence of Diabetes and Prediabetes Among Elementary School Children in Birjand. Iran J Pediatr 25: e183. [Crossref]