Abstract
The present study aimed to develop and validate a simple, precise, and accurate UV spectrophotometric method for the estimation of atorvastatin in bulk and pharmaceutical dosage forms. The method exhibited excellent linearity over the concentration range of 20–120 µg/ml with a correlation coefficient (R²) of 0.9996 and a regression equation of y = 0.01x + 0.0048. Precision was confirmed through intra-day and inter-day studies, showing low %RSD values of 0.2598 and 0.2987, respectively. Accuracy, evaluated via recovery studies at 80%, 100%, and 120% concentration levels, yielded a mean recovery of 99.65% ± 1.25, demonstrating the method’s reliability. The method also proved sensitive with a Limit of Detection (LOD) of 0.19872 µg/ml and a Limit of Quantification (LOQ) of 0.652387 µg/ml. Specificity studies confirmed no interference from formulation excipients. Additional parameters, including molar absorptivity (2289.23) and Sandell’s sensitivity (0.125), further validated the method’s robustness. The results affirm that this UV spectrophotometric method meets ICH validation criteria and is suitable for routine quality control of atorvastatin.
Keywords
atorvastatin, UV Spectrophotometry, method development, validation
Introduction
The creation of straightforward and repeatable analytical techniques for medication estimation is a crucial component of quality assurance and control. A member of the statin medication class, atorvastatin is used to treat hypercholesterolaemia and associated conditions [1,2]. The parent component of atorvastatin is a white to off white powder that is insoluble in distilled water or very little soluble in it, soluble to readily soluble in methanol, and insoluble in aqueous solutions at pH 4. Chemically Atorvastatin is [R-(R’,R’)]-2-(4-fluorophenyl)-β,δ-dihydroxy-5-(1-methylethyl)-3-phenyl-4-[(phenylamino)carbonyl]-1H-pyrrole-1-heptanoic acid (Figure 1). The 3-hydroxy methyl glutaryl coenzyme A (HMG-CoA) reductase enzyme, which is involved in converting HMG-CoA to mevalonate (a precursor of sterols, including cholesterol), is selectively and competitively inhibited by atorvastatin. Patients with hypercholesterolaemia, mixed dyslipidaemia, and homozygous familial hypercholesterolaemia are treated with atorvastatin, a selective, competitive HMG-CoA reductase inhibitor, which lowers cholesterol and triglycerides. HMG-CoA reductase inhibitors also lower blood levels of VLDLs (very low-density lipoproteins) by preventing their production and encouraging their breakdown, which is another way they lower cholesterol.
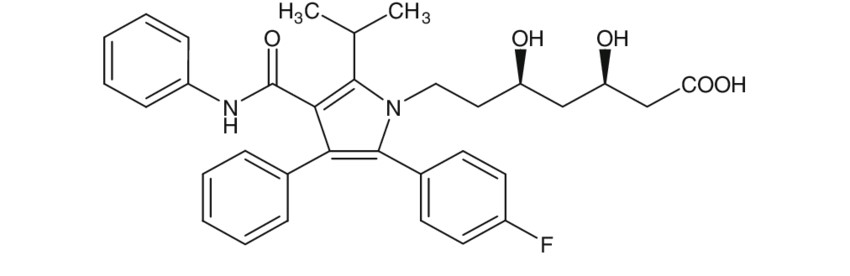
Figure 1. Atorvastatin chemical structure
In order to improve the uptake and degradation of LDL, atorvastatin additionally raises the hepatic LDL receptors on the cell surface and suppresses the liver's production of cholesterol. Additionally, the medication lowers both the quantity of LDL particles and their synthesis [3-6]. There is a need to develop and validate a UV spectroscopic method for atorvastatin to ensure a simple, cost-effective, and reliable analytical approach for its quantitative estimation in pharmaceutical formulations. UV spectroscopy offers a rapid and accessible alternative to more complex techniques like HPLC, making it suitable for routine quality control, especially in resource-limited settings. Method validation is essential to confirm that the developed procedure is accurate, precise, specific, and reproducible according to regulatory standards, thereby ensuring consistent drug quality, efficacy, and patient safety [7-10].
Molecular Formula: C33H35FN2O5
Molecular Weight: 558.6 g/mol.
Materials and methods
UV spectroscopic method:
A UV-Visible Spectrophotometer (UV-1700 SHIMADZU) with 10 mm matched quartz cells was used for Spectrophotometric method. All weighing were done on electronic balance (Model Shimadzu AUW-220D) [11].
Reagents and chemicals:
Atorvastatin (pure drug) was received as a gift sample from Dr. Reddy’s Laboratories, Hyderabad and ethanol was purchased from Research-Lab Fine Chem Industries, Mumbai.
Preparation of standard stock solution:
Standard stock solution of atorvastatin was prepared by accurately weighing 10 mg of the drug, and dissolved in 100 ml ethanol.
Determination of analytical wavelength:
0.1 ml of the stock solution mentioned above was pipetted into a 10-ml volumetric flask, and the volume was increased to 10 ml using ethanol. After that, the sample was scanned from 200 to 400 nm in a UV spectrophotometer [11].
Preparation of calibration curve:
A series of 10 ml volumetric flasks were filled with 2 to 12 ml portions of stock solutions, and the volume was adjusted with ethanol. Serial dilutions were made in the following ranges: 20, 40, 60, 80, 100, and 120 µg/ml. At λmax 241 nm, the absorbance was measured [11].
UV method validation
Linearity and range:
A series of 10 ml volumetric flasks were filled with 2 to 12 ml portions of stock solutions, and the volume was adjusted with ethanol. Serial dilutions were made in the following ranges: 20, 40, 60, 80, 100, and 120 µg/ml. At λmax 241 nm, the absorbance was measured [12].
Precision:
The accuracy of the approach was verified using recovery experiments. Following three rounds of each solution, the recovery percentage was calculated. The accuracy of the approach was demonstrated by studies of intra- and inter-day variance.
Limit of detection (LOD) and Limit of quantification (LOQ):
LOD and LOQ were calculated by the equations;
LOD = 3.3ϭ/ S and LOQ = 10ϭ/S
Where S is the slope of the calibration curve and ϭ is the residual standard deviation [12].
Recovery study:
Through recovery trials, the method's accuracy was examined. At 80, 100, and 120% of the atorvastatin standard concentration, the recovery was carried out. The recovery samples were made for each recovery level according to the previously described process. Following analysis of the solutions, the calibration curve was used to determine the percentage recoveries [12].
Results
Precision:
The method's accuracy was assessed for atorvastatin. The method's repeatability (intra-day precision) and reproducibility (inter-day precision) were assessed in the same lab. The results were, respectively, 0.2598 and 0.2987 (Table 01).
Precision |
Intra-Day Precision* |
Inter-Day Precision* |
Result |
0.2598 |
0.2987 |
Table 1. Precision determinations
Accuracy (Recovery study):
Through recovery trials, the method's accuracy was examined. At three different atorvastatin standard concentrations—80, 100, and 120%—the recovery was carried out. For every level of recovery, three samples were created. Following analysis of the solutions, the calibration curve was used to determine the percentage recoveries. The approach has good repeatability, as evidenced by the atorvastatin recovery value of 99.65 ± 1.25 (Table 2).
Formulation stock |
Total conc |
Drug Recovered |
% Recovery |
Mean % Recovery |
SD |
%RSD |
32 |
72 |
72 |
100 |
99 |
0.0789 |
0.7896 |
32 |
72 |
72.1 |
99 |
32 |
72 |
71.99 |
99 |
40 |
80 |
80 |
100 |
99.99 |
0.00698 |
0.006982 |
40 |
80 |
79.99 |
99.928 |
40 |
80 |
80 |
100 |
48 |
88 |
87.9 |
99.9887 |
99.98 |
0.05489 |
0.05384 |
48 |
88 |
88 |
100 |
48 |
88 |
88 |
100 |
| |
Mean |
99.65 |
0.04541 |
0.043316 |
Table 2. Recovery study
Limit of detection (LOD) and limit of quantification (LOQ):
Limit of detection and limit of quantification was found to be 0.19872 & 0.652387 respectively
Specificity:
The method's specificity is its capacity to precisely quantify the analyte response when all possible sample constituents (excipients) are present. The outcomes were contrasted with an investigation of generic atorvastatin and tablet forms. The solid dosage form's excipients had no effect on the analyte. Validation parameters as provided in Table 3. A typical UV spectrum of atorvastatin is provided as per Figure 2 and calibration curve in Figure 3.

Figure 2. A typical UV Spectrum of Atorvastatin

Figure 3. Calibration Curve of Atorvastatin
Parameter |
Result |
Linearity range |
20-120 µg/ml |
Regression eq. |
y=0.01x + 0.0048 |
Correlation coeficient |
0.9996 |
Slope (m) |
0.01 |
Avg % RSD |
0.364392 |
SD Average |
0.000606 |
λmax |
241 nm |
LOD |
0.19872 |
LOQ |
0.652387 |
Molar absorptivity |
2289.23 |
Sandells sensitivity |
0.125 |
Interday precision |
0.2987 |
Intraday precision |
0.2598 |
Table 3. Validation parameters
Discussion
The present study focused on developing and validating a UV spectrophotometric method for the estimation of atorvastatin, and the results demonstrate that the method is reliable, reproducible, and accurate for routine analysis. Precision studies, both intra-day and inter-day, revealed low %RSD values of 0.2598 and 0.2987 respectively, confirming that the method possesses excellent repeatability and reproducibility under similar laboratory conditions. Accuracy was evaluated using a standard recovery method at three different concentrations (80%, 100%, and 120%). The mean recovery rate was found to be 99.65% ± 1.25, which falls well within the acceptable limits, indicating that the method is accurate and unaffected by matrix interferences or excipients. The standard deviation and %RSD values were minimal, supporting the reliability of the recovery data [13-15]. The method showed a strong linear relationship in the concentration range of 20–120 µg/ml, with a correlation coefficient (R²) of 0.9996, signifying excellent linearity. The regression equation obtained (y = 0.01x + 0.0048) further supports the method's suitability for quantitative analysis [16].
The Limit of Detection (LOD) and Limit of Quantification (LOQ) were determined to be 0.19872 µg/ml and 0.652387 µg/ml respectively, suggesting that the method is sensitive enough to detect and quantify even trace levels of atorvastatin [16,17]. In terms of specificity, the method effectively differentiated atorvastatin in the presence of excipients, as there was no interference observed from the tablet formulation, confirming that the method is specific for atorvastatin alone. Additional validation parameters, such as the molar absorptivity (2289.23) and Sandell’s sensitivity (0.125), further underscore the method’s robustness and sensitivity [18]. Overall, the validated UV spectrophotometric method fulfils all the ICH validation criteria, proving to be simple, accurate, precise, specific, and sensitive. Hence, it is suitable for the routine analysis of atorvastatin in bulk and pharmaceutical dosage forms.
Conclusion
The UV spectrophotometric method developed for the estimation of atorvastatin has been successfully validated in accordance with ICH guidelines. The method demonstrated excellent linearity, precision, accuracy, specificity, and sensitivity, with minimal interference from excipients. The low values of LOD and LOQ indicate the method’s capability to detect and quantify even small concentrations of atorvastatin. Given its simplicity, cost-effectiveness, and robustness, this method is well-suited for routine quality control and analysis of atorvastatin in both bulk and pharmaceutical dosage forms.
Conflicts of interest
The authors declare no conflicts of interest.
Acknowledgement
We are thankful to Shri Venkateshwara University.
Author’s contribution
Concept and design: Shoaeb Mohammad Syed, methodology and original draft: Deepika Kumari, critical revision: Shoaeb Mohammad Syed and Deepika kumari
References
- Pradhan KK, Mishra US, Pattnaik S, Panda CK, Sahu KC (2011) Development and validation of a stability-indicating UV spectroscopic method for candesartan in bulk and formulations. Indian J Pharm Sci 73: 693-696. [Crossref]
- Quevedo AC, Guggenheim E, Briffa SM, Adams J, Lofts S, et al. (2021) UV-Vis spectroscopic characterization of nanomaterials in aqueous media. J Vis Exp 176. [Crossref].
- Neuhaus O, Hartung HP (2007) Evaluation of atorvastatin and simvastatin for treatment of multiple sclerosis. Expert Rev Neurother 7: 547-556. [Crossref].
- Akl MA, Ryad S, Ibrahim MF, Kassem AA (2023) Formulation, and optimization of transdermal Atorvastatin Calcium-Loaded Ultra-flexible vesicles; ameliorates poloxamer 407-caused dyslipidemia. Int J Pharm 638: 122917. [Crossref]
- Aldosari BN, Almurshedi AS, Alfagih IM, AlQuadeib BT, Altamimi MA, et al. (2021) Formulation of Gelucire®-based solid dispersions of atorvastatin calcium: In vitro dissolution and in vivo bioavailability study. AAPS PharmSciTech 22: 161. [Crossref].
- Eita AS, Makky AM, Anter A, Khalil IA (2022) Atorvastatin-loaded emulsomes foam as a topical antifungal formulation. Int J Pharm X. 2022 4: 100140. [Crossref]
- Analakkattillam S, Langsi VK, Hanrahan JP, Moore E (2022) Analytical method validation for assay determination of cannabidiol and tetrahydrocannabinol in hemp oil infused products by RP-HPLC. Sci Rep 12: 12453. [Crossref]
- Fei M, Zhang Q, Zhang L, Zhu X, Du C, et al. (2023) Development and validation of aggregates analysis method in analytical similarity assessment of HLX04 vs Avastin®. J Pharm Biomed Anal 223: 115121. [Crossref]
- Huang TC, Chu G, Singh S (2023) Analytical method development, validation, and out-of-specification investigations for polyethylene glycol. J Pharm Biomed Anal 235: 115613. [Crossref]
- Patel R, Purohit S, Solanki R, Khunt D, Patel C, et al. (2023) Development and validation of an analytical method for trace‐level quantification of genotoxic nitrosamine impurities in losartan and hydrochlorothiazide fixed‐dose combination tablets using ultra performance liquid chromatography triple quadrupole mass spectrometry. Rapid Commun Mass Spectrom 37: e9488. [Crossref]
- Syed SM, Farooqui ZS, Gawale K, Hamde D (2020) A validated UV Spectroscopic method for determination of Levamisole HCl. Int J Pharm Res Appl 5: 97-101.
- K Gawale, Shoaeb Mohammad Syed (2021) Development and validation of UV spectroscopic and RPHPLC Method for determination of levetiracetam in bulk and combined dosage form. J Pharm Appl Chem 7: 23-30.
- Alqahtani A, Alqahtani T, Al Fatease A, Tolba EH (2024) Rapid UV-Vis spectrophotometric method aided by firefly-PLS models for the simultaneous quantification of ciprofloxacin, lomefloxacin, and enrofloxacin in their laboratory mixture, dosage forms and water samples: Greenness and blueness assessment. BMC Chem 18: 172. [Crossref]
- Serag A, Abduljabbar MH, Althobaiti YS, Almutairi FM, Alsharif ST, et al. (2025) UV-Vis spectroscopy coupled with firefly algorithm-enhanced artificial neural networks for the determination of propranolol, rosuvastatin, and valsartan in ternary mixtures. Sci Rep 15: 10838. [Crossref]
- Abdelshakour MA, Attala K, Elsonbaty A, Abdel Salam RA, Hadad GM, et al. (2023) Eco-friendly UV-spectrophotometric methods employing magnetic nano-composite polymer for the extraction and analysis of sexual boosters in adulterated food products: Application of computer-aided design. J AOAC Intl 106: 1608-1619. [Crossref]
- Syed S, Mohammed MU (2014) Validation of UV spectrophotometric method for determination of atenolol. Intl J Pharm Res 6: 25-27.
- Jain PS, Chaudhari AJ, Patel SA, Patel ZN, Patel DT (2011) Development and validation of the UV-spectrophotometric method for determination of terbinafine hydrochloride in bulk and in formulation. Pharm Methods 2: 198-202. [Crossref]
- Syed SM, Marathe RP, Mahaparale PR (2019) Analytical method development and validation of RP-HPLC method for determination of eletriptan HBr. J Curr Pharm Res 10: 3535-3542.